| Param | Original file | Final file |
|---|---|---|
| Filename | modeM0/AS1A13_037T01_9000006476_52491cztM0_level2.fits | modeM0/AS1A13_037T01_9000006476_52491cztM0_level2_quad_clean.evt |
| Size (bytes) | 2,843,156,160 | 188,239,680 |
| Size | 2.6 GB | 179.5 MB |
| Events in quadrant A | 13,762,078 | 1,578,979 |
| Events in quadrant B | 13,935,594 | 1,751,886 |
| Events in quadrant C | 27,800,750 | 1,059,703 |
| Events in quadrant D | 48,292,542 | 6,817 |
| Mode M9 | |||
|---|---|---|---|
| Quadrant | BADHDUFLAG | Total packets | Discarded packets |
| A | 0 | 10 | 0 |
| B | 0 | 10 | 0 |
| C | 0 | 10 | 0 |
| D | 0 | 10 | 0 |
| Mode M0 | |||
|---|---|---|---|
| Quadrant | BADHDUFLAG | Total packets | Discarded packets |
| A | 0 | 56616 | 2727 |
| B | 0 | 55057 | 785 |
| C | 0 | 98282 | 2659 |
| D | 0 | 159874 | 3296 |
| Mode SS | |||
|---|---|---|---|
| Quadrant | BADHDUFLAG | Total packets | Discarded packets |
| A | 0 | 390 | 6 |
| B | 0 | 388 | 4 |
| C | 0 | 387 | 3 |
| D | 0 | 387 | 5 |
| Quadrant | Total seconds | Saturated seconds | Saturation percentage |
|---|---|---|---|
| A | 18857 | 1759 | 9.328101% |
| B | 18900 | 1470 | 7.777778% |
| C | 18858 | 6910 | 36.642274% |
| D | 18854 | 18803 | 99.729500% |
Noise dominated data is calculated using 1-second bins in cleaned event files. If a bin has >2000 counts, and if more than 50% of those come from <1% of pixels, then it is considered to be noise-dominated and hence unusable.
| Quadrant | # 1 sec bins | Bins with >0 counts | Bins with >2000 counts | High rate bins dominated by noise | Noise dominated (total time) | Noise dominated (detector-on time) | Marked lightcurve |
|---|---|---|---|---|---|---|---|
| A | 20439 | 18866 | 1132 | 1132 | 5.54% | 6.00% | 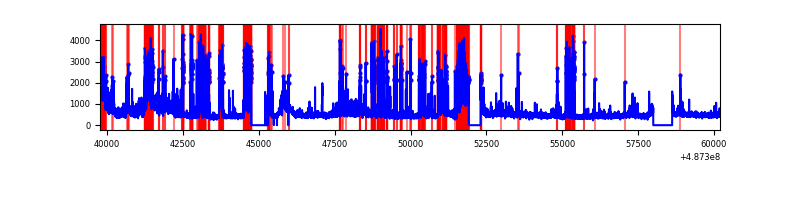 |
| B | 20440 | 18927 | 795 | 795 | 3.89% | 4.20% | 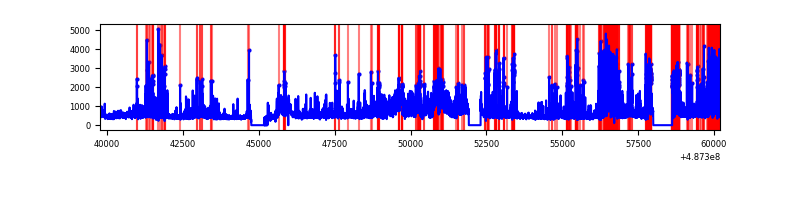 |
| C | 20440 | 18877 | 5486 | 5486 | 26.84% | 29.06% | 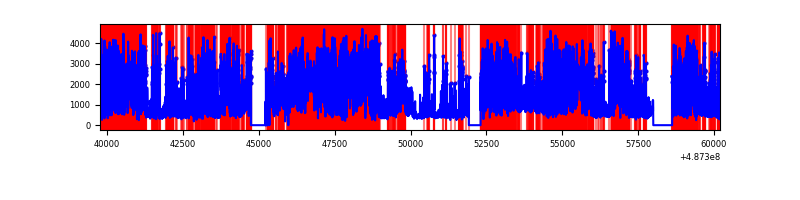 |
| D | 20439 | 18855 | 18143 | 18143 | 88.77% | 96.22% | 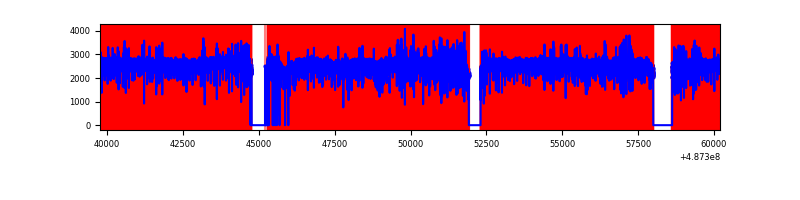 |
Top three noisy pixels from each quadrant. If the there are fewer than three noisy pixels in the level2.evt file, extra rows are filled as -1
| Pixel properties | Quadrant properties | ||||||
|---|---|---|---|---|---|---|---|
| Quadrant | DetID | PixID | Counts | Sigma | Mean | Median | Sigma |
| A | 8 | 26 | 3306575 | 6826.26 | 1986 | 1935 | 484.1 |
| A | 3 | 45 | 1322855 | 2728.57 | 1986 | 1935 | 484.1 |
| A | 13 | 248 | 176034 | 359.63 | 1986 | 1935 | 484.1 |
| B | 10 | 44 | 2639315 | 6175.05 | 1993 | 1920 | 427.1 |
| B | 10 | 254 | 1977413 | 4625.31 | 1993 | 1920 | 427.1 |
| B | 4 | 81 | 376389 | 876.76 | 1993 | 1920 | 427.1 |
| C | 15 | 224 | 14341753 | 31967.67 | 1653 | 1635 | 448.6 |
| C | 2 | 12 | 3328626 | 7416.69 | 1653 | 1635 | 448.6 |
| C | 15 | 231 | 985386 | 2193.02 | 1653 | 1635 | 448.6 |
| D | 15 | 93 | 37299425 | 229188.97 | 563 | 536 | 162.7 |
| D | 6 | 42 | 7406579 | 45507.61 | 563 | 536 | 162.7 |
| D | 2 | 153 | 713136 | 4378.68 | 563 | 536 | 162.7 |
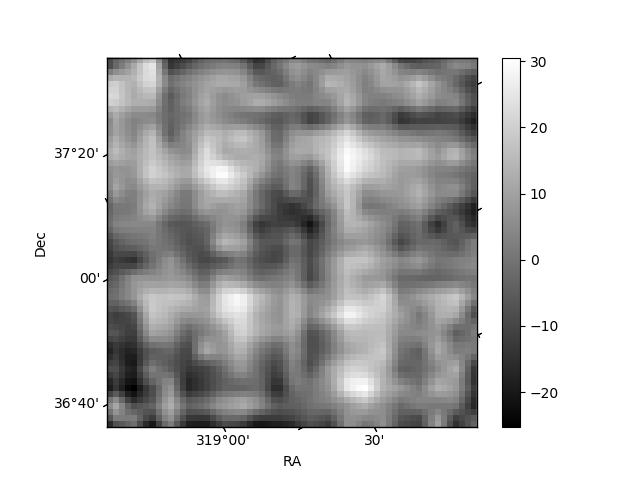
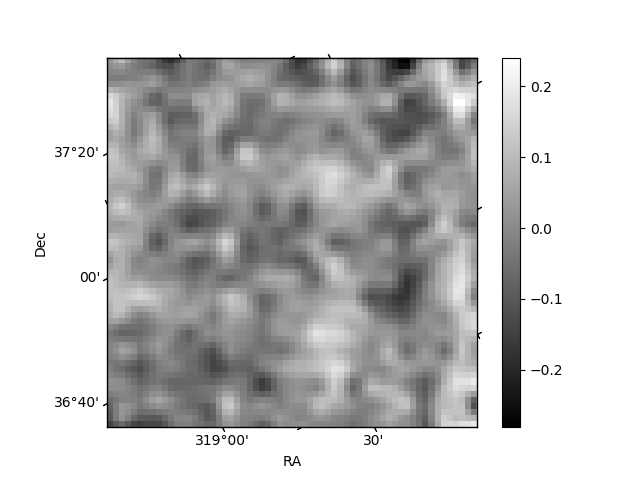
Histogram calculated using DETX and DETY for each event in the final _common_clean file
| Quadrant A | 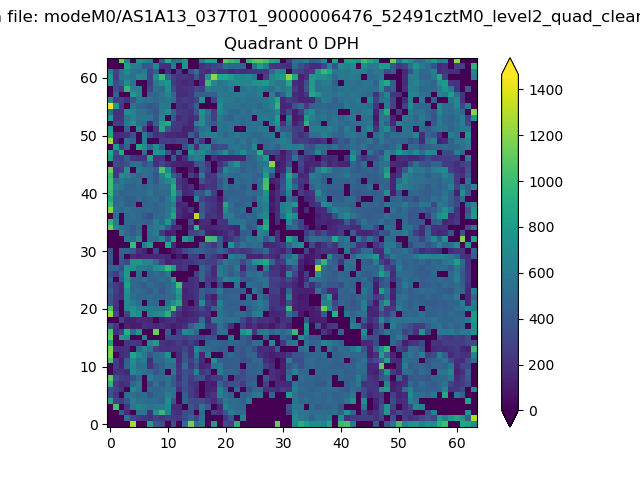 |
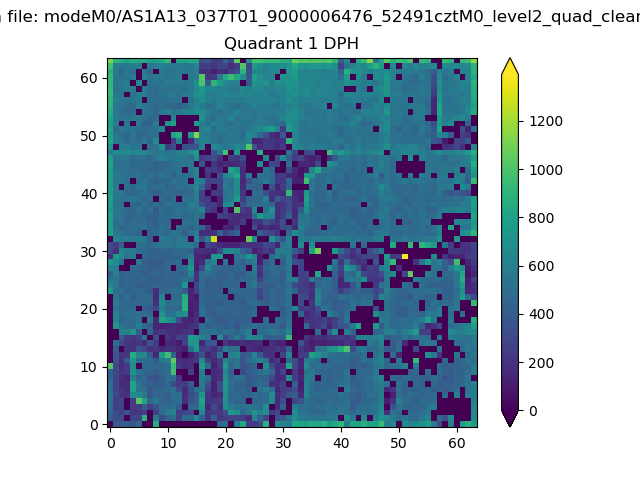 |
Quadrant B |
|---|---|---|---|
| Quadrant D |  |
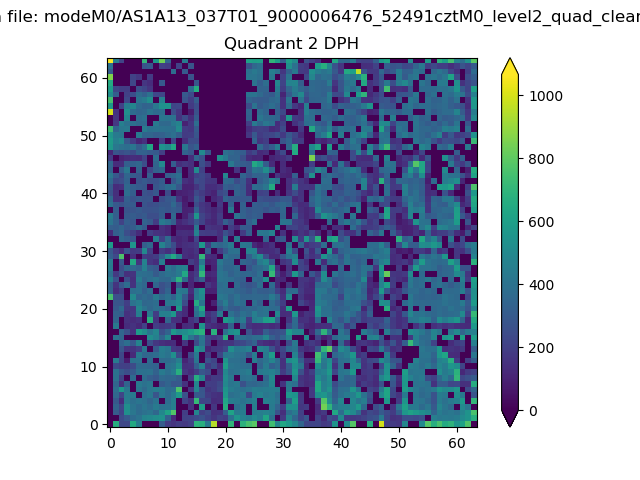 |
Quadrant C |
| Plot type | Count rate plots | Images |
|---|---|---|
| Comparison with Poisson distribution Blue bars denote a histogram of data divided into 1 sec bins. Red curve is a Poisson curve with rate = median count rate of data. |
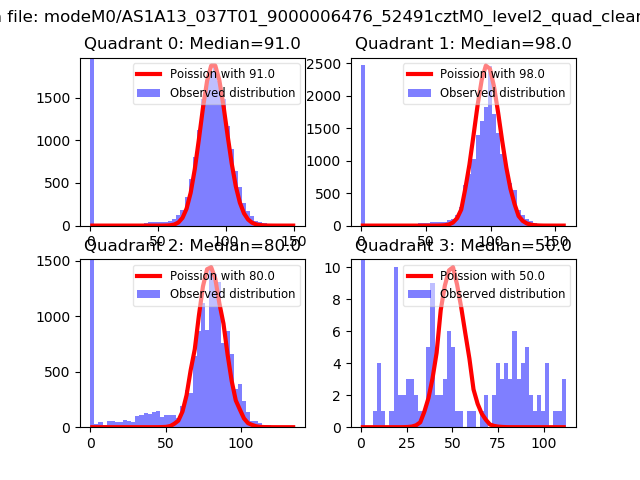 |
 |
| Quadrant-wise count rates Data is divided into 100 sec bins |
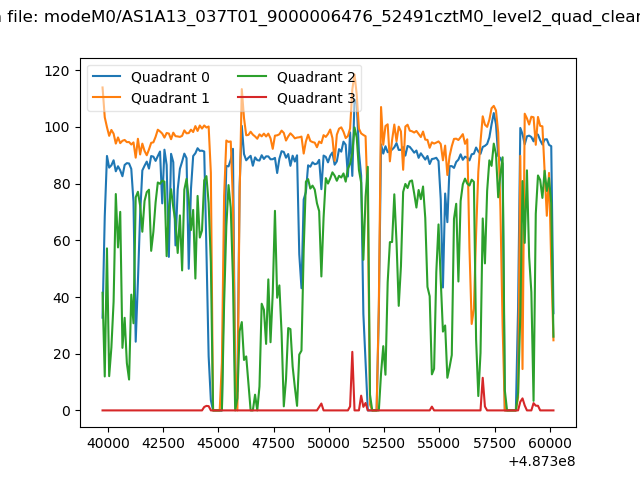 |
|
| Module-wise count rates for Quadrant A Data is divided into 100 sec bins |
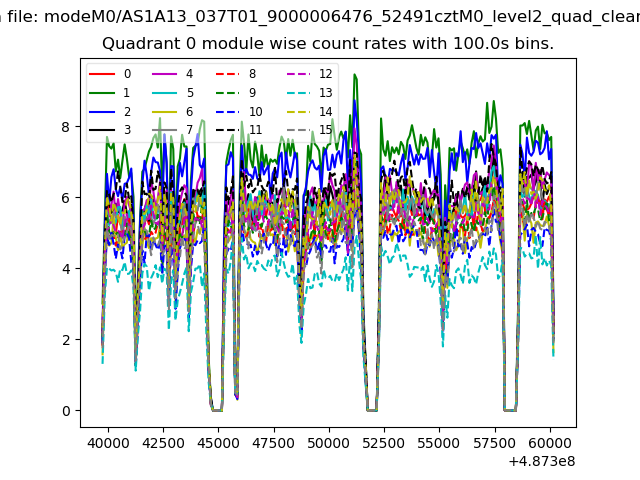 |
 |
| Module-wise count rates for Quadrant B Data is divided into 100 sec bins |
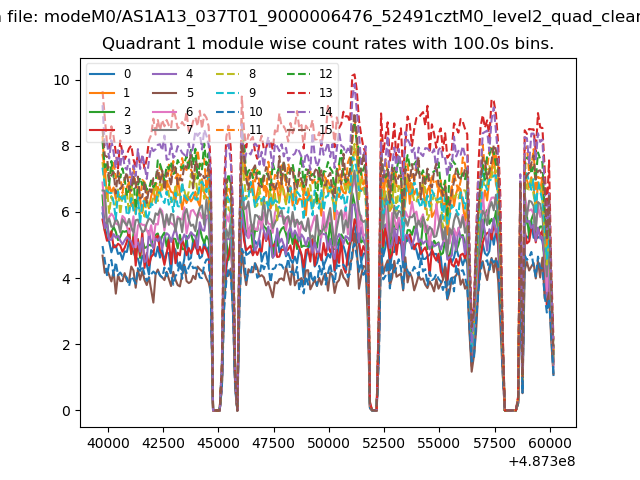 |
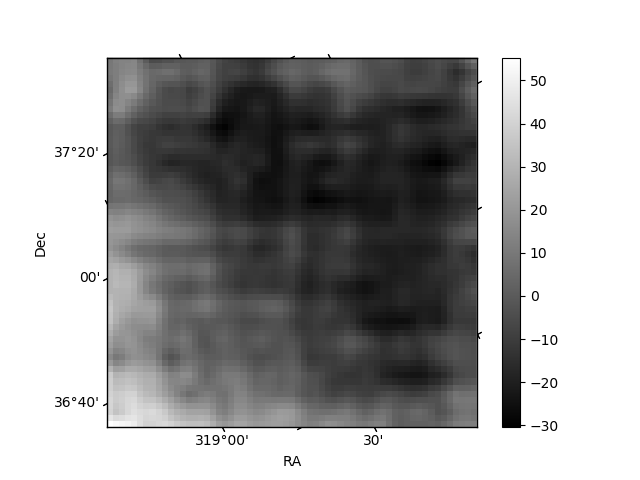 |
| Module-wise count rates for Quadrant C Data is divided into 100 sec bins |
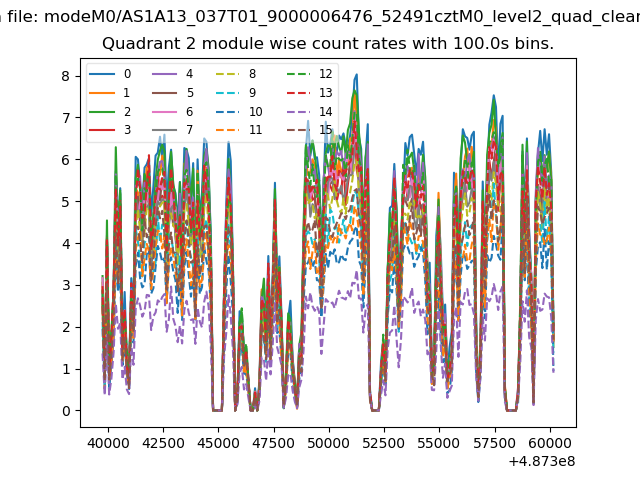 |
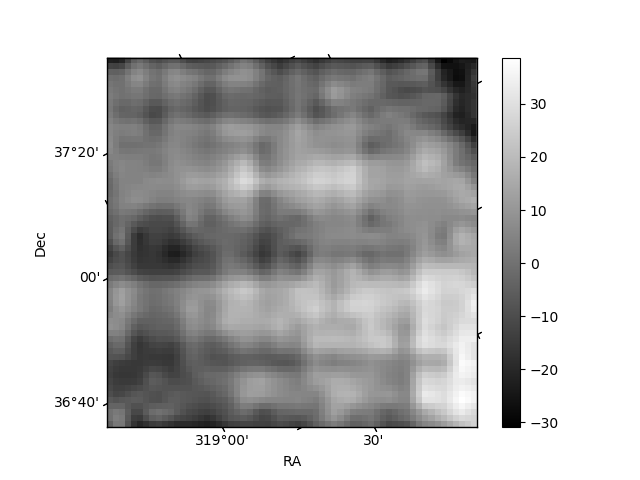 |
| Module-wise count rates for Quadrant D Data is divided into 100 sec bins |
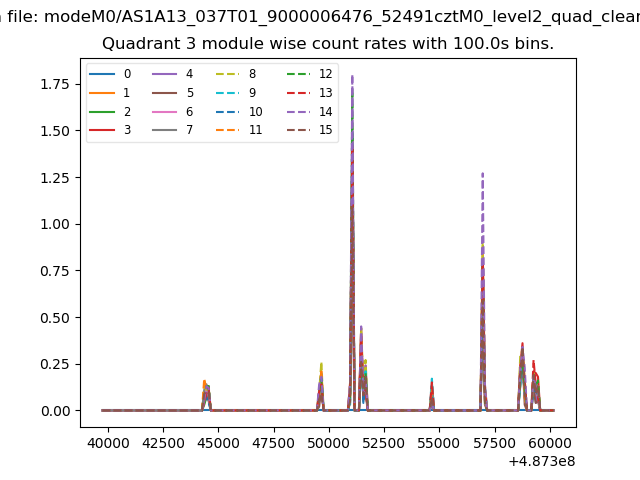 |
 |
| Parameter | Plot |
|---|---|
| CZT HV Monitor | 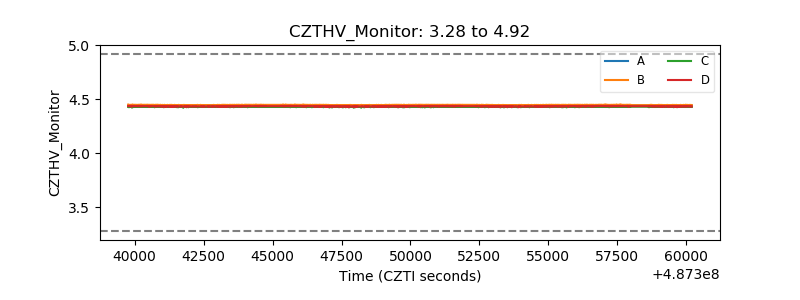 |
| D_VDD | 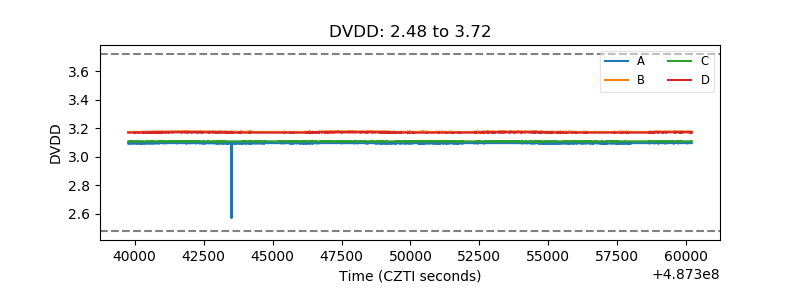 |
| Temperature 1 |  |
| Veto HV Monitor | 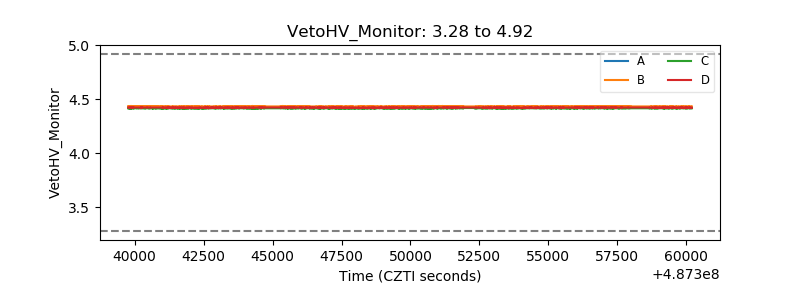 |
| Veto LLD | 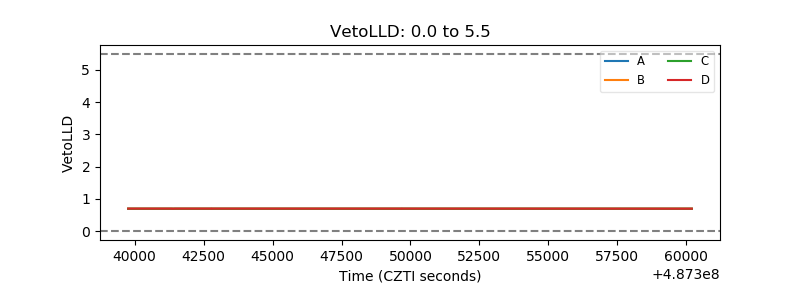 |
| Alpha Counter | 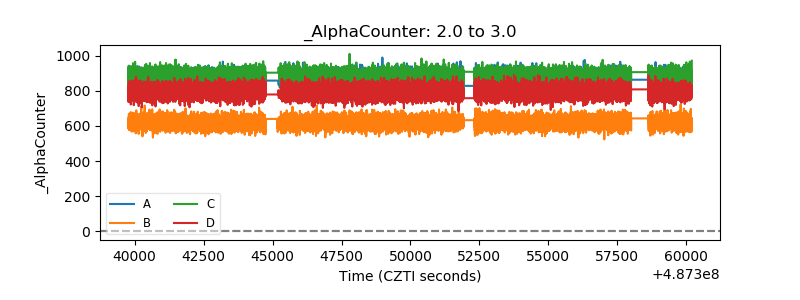 |
| _CPM_Rate | 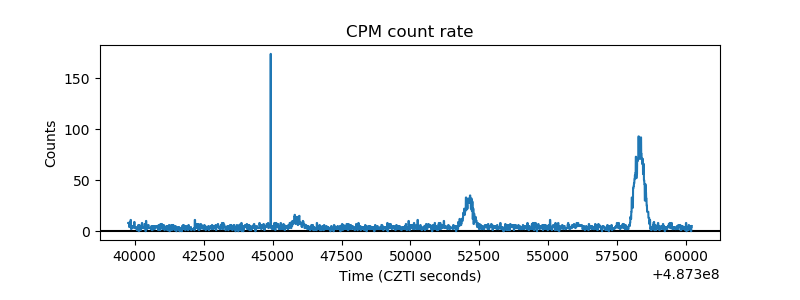 |
| CZT Counter | 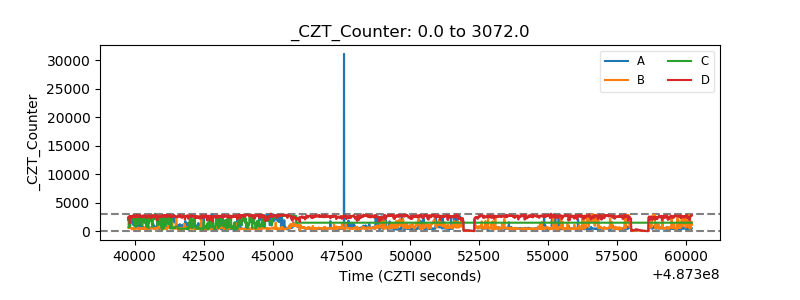 |
| +2.5 Volts monitor | 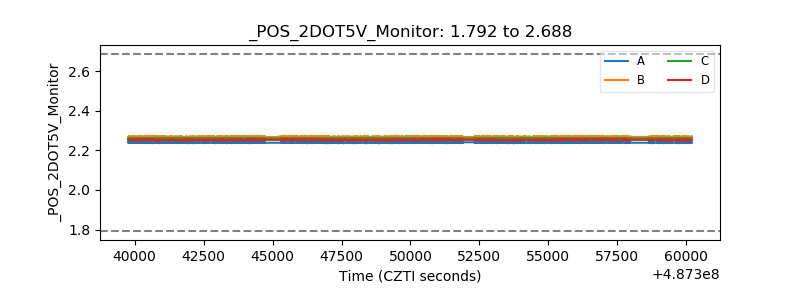 |
| +5 Volts monitor |  |
| _ROLL_ROT | 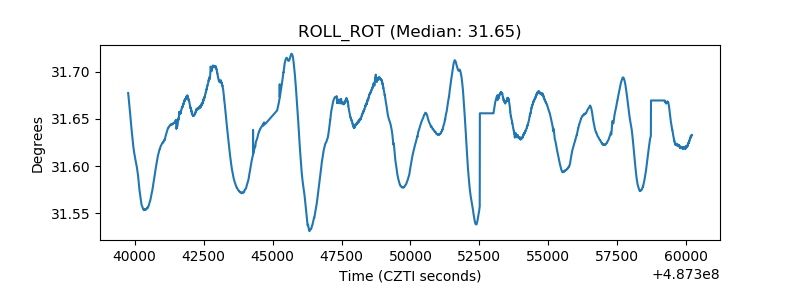 |
| _Roll_DEC | 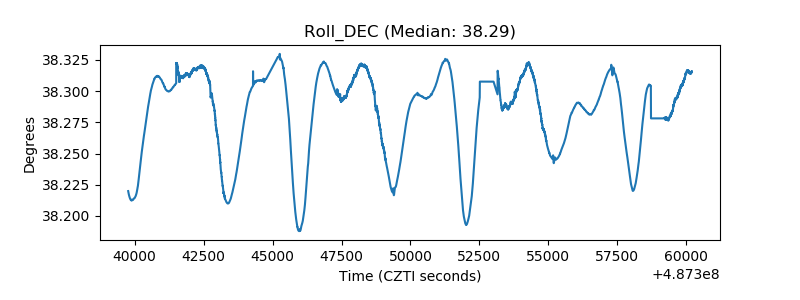 |
| _Roll_RA |  |
| Veto Counter | 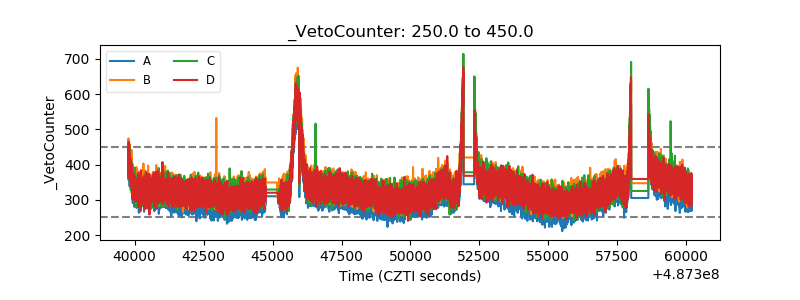 |