| Param | Original file | Final file |
|---|---|---|
| Filename | modeM0/AS1A13_037T01_9000006476_52496cztM0_level2.fits | modeM0/AS1A13_037T01_9000006476_52496cztM0_level2_quad_clean.evt |
| Size (bytes) | 5,258,511,360 | 414,705,600 |
| Size | 4.9 GB | 395.5 MB |
| Events in quadrant A | 21,334,343 | 3,502,438 |
| Events in quadrant B | 33,944,392 | 3,365,160 |
| Events in quadrant C | 51,340,846 | 2,388,403 |
| Events in quadrant D | 85,215,977 | 779,885 |
| Mode M9 | |||
|---|---|---|---|
| Quadrant | BADHDUFLAG | Total packets | Discarded packets |
| A | 0 | 51 | 0 |
| B | 0 | 51 | 0 |
| C | 0 | 51 | 0 |
| D | 0 | 51 | 0 |
| Mode M0 | |||
|---|---|---|---|
| Quadrant | BADHDUFLAG | Total packets | Discarded packets |
| A | 0 | 89783 | 0 |
| B | 0 | 125998 | 0 |
| C | 0 | 177810 | 0 |
| D | 0 | 278510 | 0 |
| Mode SS | |||
|---|---|---|---|
| Quadrant | BADHDUFLAG | Total packets | Discarded packets |
| A | 0 | 746 | 0 |
| B | 0 | 746 | 0 |
| C | 0 | 746 | 0 |
| D | 0 | 746 | 0 |
| Quadrant | Total seconds | Saturated seconds | Saturation percentage |
|---|---|---|---|
| A | 36649 | 1883 | 5.137930% |
| B | 36652 | 5729 | 15.630798% |
| C | 36651 | 12040 | 32.850400% |
| D | 36651 | 28633 | 78.123380% |
Noise dominated data is calculated using 1-second bins in cleaned event files. If a bin has >2000 counts, and if more than 50% of those come from <1% of pixels, then it is considered to be noise-dominated and hence unusable.
| Quadrant | # 1 sec bins | Bins with >0 counts | Bins with >2000 counts | High rate bins dominated by noise | Noise dominated (total time) | Noise dominated (detector-on time) | Marked lightcurve |
|---|---|---|---|---|---|---|---|
| A | 41811 | 36655 | 1169 | 1169 | 2.80% | 3.19% | 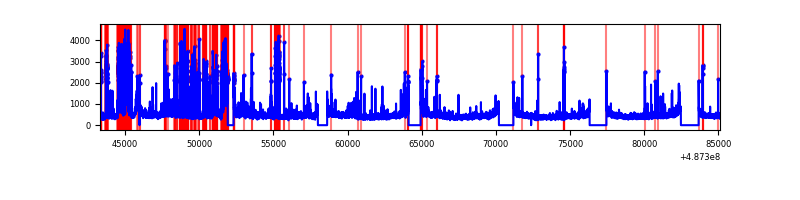 |
| B | 41812 | 36656 | 4526 | 4526 | 10.82% | 12.35% | 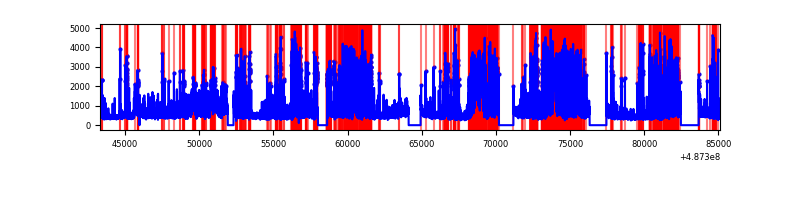 |
| C | 41812 | 36656 | 10212 | 10212 | 24.42% | 27.86% | 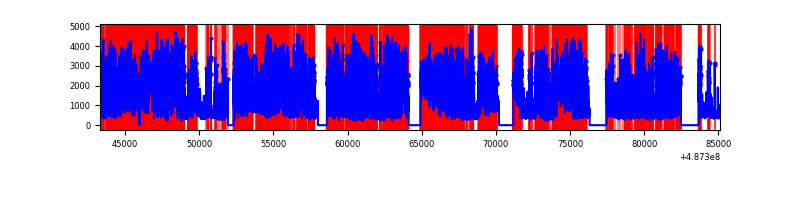 |
| D | 41811 | 36652 | 28170 | 28170 | 67.37% | 76.86% | 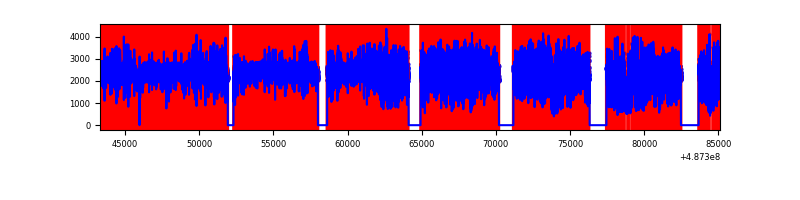 |
Top three noisy pixels from each quadrant. If the there are fewer than three noisy pixels in the level2.evt file, extra rows are filled as -1
| Pixel properties | Quadrant properties | ||||||
|---|---|---|---|---|---|---|---|
| Quadrant | DetID | PixID | Counts | Sigma | Mean | Median | Sigma |
| A | 8 | 26 | 2523474 | 2573.37 | 3932 | 3832 | 979.1 |
| A | 3 | 45 | 1641805 | 1672.9 | 3932 | 3832 | 979.1 |
| A | 11 | 3 | 315139 | 317.95 | 3932 | 3832 | 979.1 |
| B | 10 | 44 | 14558568 | 18457.61 | 3677 | 3544 | 788.6 |
| B | 10 | 254 | 2200422 | 2785.92 | 3677 | 3544 | 788.6 |
| B | 4 | 81 | 648486 | 817.87 | 3677 | 3544 | 788.6 |
| C | 15 | 224 | 27708826 | 31348.01 | 3236 | 3213 | 883.8 |
| C | 2 | 12 | 4386148 | 4959.15 | 3236 | 3213 | 883.8 |
| C | 15 | 248 | 2267019 | 2561.42 | 3236 | 3213 | 883.8 |
| D | 15 | 93 | 57144794 | 95325.9 | 2094 | 1998 | 599.4 |
| D | 6 | 42 | 14633616 | 24408.54 | 2094 | 1998 | 599.4 |
| D | 2 | 62 | 1440315 | 2399.41 | 2094 | 1998 | 599.4 |
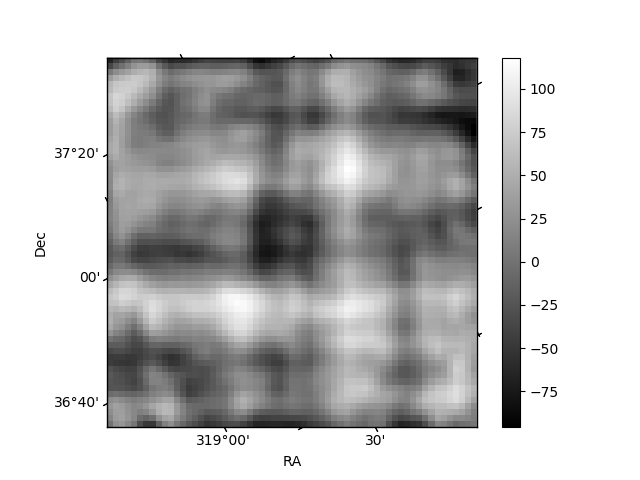
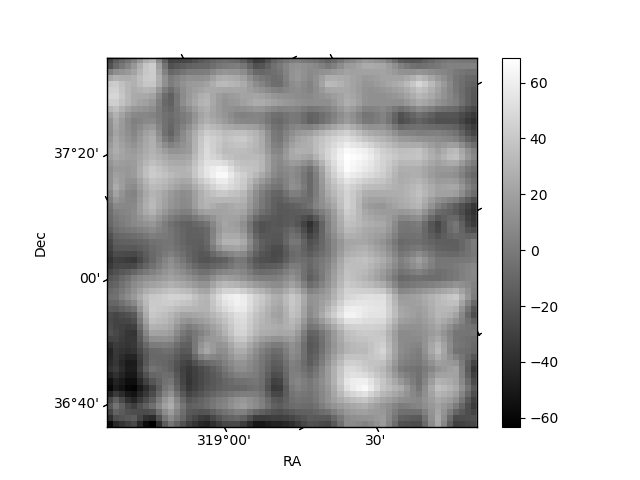
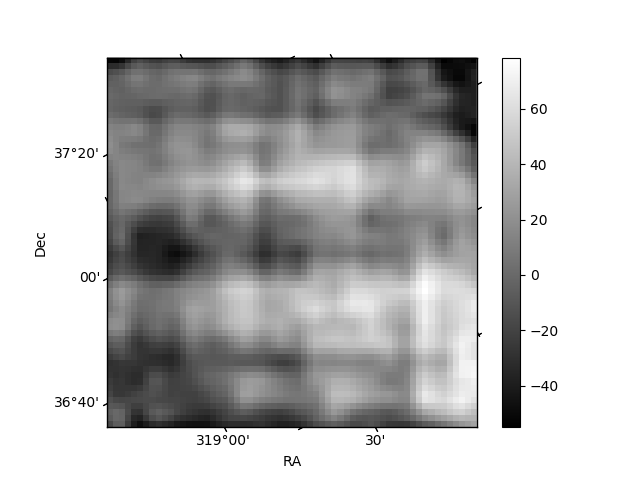
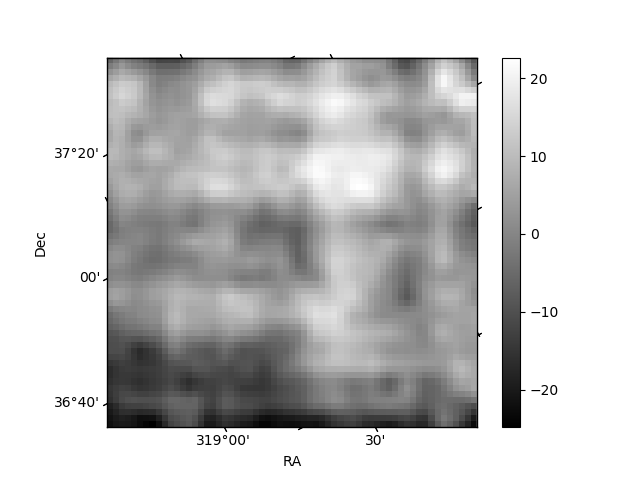
Histogram calculated using DETX and DETY for each event in the final _common_clean file
| Quadrant A | 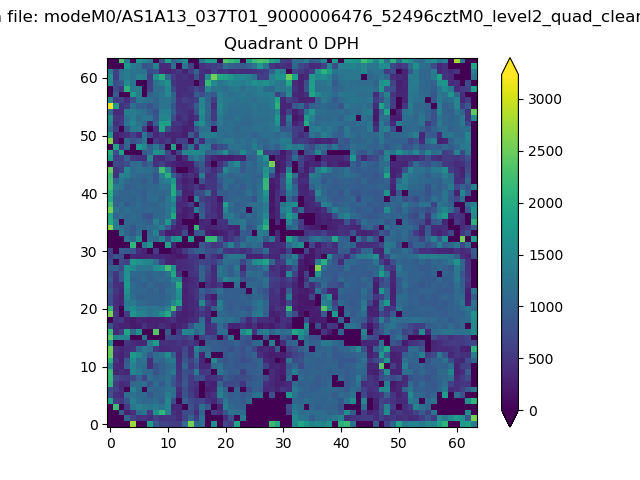 |
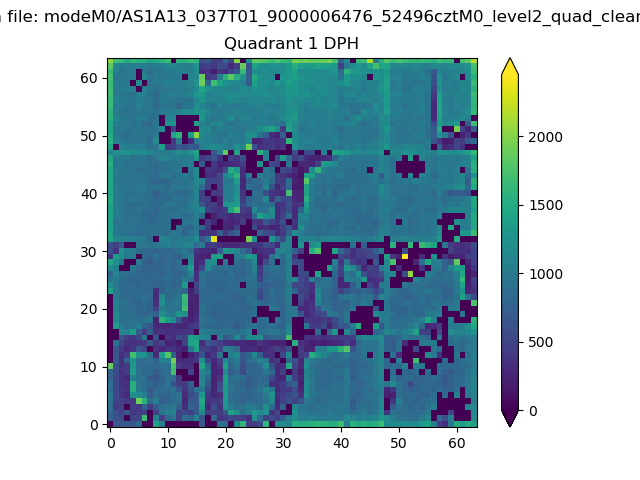 |
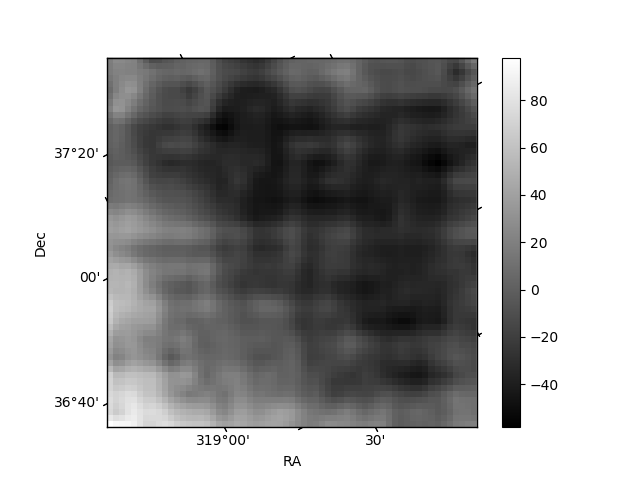
Quadrant B |
|---|---|---|---|
| Quadrant D | 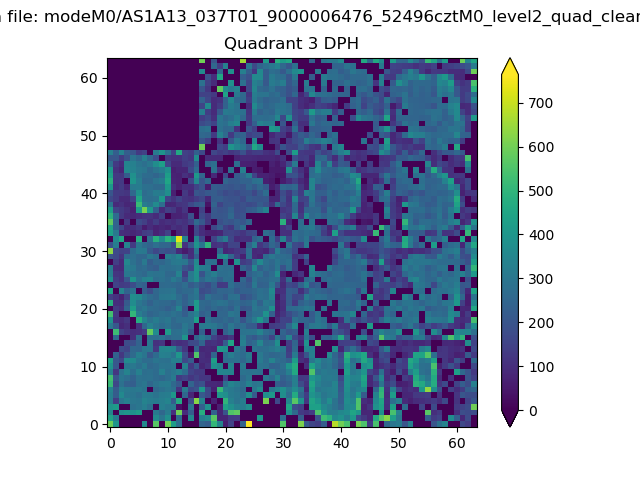 |
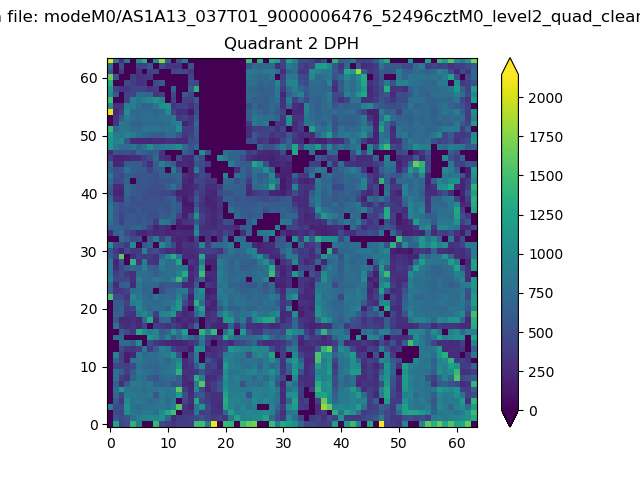 |
Quadrant C |
| Plot type | Count rate plots | Images |
|---|---|---|
| Comparison with Poisson distribution Blue bars denote a histogram of data divided into 1 sec bins. Red curve is a Poisson curve with rate = median count rate of data. |
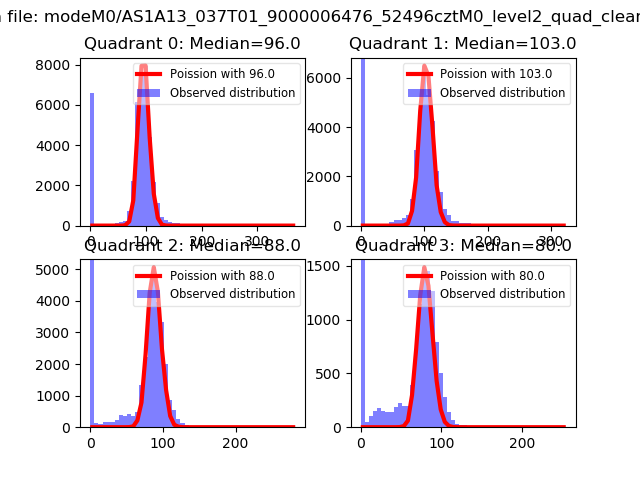 |
 |
| Quadrant-wise count rates Data is divided into 100 sec bins |
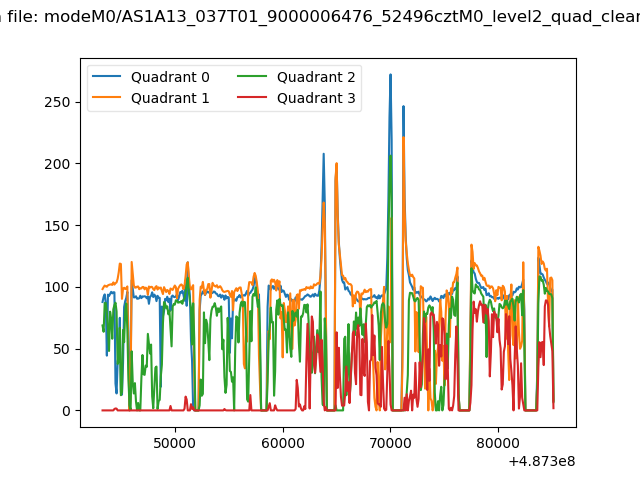 |
|
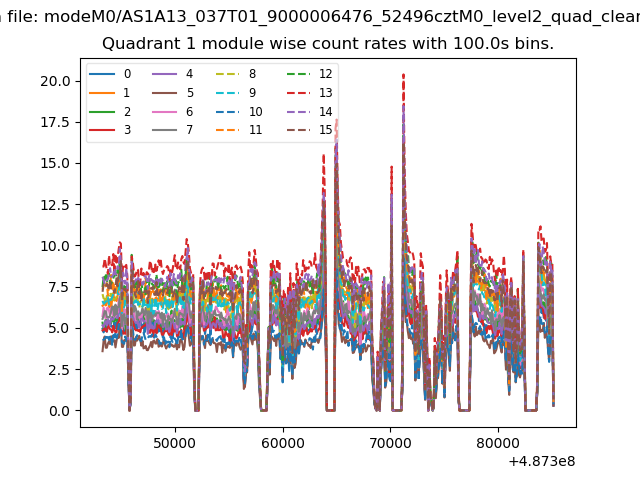
| Module-wise count rates for Quadrant A Data is divided into 100 sec bins |
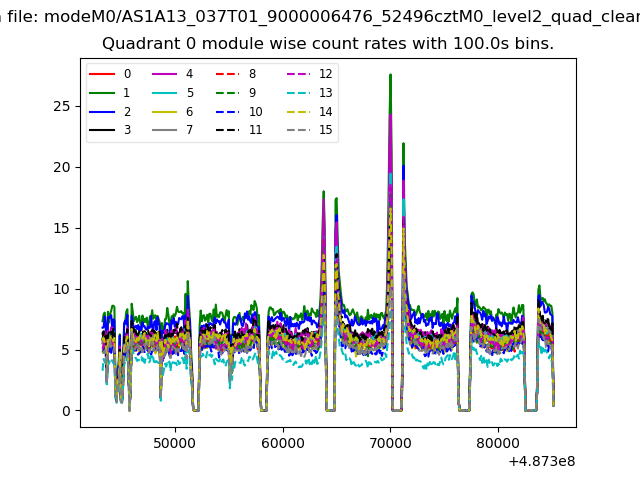 |
 |
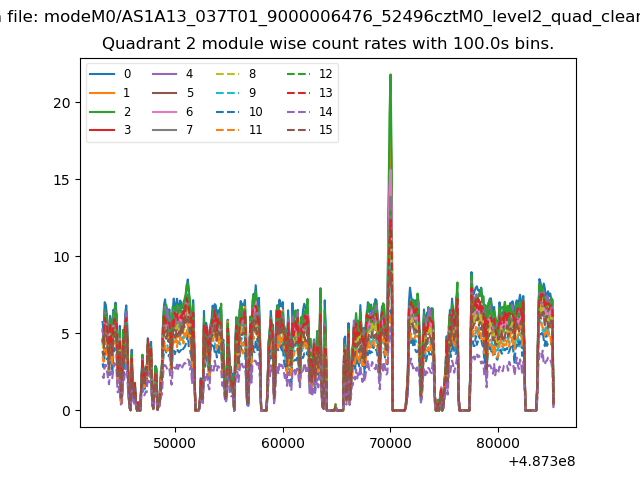
| Module-wise count rates for Quadrant B Data is divided into 100 sec bins |
 |
 |
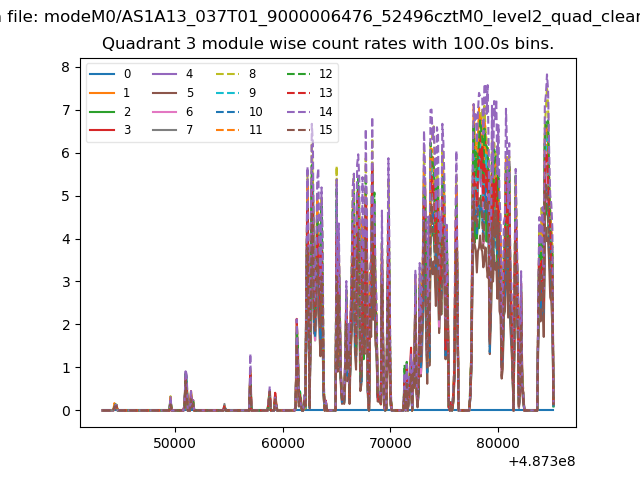
| Module-wise count rates for Quadrant C Data is divided into 100 sec bins |
 |
 |
| Module-wise count rates for Quadrant D Data is divided into 100 sec bins |
 |
 |
| Parameter | Plot |
|---|---|
| CZT HV Monitor | 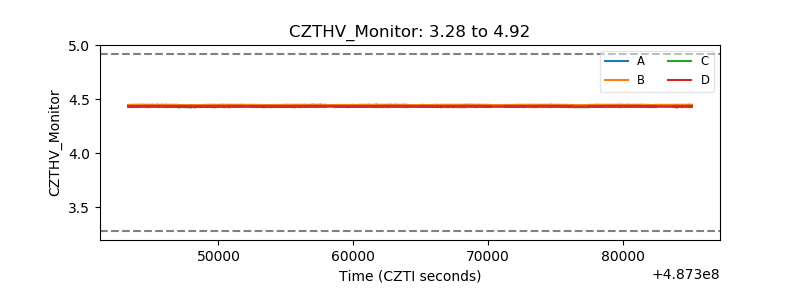 |
| D_VDD | 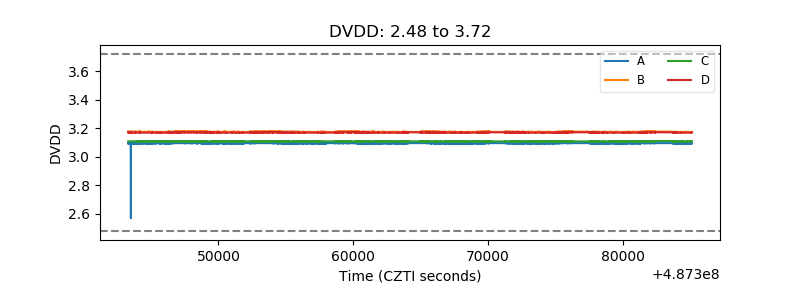 |
| Temperature 1 | 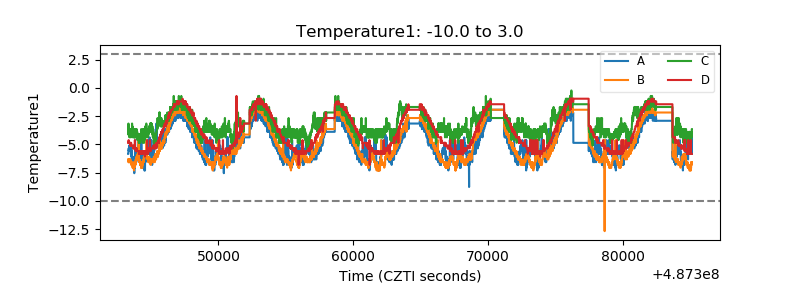 |
| Veto HV Monitor | 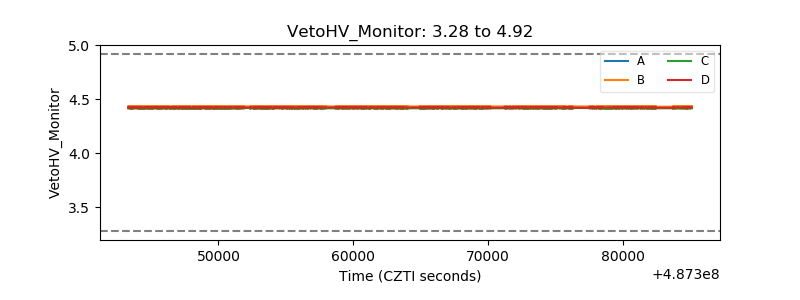 |
| Veto LLD | 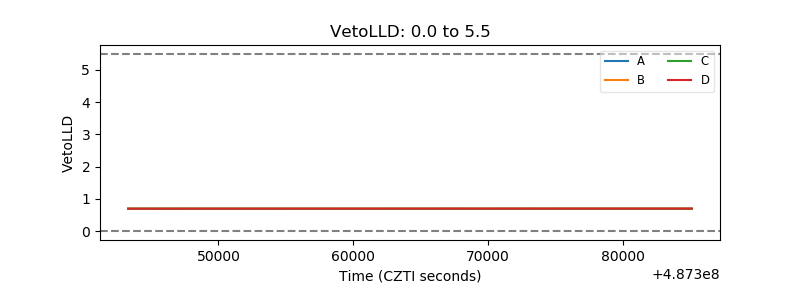 |
| Alpha Counter | 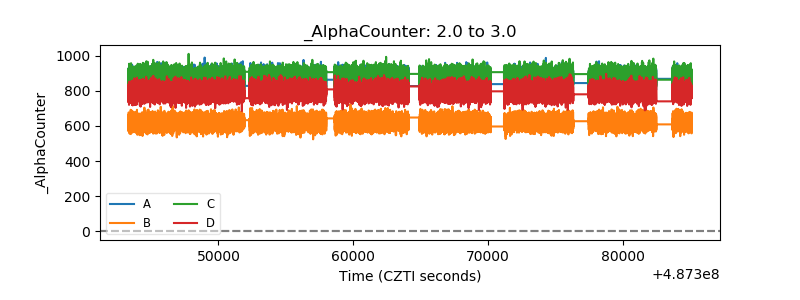 |
| _CPM_Rate | 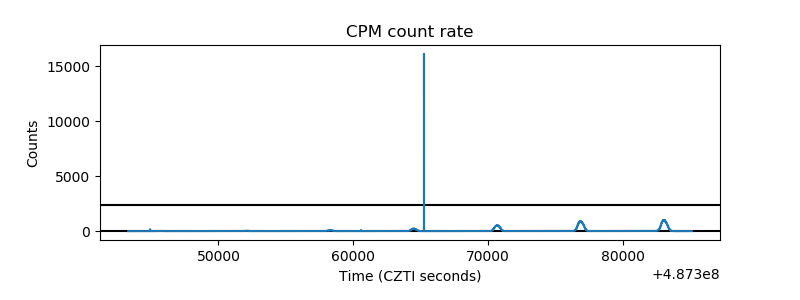 |
| CZT Counter | 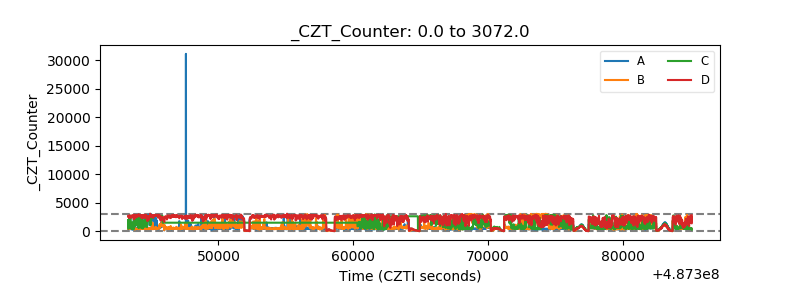 |
| +2.5 Volts monitor | 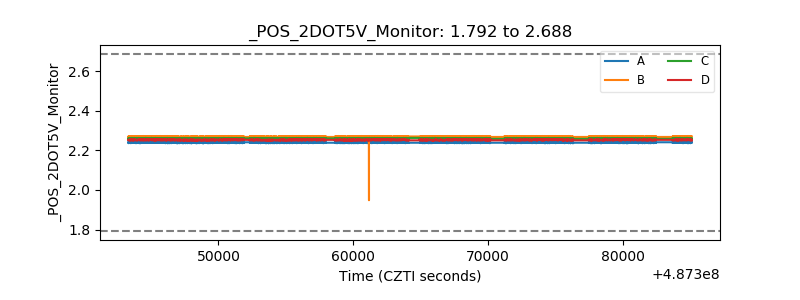 |
| +5 Volts monitor | 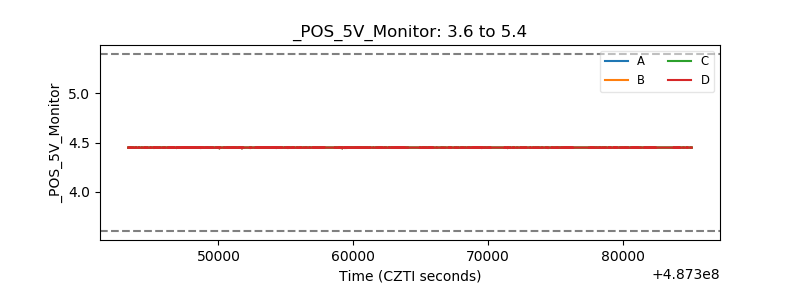 |
| _ROLL_ROT | 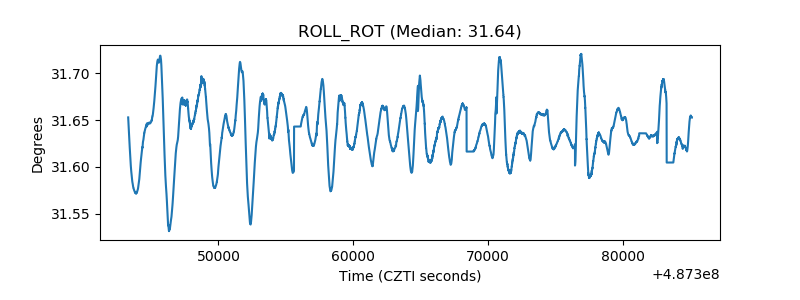 |
| _Roll_DEC | 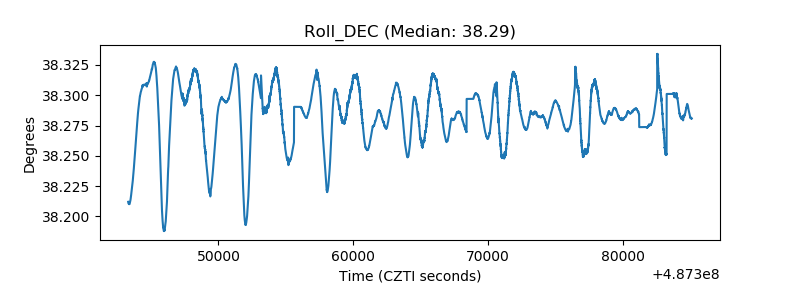 |
| _Roll_RA | 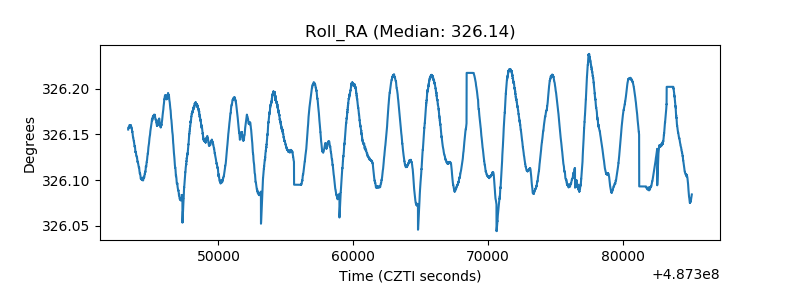 |
| Veto Counter | 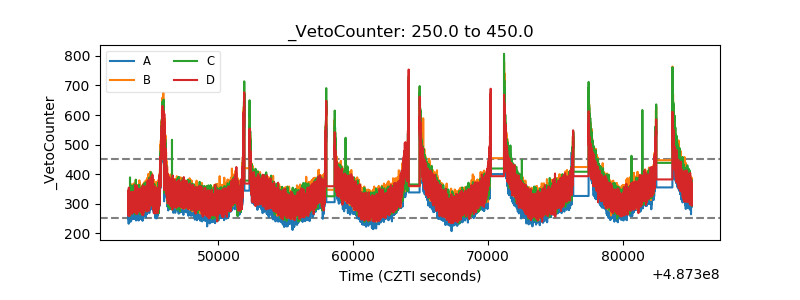 |