| Param | Original file | Final file |
|---|---|---|
| Filename | modeM0/AS1A13_037T01_9000006476_52497cztM0_level2.fits | modeM0/AS1A13_037T01_9000006476_52497cztM0_level2_quad_clean.evt |
| Size (bytes) | 365,497,920 | 50,293,440 |
| Size | 348.6 MB | 48.0 MB |
| Events in quadrant A | 1,600,704 | 358,816 |
| Events in quadrant B | 2,687,902 | 360,545 |
| Events in quadrant C | 2,936,537 | 326,261 |
| Events in quadrant D | 6,021,890 | 219,964 |
| Mode M9 | |||
|---|---|---|---|
| Quadrant | BADHDUFLAG | Total packets | Discarded packets |
| A | 1 | 140615796848680 | 140612934303790 |
| B | 1 | -1 | -1 |
| C | 1 | -1 | -1 |
| D | 1 | -1 | -1 |
| Mode M0 | |||
|---|---|---|---|
| Quadrant | BADHDUFLAG | Total packets | Discarded packets |
| A | 0 | 8577 | 1040 |
| B | 0 | 12382 | 1843 |
| C | 0 | 13361 | 2168 |
| D | 0 | 24585 | 4252 |
| Mode SS | |||
|---|---|---|---|
| Quadrant | BADHDUFLAG | Total packets | Discarded packets |
| A | 0 | 85 | 9 |
| B | 0 | 85 | 9 |
| C | 0 | 84 | 12 |
| D | 0 | 84 | 4 |
| Quadrant | Total seconds | Saturated seconds | Saturation percentage |
|---|---|---|---|
| A | 3718 | 4 | 0.107585% |
| B | 3637 | 272 | 7.478691% |
| C | 3616 | 128 | 3.539823% |
| D | 3512 | 1098 | 31.264237% |
Noise dominated data is calculated using 1-second bins in cleaned event files. If a bin has >2000 counts, and if more than 50% of those come from <1% of pixels, then it is considered to be noise-dominated and hence unusable.
| Quadrant | # 1 sec bins | Bins with >0 counts | Bins with >2000 counts | High rate bins dominated by noise | Noise dominated (total time) | Noise dominated (detector-on time) | Marked lightcurve |
|---|---|---|---|---|---|---|---|
| A | 7811 | 3904 | 5 | 5 | 0.06% | 0.13% | 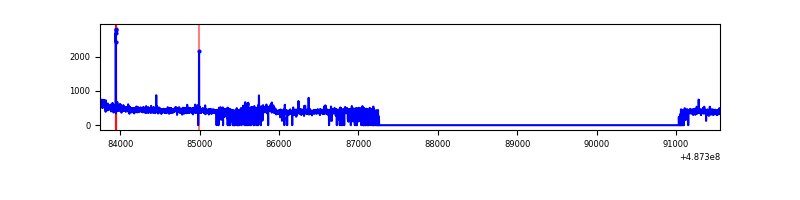 |
| B | 7811 | 3833 | 259 | 259 | 3.32% | 6.76% | 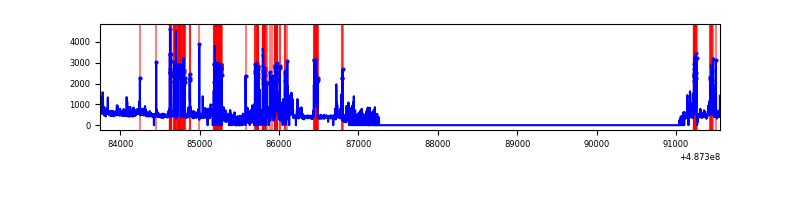 |
| C | 7811 | 3819 | 153 | 153 | 1.96% | 4.01% | 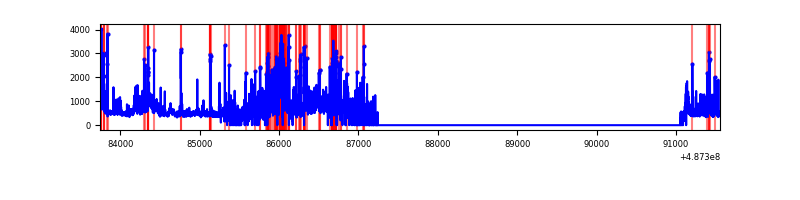 |
| D | 7811 | 3725 | 1205 | 1205 | 15.43% | 32.35% | 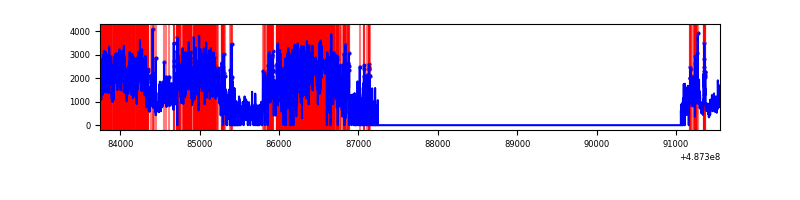 |
Top three noisy pixels from each quadrant. If the there are fewer than three noisy pixels in the level2.evt file, extra rows are filled as -1
| Pixel properties | Quadrant properties | ||||||
|---|---|---|---|---|---|---|---|
| Quadrant | DetID | PixID | Counts | Sigma | Mean | Median | Sigma |
| A | 3 | 14 | 74967 | 780.46 | 377 | 367 | 95.6 |
| A | 4 | 3 | 16743 | 171.33 | 377 | 367 | 95.6 |
| A | 11 | 3 | 14002 | 142.65 | 377 | 367 | 95.6 |
| B | 10 | 44 | 1083104 | 13723.07 | 359 | 347 | 78.9 |
| B | 10 | 254 | 54740 | 689.39 | 359 | 347 | 78.9 |
| B | 0 | 213 | 39599 | 497.49 | 359 | 347 | 78.9 |
| C | 15 | 224 | 630684 | 6294.25 | 355 | 351 | 100.1 |
| C | 15 | 248 | 433780 | 4328.05 | 355 | 351 | 100.1 |
| C | 13 | 3 | 230728 | 2300.45 | 355 | 351 | 100.1 |
| D | 15 | 93 | 2401615 | 27423.01 | 305 | 292 | 87.6 |
| D | 6 | 42 | 2093644 | 23905.99 | 305 | 292 | 87.6 |
| D | 8 | 176 | 110834 | 1262.38 | 305 | 292 | 87.6 |
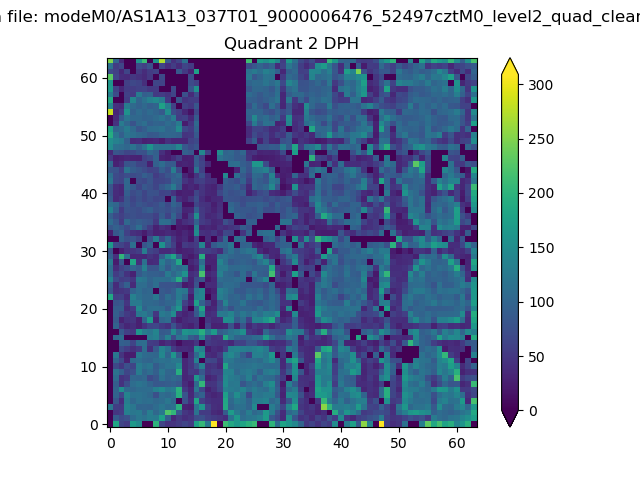
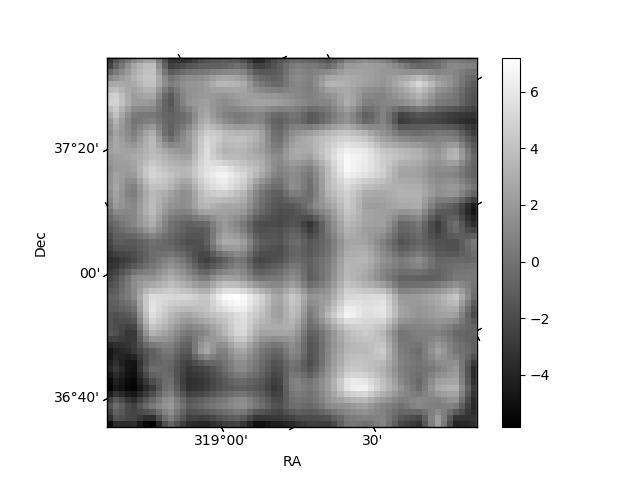
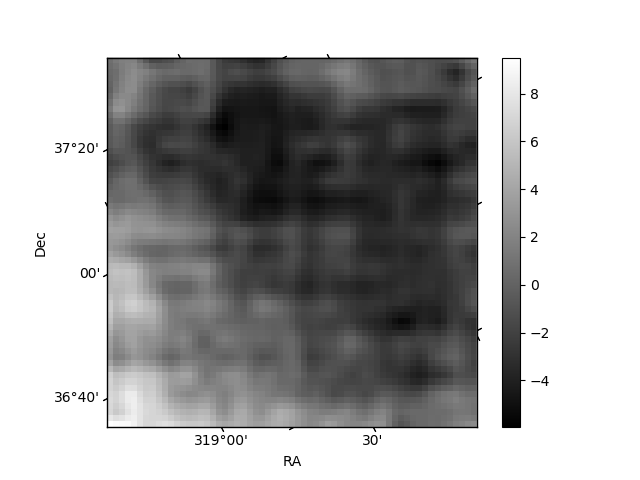
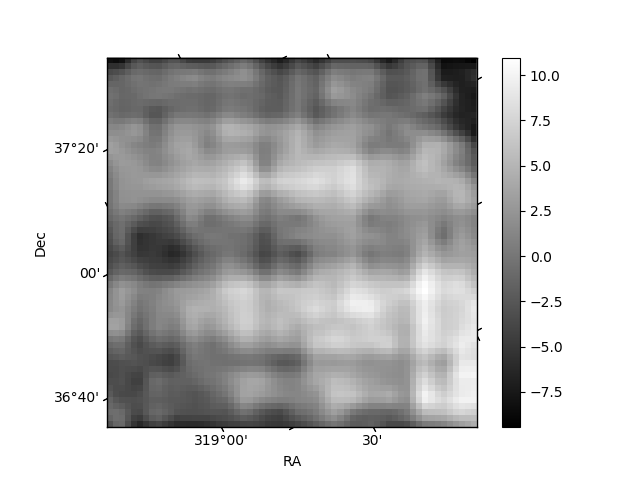
Histogram calculated using DETX and DETY for each event in the final _common_clean file
| Quadrant A | 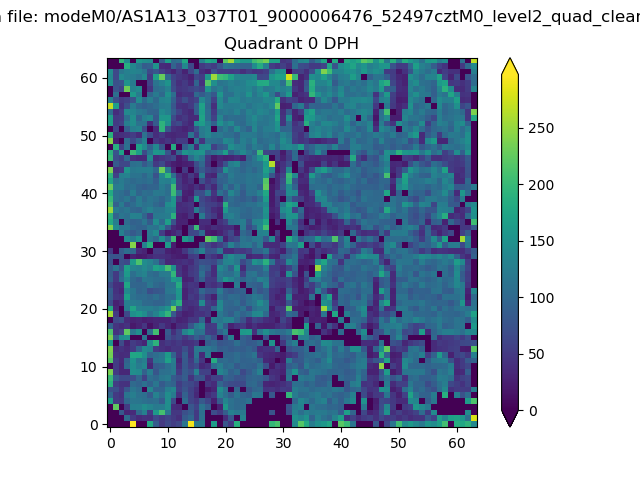 |
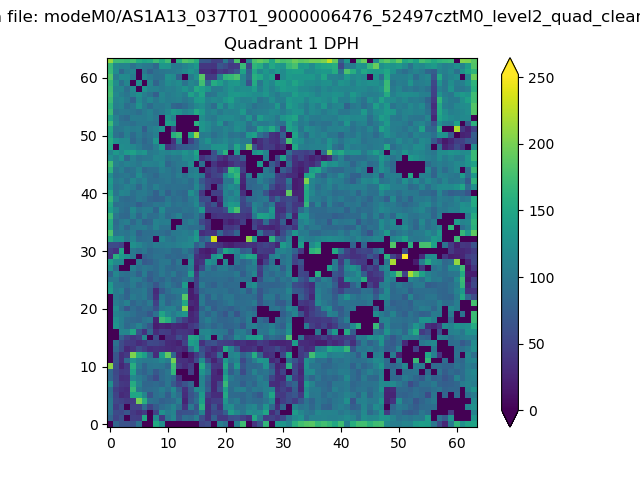 |
Quadrant B |
|---|---|---|---|
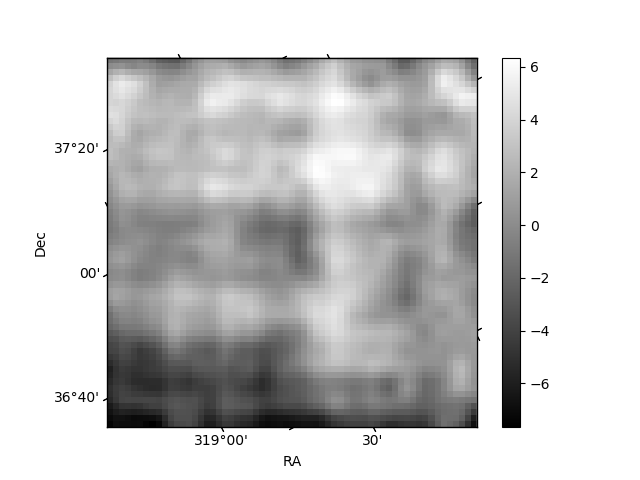
| Quadrant D | 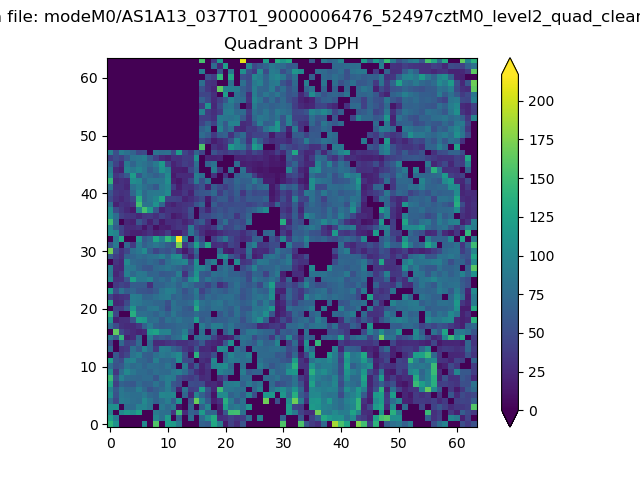 |
 |
Quadrant C |
| Plot type | Count rate plots | Images |
|---|---|---|
| Comparison with Poisson distribution Blue bars denote a histogram of data divided into 1 sec bins. Red curve is a Poisson curve with rate = median count rate of data. |
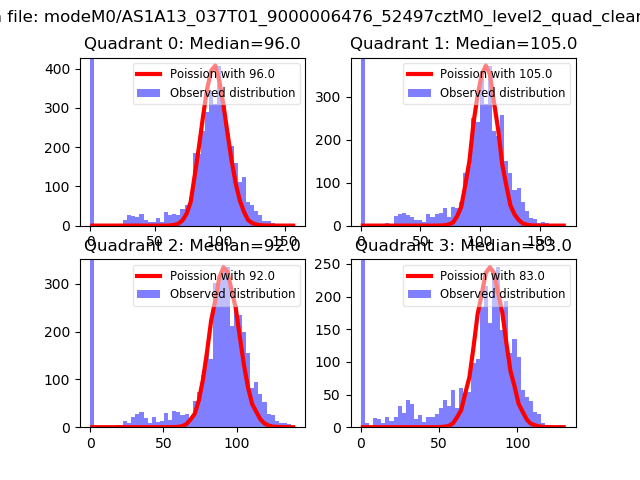 |
 |
| Quadrant-wise count rates Data is divided into 100 sec bins |
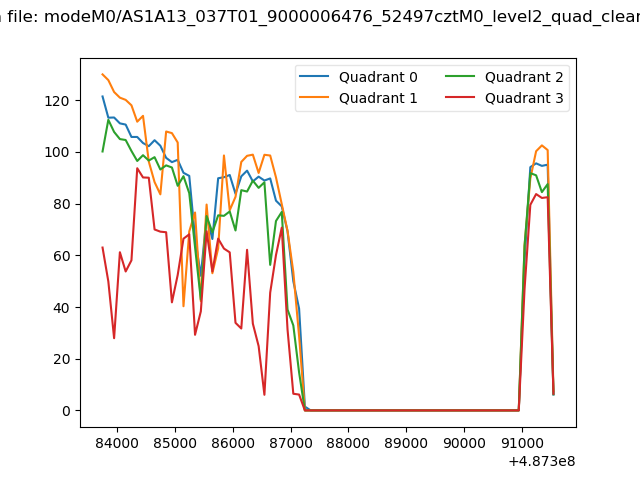 |
|
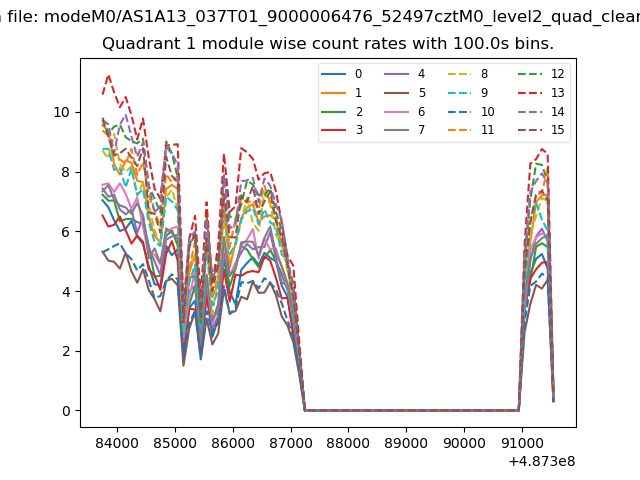
| Module-wise count rates for Quadrant A Data is divided into 100 sec bins |
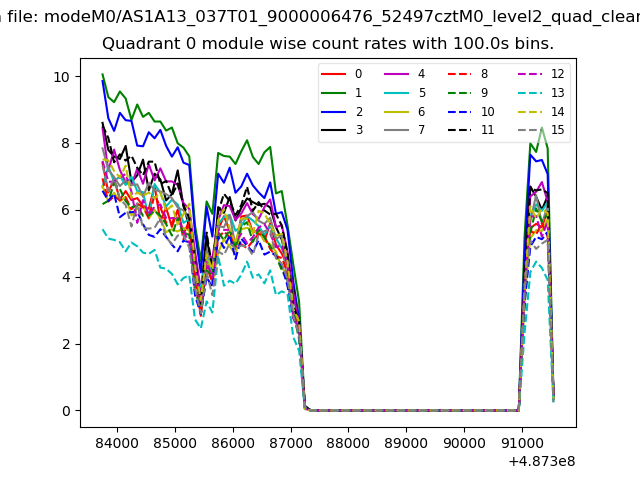 |
 |
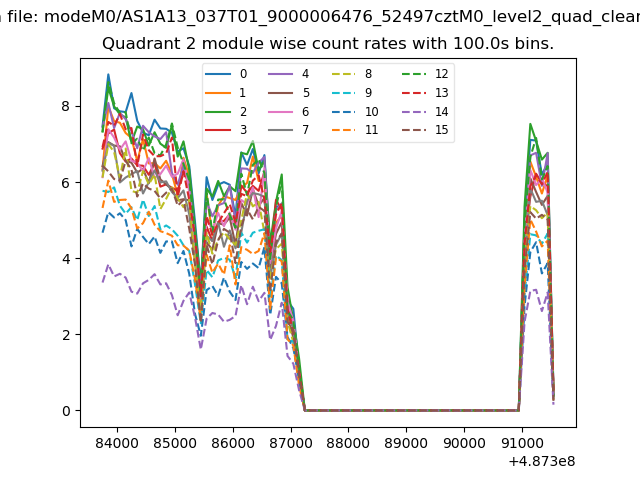
| Module-wise count rates for Quadrant B Data is divided into 100 sec bins |
 |
 |
| Module-wise count rates for Quadrant C Data is divided into 100 sec bins |
 |
 |
| Module-wise count rates for Quadrant D Data is divided into 100 sec bins |
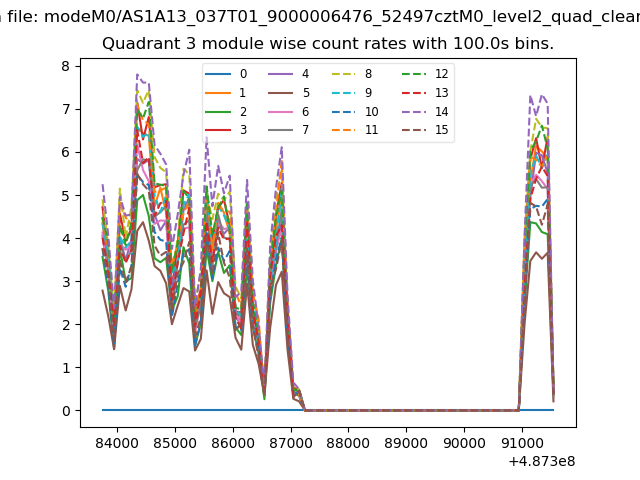 |
 |
| Parameter | Plot |
|---|---|
| CZT HV Monitor | 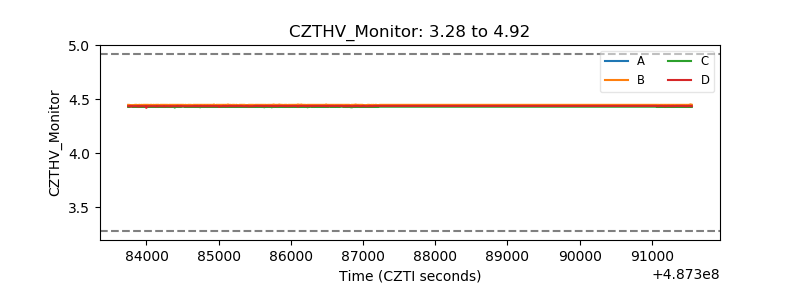 |
| D_VDD | 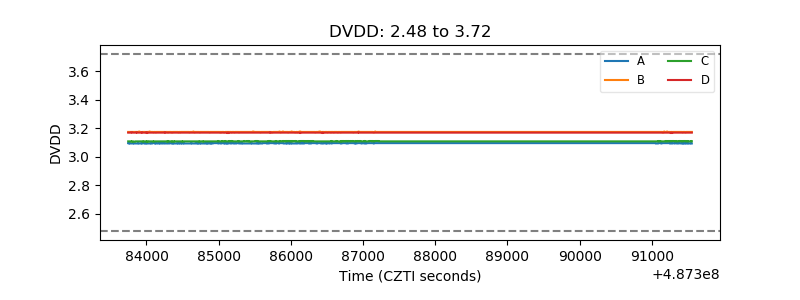 |
| Temperature 1 | 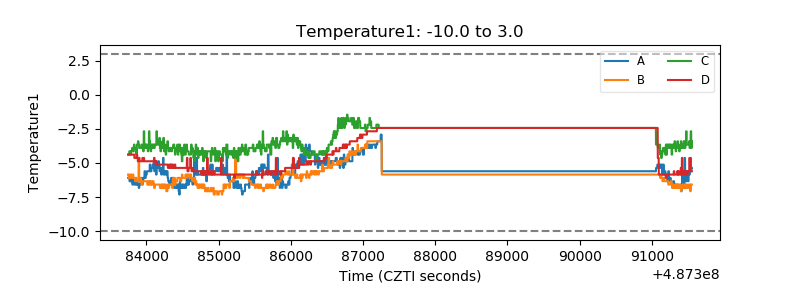 |
| Veto HV Monitor |  |
| Veto LLD | 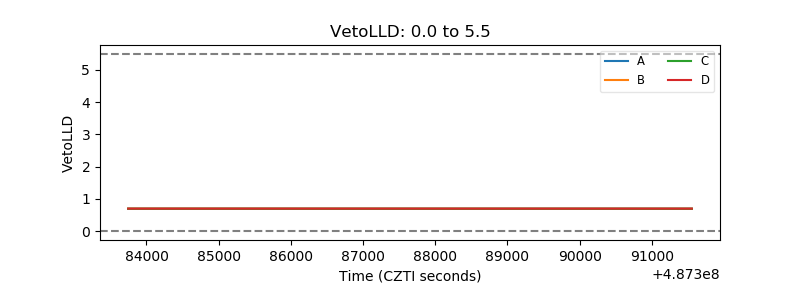 |
| Alpha Counter | 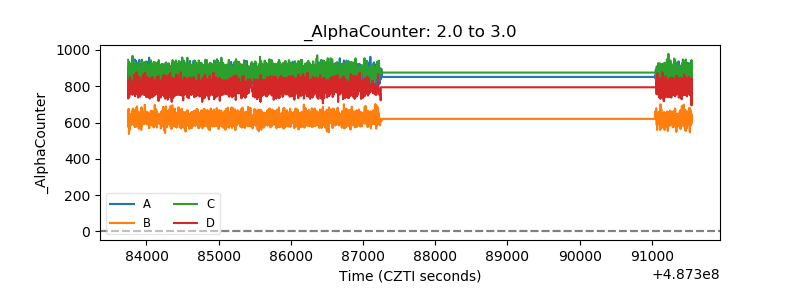 |
| _CPM_Rate | 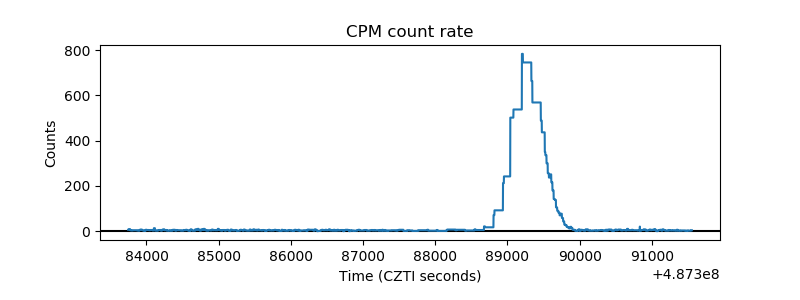 |
| CZT Counter |  |
| +2.5 Volts monitor |  |
| +5 Volts monitor | 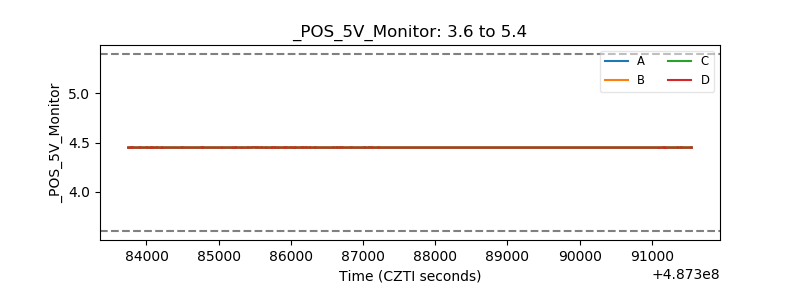 |
| _ROLL_ROT | 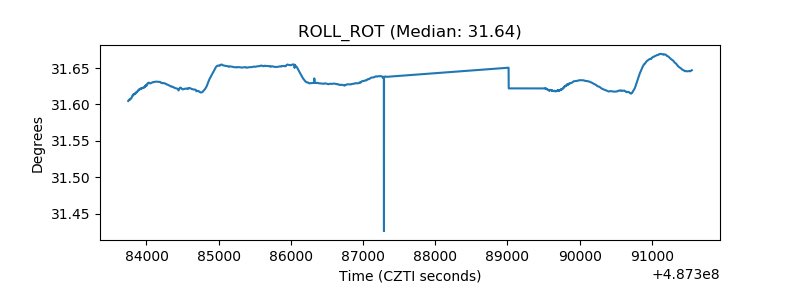 |
| _Roll_DEC | 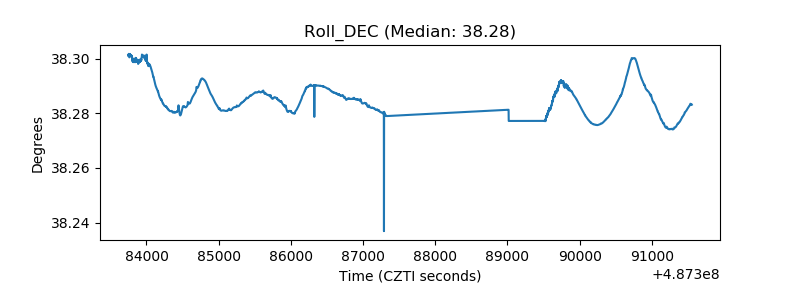 |
| _Roll_RA |  |
| Veto Counter | 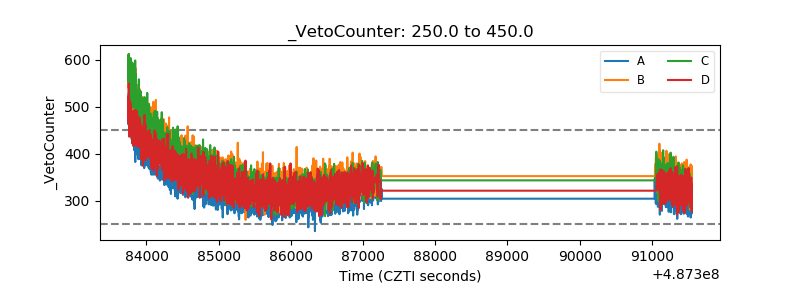 |