| Param | Original file | Final file |
|---|---|---|
| Filename | modeM0/AS1A13_037T01_9000006476_52498cztM0_level2.fits | modeM0/AS1A13_037T01_9000006476_52498cztM0_level2_quad_clean.evt |
| Size (bytes) | 392,270,400 | 53,778,240 |
| Size | 374.1 MB | 51.3 MB |
| Events in quadrant A | 1,843,137 | 387,699 |
| Events in quadrant B | 2,347,984 | 416,515 |
| Events in quadrant C | 5,465,457 | 235,117 |
| Events in quadrant D | 4,555,537 | 308,885 |
| Mode M9 | |||
|---|---|---|---|
| Quadrant | BADHDUFLAG | Total packets | Discarded packets |
| A | 0 | 14 | 0 |
| B | 0 | 17 | 3 |
| C | 0 | 16 | 1 |
| D | 0 | 15 | 0 |
| Mode M0 | |||
|---|---|---|---|
| Quadrant | BADHDUFLAG | Total packets | Discarded packets |
| A | 0 | 11093 | 2527 |
| B | 0 | 12858 | 3103 |
| C | 0 | 23032 | 4106 |
| D | 0 | 23035 | 6765 |
| Mode SS | |||
|---|---|---|---|
| Quadrant | BADHDUFLAG | Total packets | Discarded packets |
| A | 0 | 108 | 28 |
| B | 0 | 109 | 23 |
| C | 0 | 109 | 21 |
| D | 0 | 114 | 30 |
| Quadrant | Total seconds | Saturated seconds | Saturation percentage |
|---|---|---|---|
| A | 4023 | 49 | 1.217997% |
| B | 4009 | 95 | 2.369668% |
| C | 3893 | 1416 | 36.372977% |
| D | 3891 | 410 | 10.537137% |
Noise dominated data is calculated using 1-second bins in cleaned event files. If a bin has >2000 counts, and if more than 50% of those come from <1% of pixels, then it is considered to be noise-dominated and hence unusable.
| Quadrant | # 1 sec bins | Bins with >0 counts | Bins with >2000 counts | High rate bins dominated by noise | Noise dominated (total time) | Noise dominated (detector-on time) | Marked lightcurve |
|---|---|---|---|---|---|---|---|
| A | 7865 | 4177 | 23 | 23 | 0.29% | 0.55% | 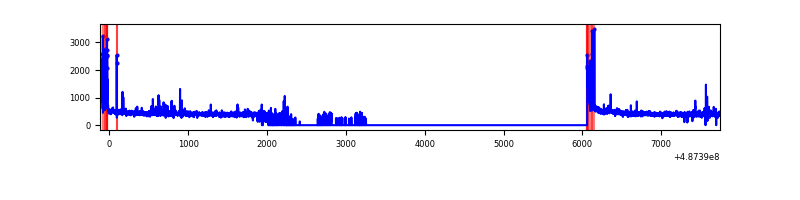 |
| B | 7865 | 4174 | 68 | 68 | 0.86% | 1.63% | 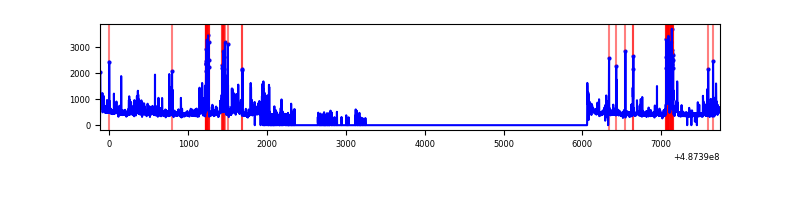 |
| C | 7864 | 4026 | 1285 | 1285 | 16.34% | 31.92% | 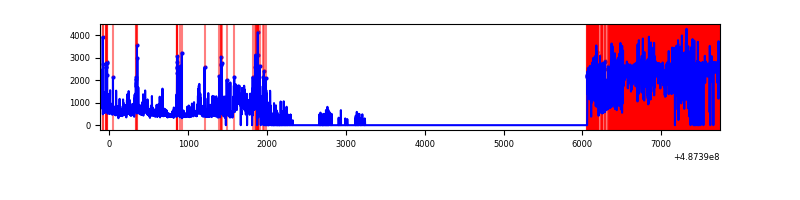 |
| D | 7865 | 3983 | 501 | 501 | 6.37% | 12.58% | 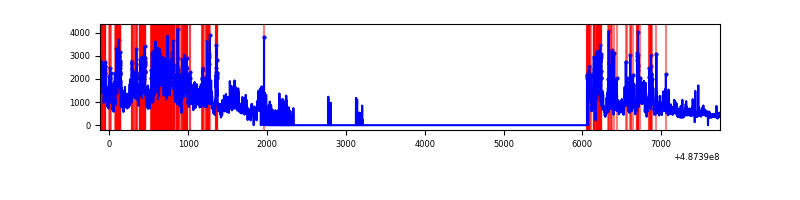 |
Top three noisy pixels from each quadrant. If the there are fewer than three noisy pixels in the level2.evt file, extra rows are filled as -1
| Pixel properties | Quadrant properties | ||||||
|---|---|---|---|---|---|---|---|
| Quadrant | DetID | PixID | Counts | Sigma | Mean | Median | Sigma |
| A | 11 | 3 | 32629 | 308.69 | 413 | 404 | 104.4 |
| A | 3 | 45 | 30905 | 292.17 | 413 | 404 | 104.4 |
| A | 13 | 248 | 26794 | 252.79 | 413 | 404 | 104.4 |
| B | 10 | 44 | 373231 | 4132.11 | 416 | 401 | 90.2 |
| B | 10 | 254 | 107503 | 1187.02 | 416 | 401 | 90.2 |
| B | 0 | 213 | 71931 | 792.77 | 416 | 401 | 90.2 |
| C | 15 | 224 | 3374423 | 40232.01 | 300 | 297 | 83.9 |
| C | 2 | 12 | 441504 | 5260.81 | 300 | 297 | 83.9 |
| C | 13 | 3 | 181559 | 2161.31 | 300 | 297 | 83.9 |
| D | 15 | 93 | 2516233 | 23584.43 | 369 | 353 | 106.7 |
| D | 12 | 17 | 159311 | 1490.11 | 369 | 353 | 106.7 |
| D | 6 | 42 | 111017 | 1037.39 | 369 | 353 | 106.7 |
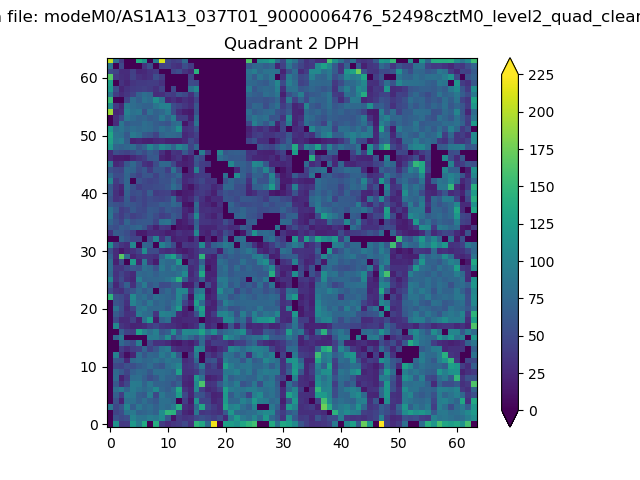
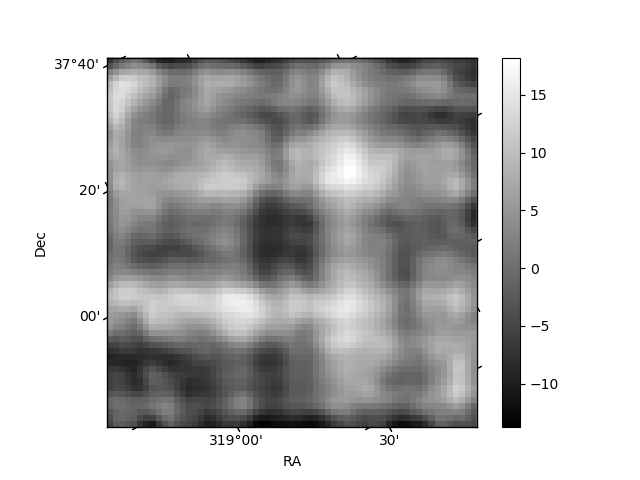
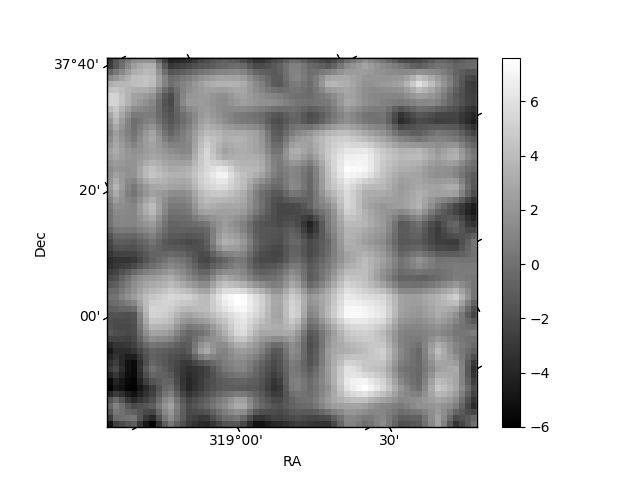
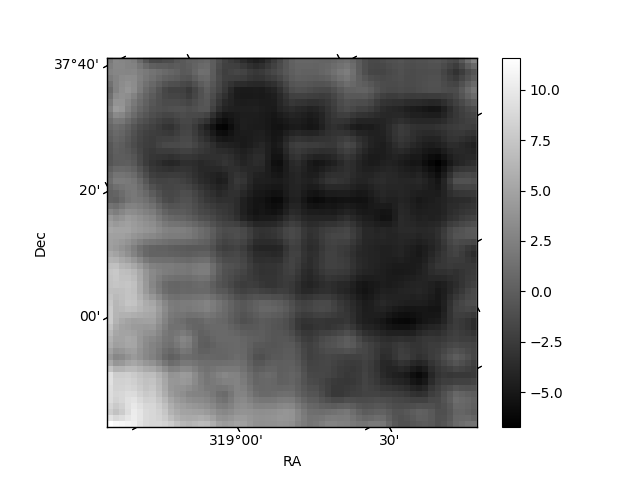
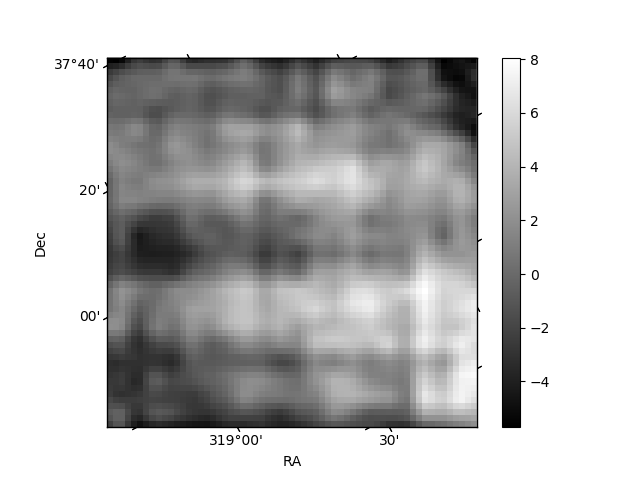
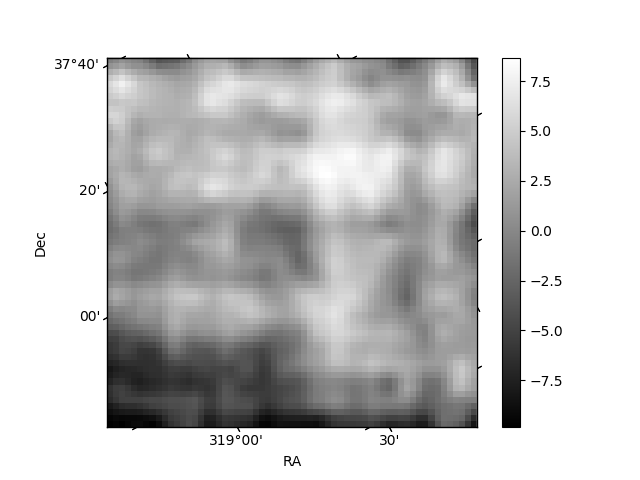
Histogram calculated using DETX and DETY for each event in the final _common_clean file
| Quadrant A | 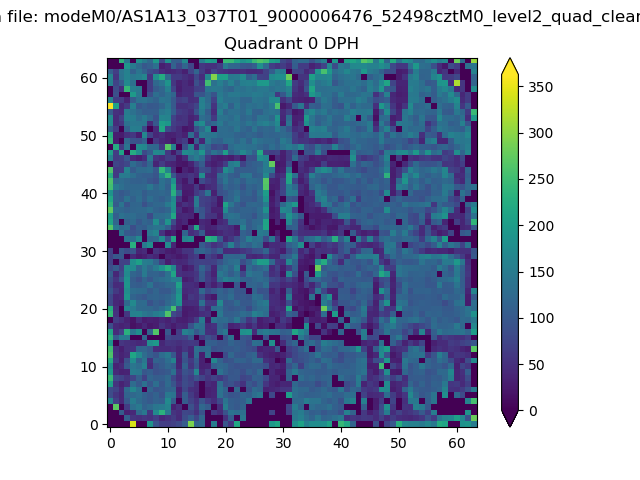 |
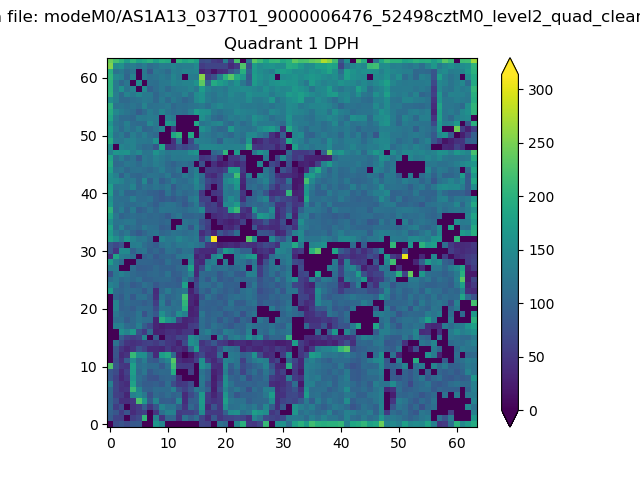 |
Quadrant B |
|---|---|---|---|
| Quadrant D | 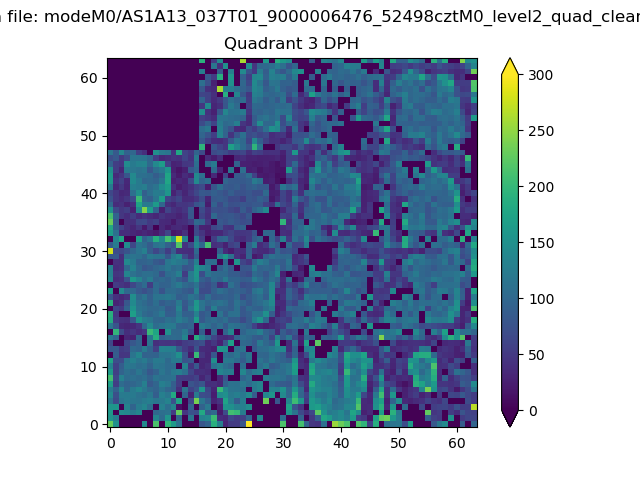 |
 |
Quadrant C |
| Plot type | Count rate plots | Images |
|---|---|---|
| Comparison with Poisson distribution Blue bars denote a histogram of data divided into 1 sec bins. Red curve is a Poisson curve with rate = median count rate of data. |
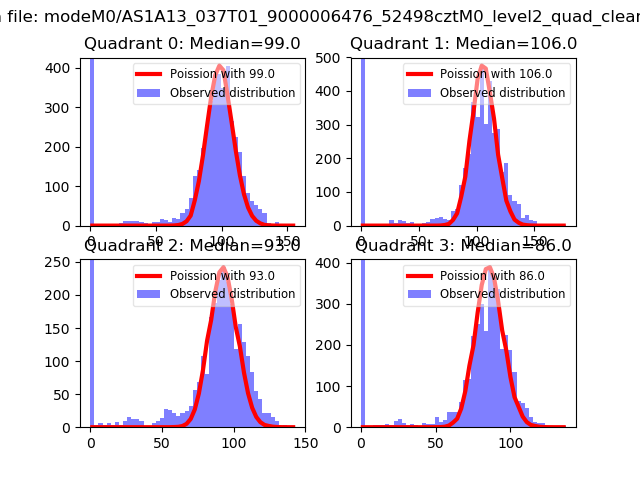 |
 |
| Quadrant-wise count rates Data is divided into 100 sec bins |
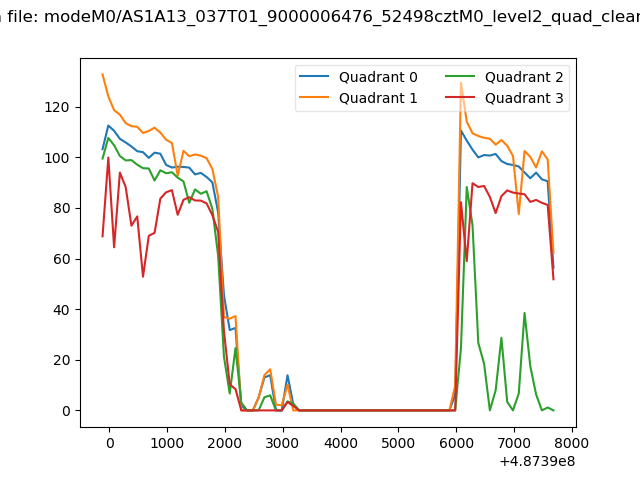 |
|
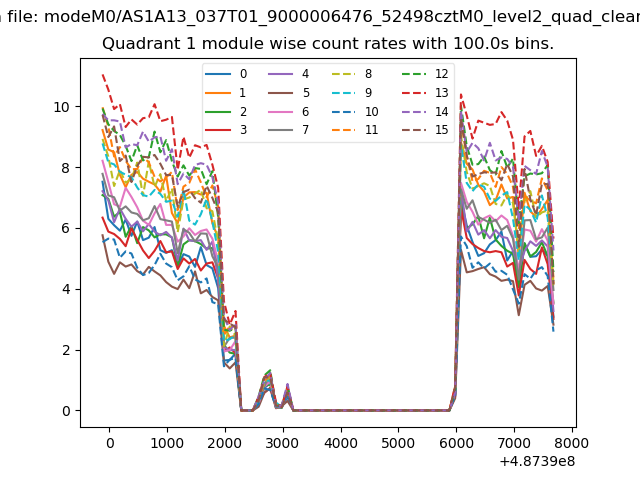
| Module-wise count rates for Quadrant A Data is divided into 100 sec bins |
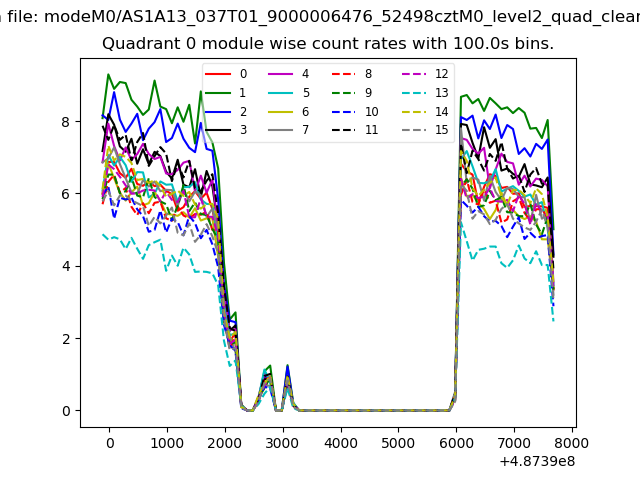 |
 |
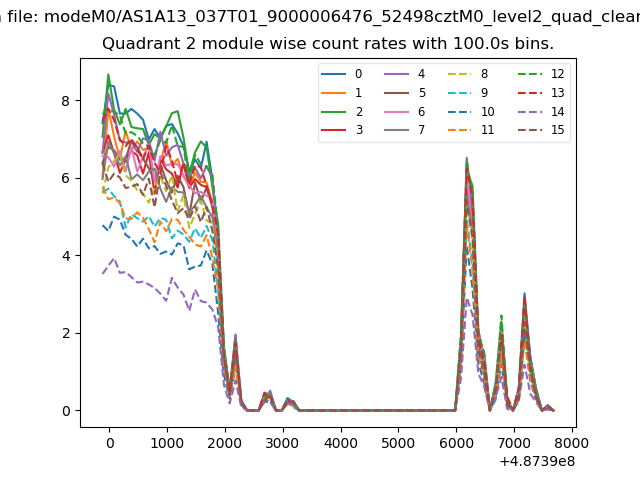
| Module-wise count rates for Quadrant B Data is divided into 100 sec bins |
 |
 |
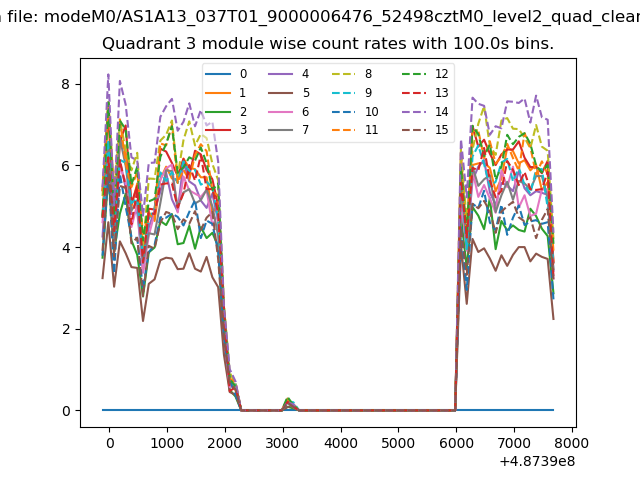
| Module-wise count rates for Quadrant C Data is divided into 100 sec bins |
 |
 |
| Module-wise count rates for Quadrant D Data is divided into 100 sec bins |
 |
 |
| Parameter | Plot |
|---|---|
| CZT HV Monitor | 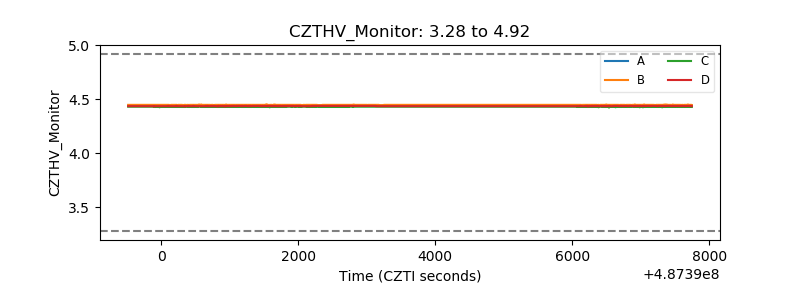 |
| D_VDD | 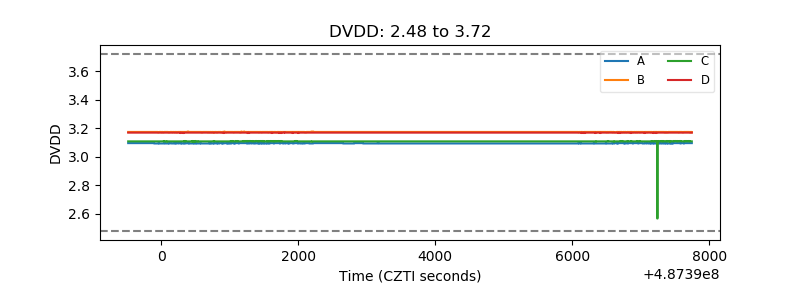 |
| Temperature 1 | 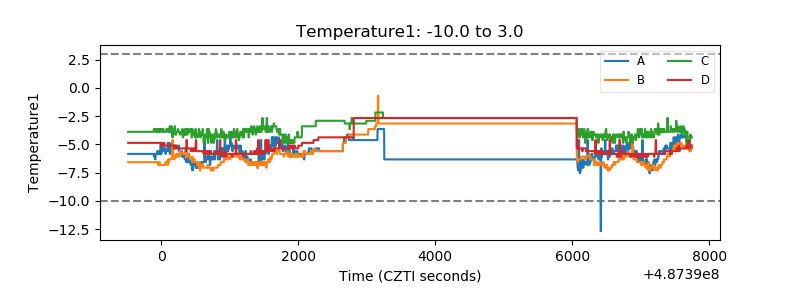 |
| Veto HV Monitor | 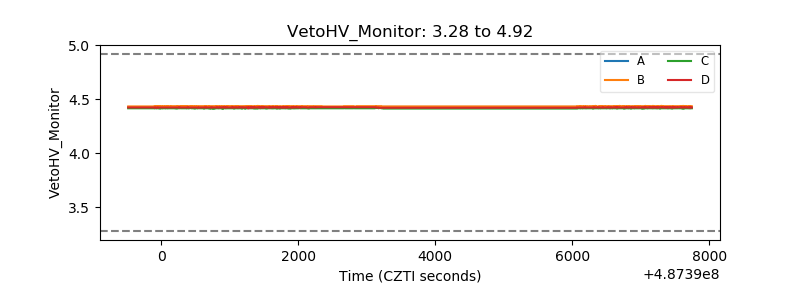 |
| Veto LLD | 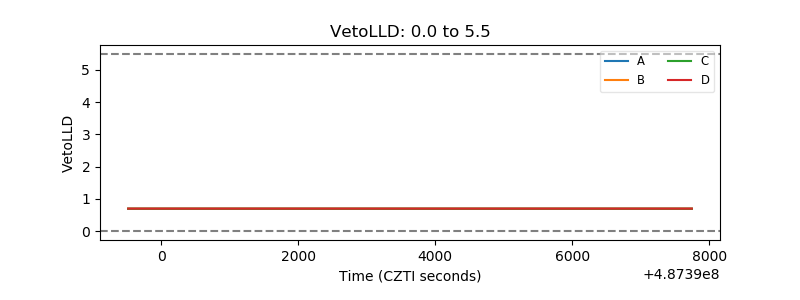 |
| Alpha Counter | 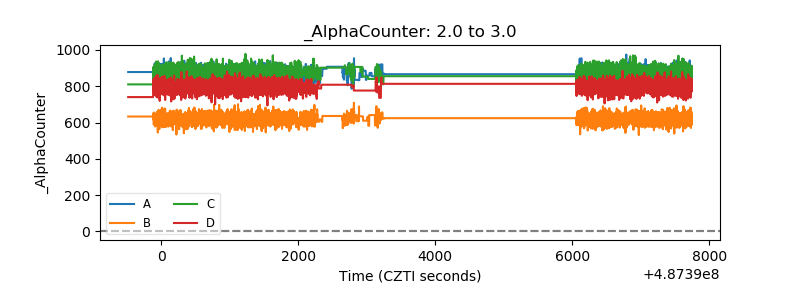 |
| _CPM_Rate | 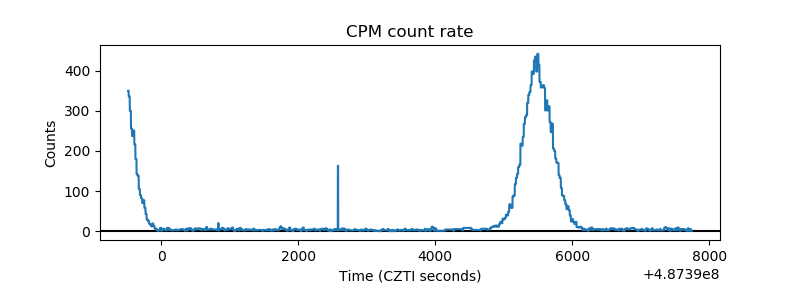 |
| CZT Counter | 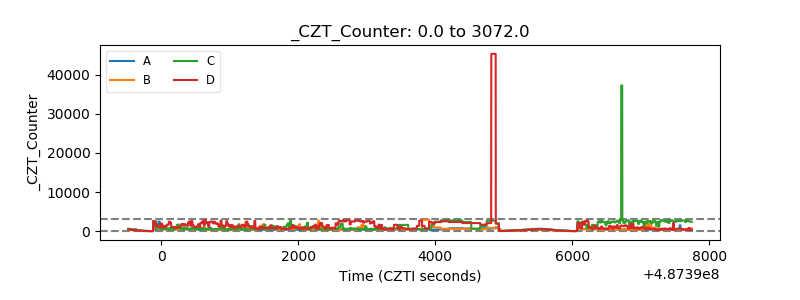 |
| +2.5 Volts monitor | 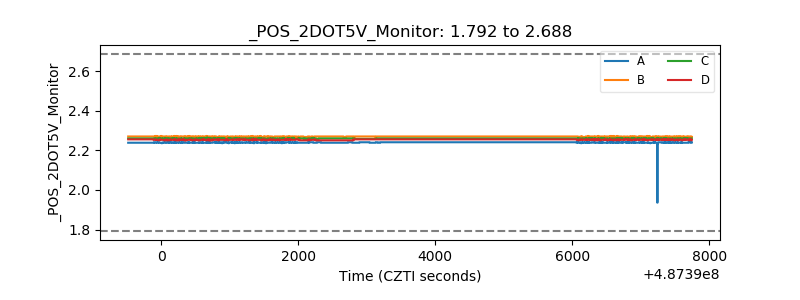 |
| +5 Volts monitor | 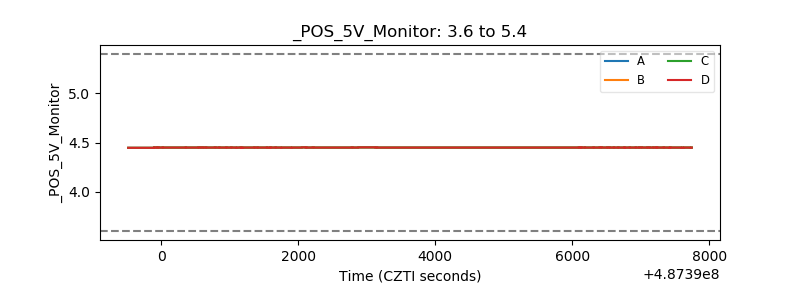 |
| _ROLL_ROT | 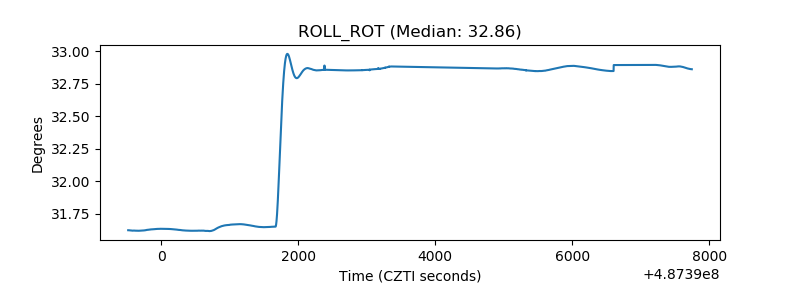 |
| _Roll_DEC | 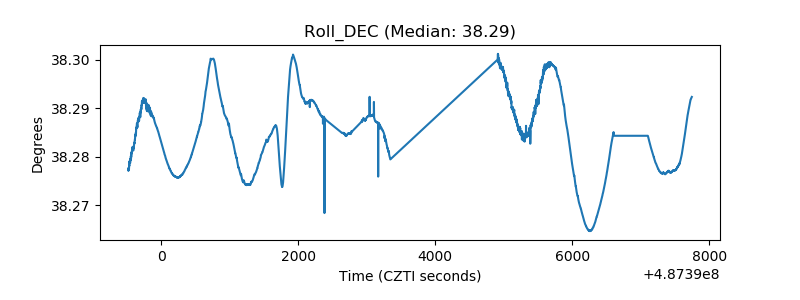 |
| _Roll_RA | 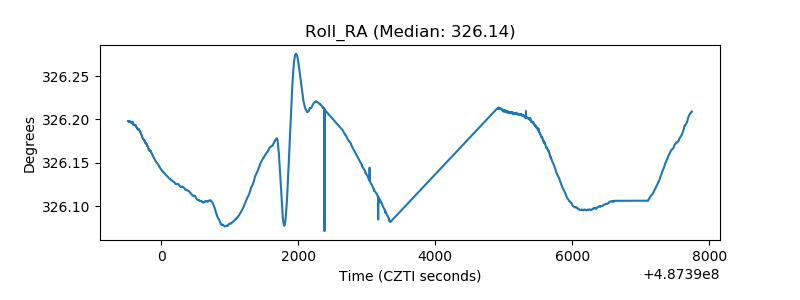 |
| Veto Counter | 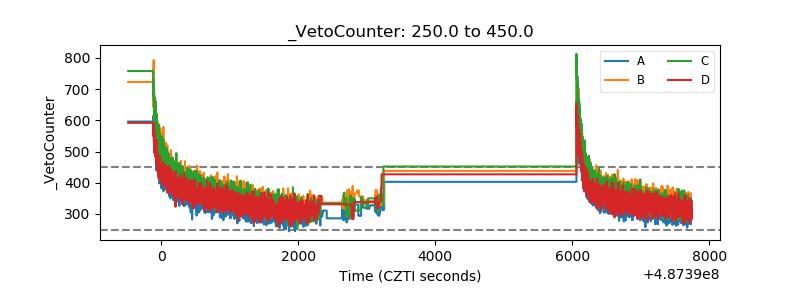 |