| Param | Original file | Final file |
|---|---|---|
| Filename | modeM0/AS1A13_037T01_9000006476_52509cztM0_level2.fits | modeM0/AS1A13_037T01_9000006476_52509cztM0_level2_quad_clean.evt |
| Size (bytes) | 810,671,040 | 87,137,280 |
| Size | 773.1 MB | 83.1 MB |
| Events in quadrant A | 3,331,241 | 693,487 |
| Events in quadrant B | 5,160,248 | 681,041 |
| Events in quadrant C | 11,260,148 | 356,187 |
| Events in quadrant D | 9,755,109 | 455,461 |
| Mode M9 | |||
|---|---|---|---|
| Quadrant | BADHDUFLAG | Total packets | Discarded packets |
| A | 0 | 11 | 0 |
| B | 0 | 11 | 0 |
| C | 0 | 11 | 0 |
| D | 0 | 11 | 0 |
| Mode M0 | |||
|---|---|---|---|
| Quadrant | BADHDUFLAG | Total packets | Discarded packets |
| A | 0 | 14662 | 1 |
| B | 0 | 19904 | 1 |
| C | 0 | 37988 | 7 |
| D | 0 | 33493 | 1 |
| Mode SS | |||
|---|---|---|---|
| Quadrant | BADHDUFLAG | Total packets | Discarded packets |
| A | 0 | 130 | 0 |
| B | 0 | 130 | 0 |
| C | 0 | 130 | 0 |
| D | 0 | 130 | 0 |
| Quadrant | Total seconds | Saturated seconds | Saturation percentage |
|---|---|---|---|
| A | 6486 | 139 | 2.143077% |
| B | 6487 | 422 | 6.505318% |
| C | 6486 | 3140 | 48.411964% |
| D | 6486 | 2036 | 31.390688% |
Noise dominated data is calculated using 1-second bins in cleaned event files. If a bin has >2000 counts, and if more than 50% of those come from <1% of pixels, then it is considered to be noise-dominated and hence unusable.
| Quadrant | # 1 sec bins | Bins with >0 counts | Bins with >2000 counts | High rate bins dominated by noise | Noise dominated (total time) | Noise dominated (detector-on time) | Marked lightcurve |
|---|---|---|---|---|---|---|---|
| A | 7521 | 6486 | 57 | 57 | 0.76% | 0.88% | 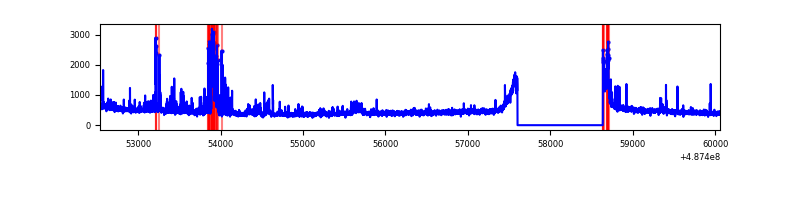 |
| B | 7522 | 6487 | 256 | 256 | 3.40% | 3.95% | 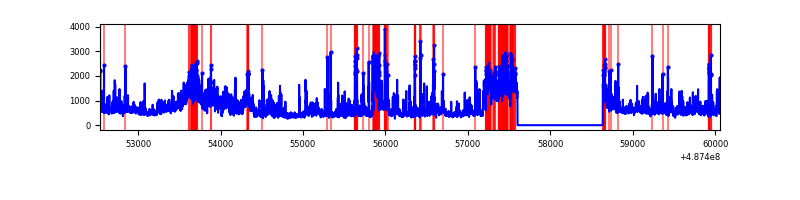 |
| C | 7521 | 6486 | 2956 | 2956 | 39.30% | 45.58% | 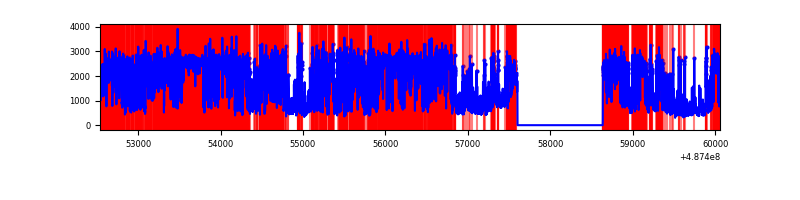 |
| D | 7521 | 6486 | 2085 | 2085 | 27.72% | 32.15% | 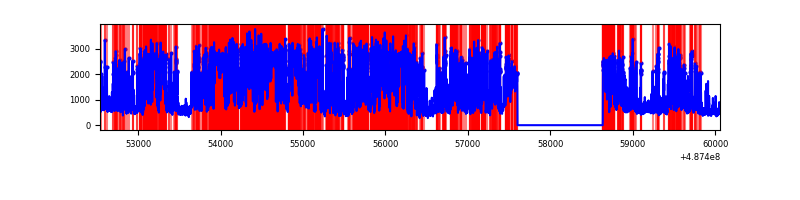 |
Top three noisy pixels from each quadrant. If the there are fewer than three noisy pixels in the level2.evt file, extra rows are filled as -1
| Pixel properties | Quadrant properties | ||||||
|---|---|---|---|---|---|---|---|
| Quadrant | DetID | PixID | Counts | Sigma | Mean | Median | Sigma |
| A | 12 | 18 | 251177 | 1353.82 | 730 | 712 | 185.0 |
| A | 13 | 248 | 58169 | 310.57 | 730 | 712 | 185.0 |
| A | 12 | 194 | 36940 | 195.82 | 730 | 712 | 185.0 |
| B | 10 | 254 | 1003822 | 6629.29 | 698 | 674 | 151.3 |
| B | 10 | 44 | 496973 | 3279.78 | 698 | 674 | 151.3 |
| B | 7 | 0 | 255066 | 1681.15 | 698 | 674 | 151.3 |
| C | 15 | 224 | 7469560 | 49824.45 | 527 | 521 | 149.9 |
| C | 4 | 5 | 436564 | 2908.75 | 527 | 521 | 149.9 |
| C | 9 | 38 | 430992 | 2871.59 | 527 | 521 | 149.9 |
| D | 15 | 93 | 5428280 | 29723.42 | 620 | 590 | 182.6 |
| D | 8 | 176 | 464457 | 2540.25 | 620 | 590 | 182.6 |
| D | 6 | 42 | 427808 | 2339.56 | 620 | 590 | 182.6 |
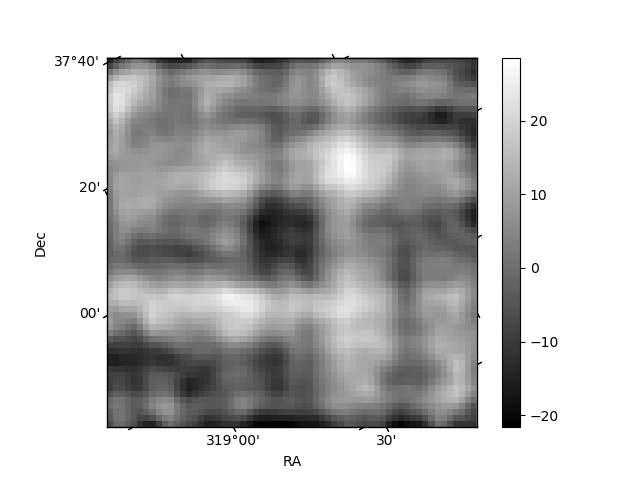
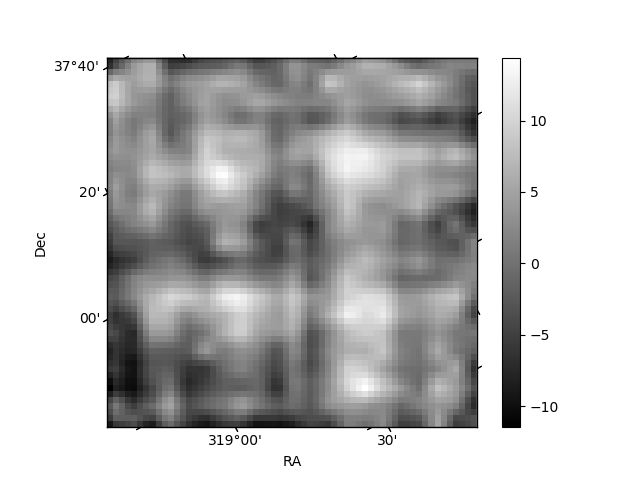
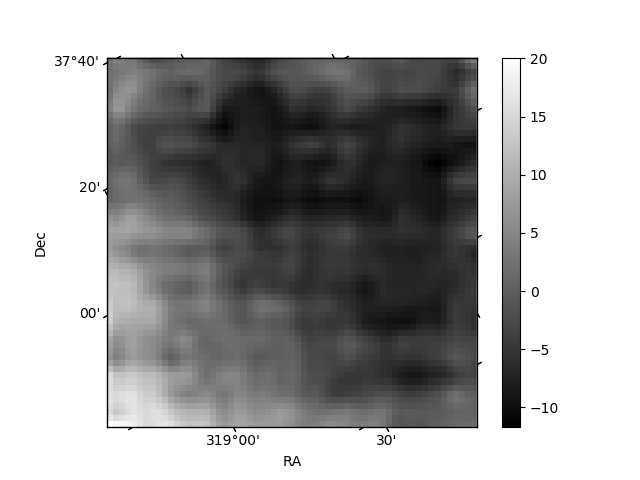
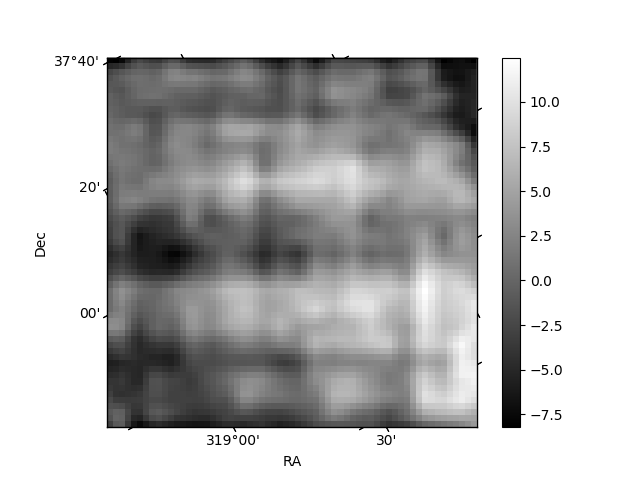
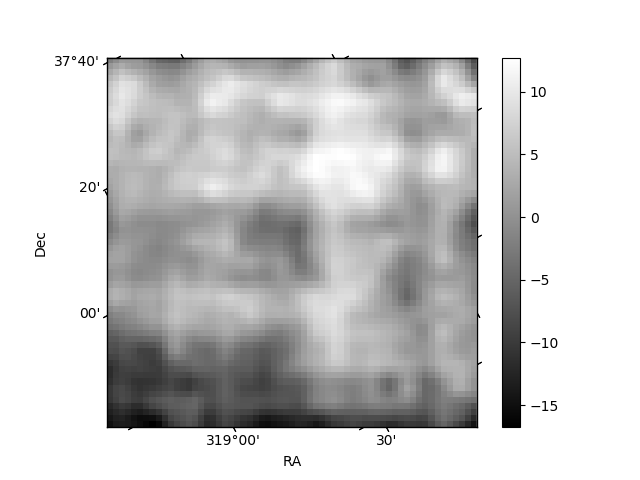
Histogram calculated using DETX and DETY for each event in the final _common_clean file
| Quadrant A | 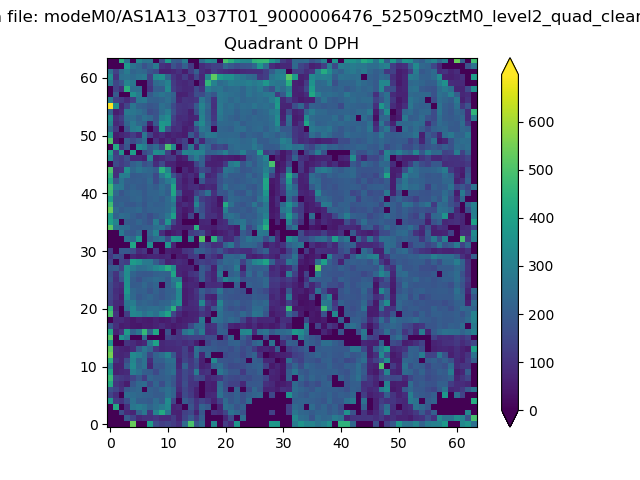 |
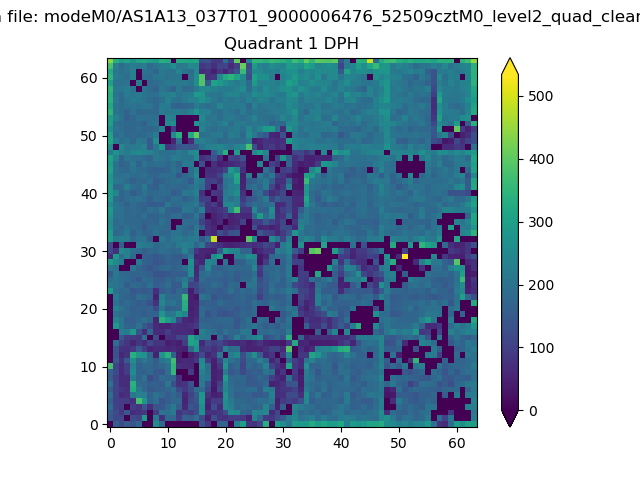 |
Quadrant B |
|---|---|---|---|
| Quadrant D | 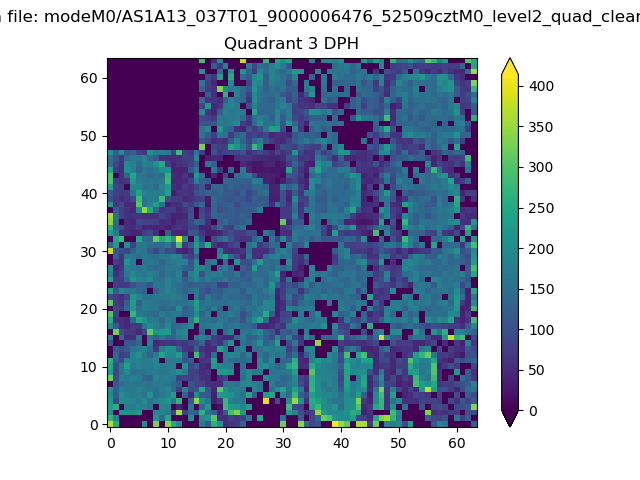 |
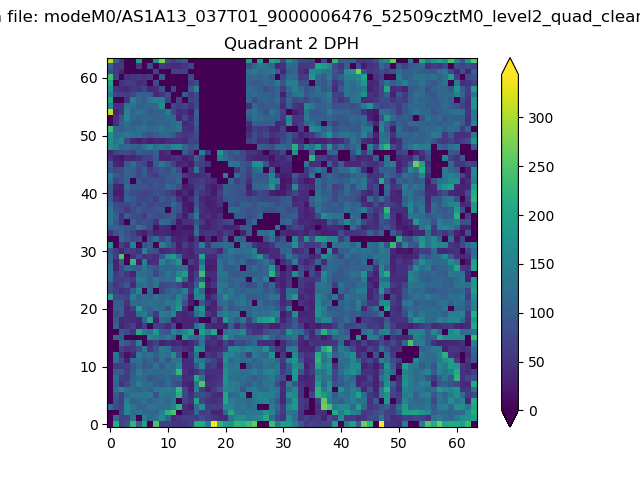 |
Quadrant C |
| Plot type | Count rate plots | Images |
|---|---|---|
| Comparison with Poisson distribution Blue bars denote a histogram of data divided into 1 sec bins. Red curve is a Poisson curve with rate = median count rate of data. |
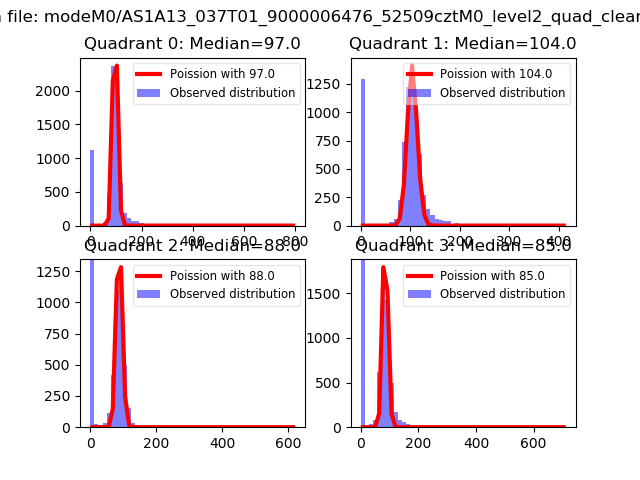 |
 |
| Quadrant-wise count rates Data is divided into 100 sec bins |
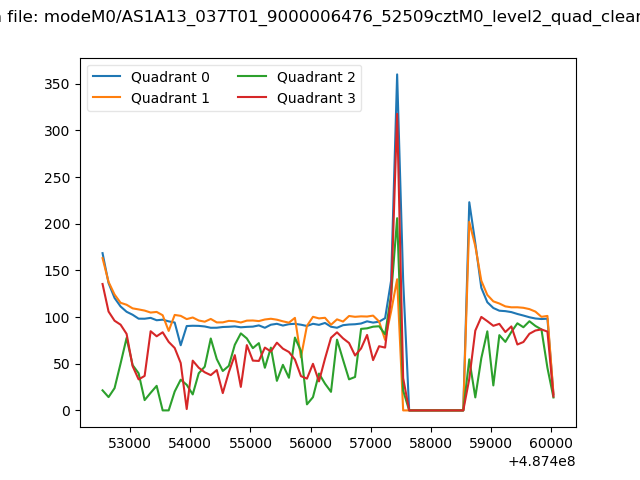 |
|
| Module-wise count rates for Quadrant A Data is divided into 100 sec bins |
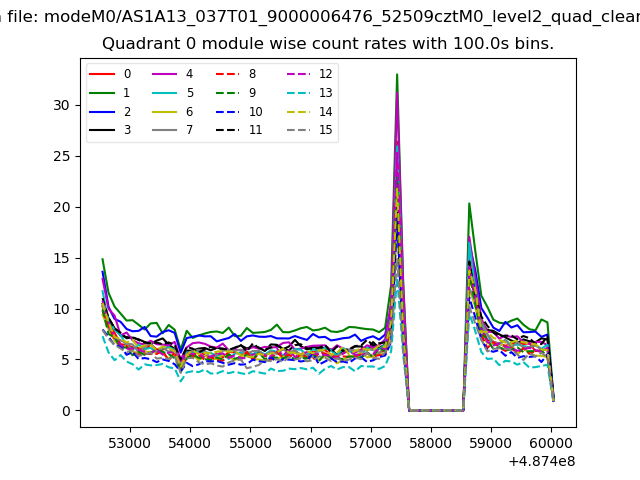 |
 |
| Module-wise count rates for Quadrant B Data is divided into 100 sec bins |
 |
 |
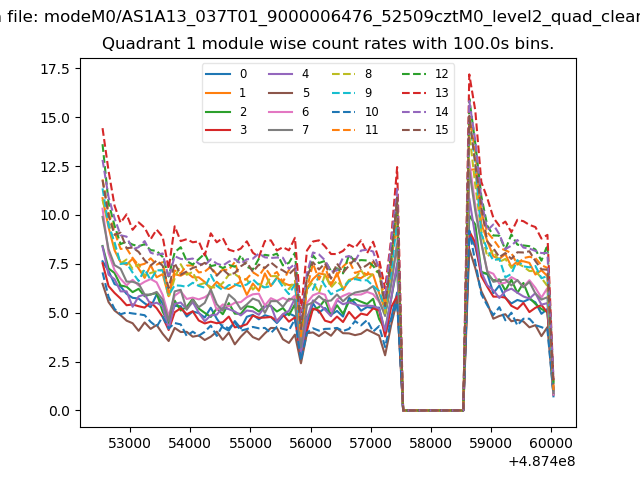
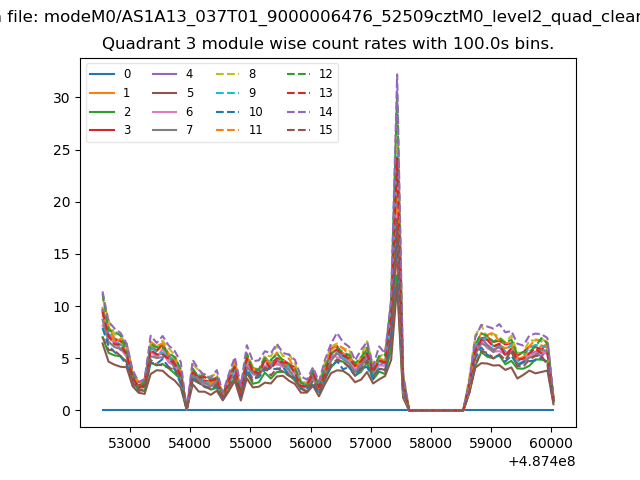
| Module-wise count rates for Quadrant C Data is divided into 100 sec bins |
 |
 |
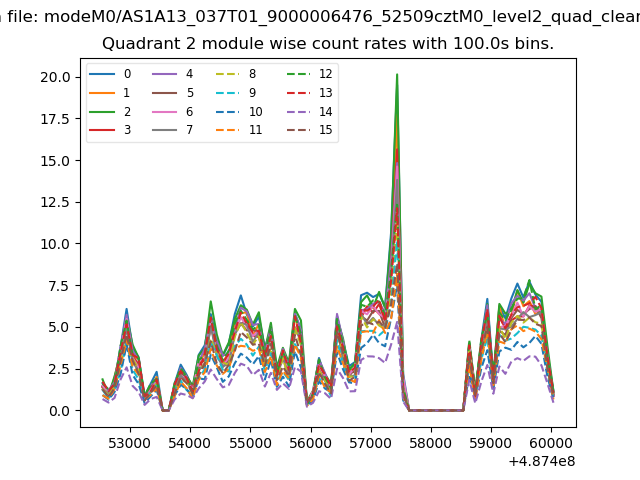
| Module-wise count rates for Quadrant D Data is divided into 100 sec bins |
 |
 |
| Parameter | Plot |
|---|---|
| CZT HV Monitor | 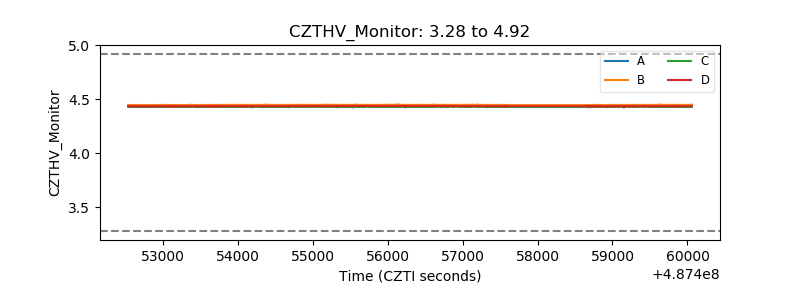 |
| D_VDD | 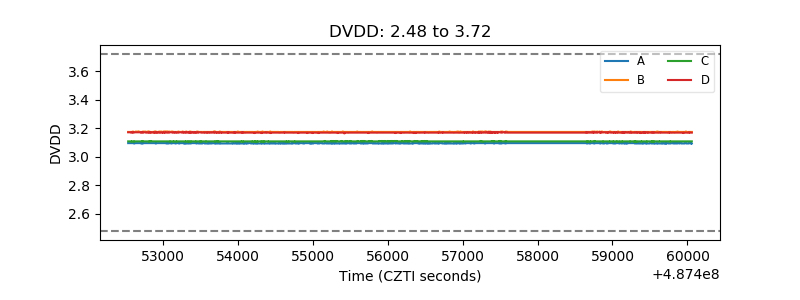 |
| Temperature 1 | 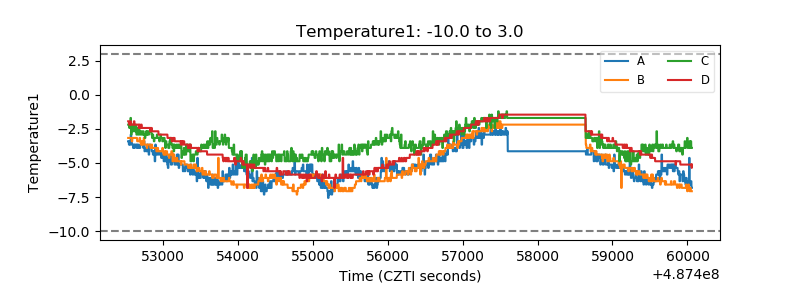 |
| Veto HV Monitor | 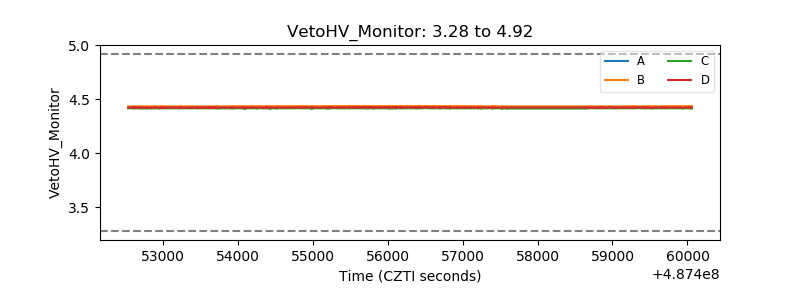 |
| Veto LLD | 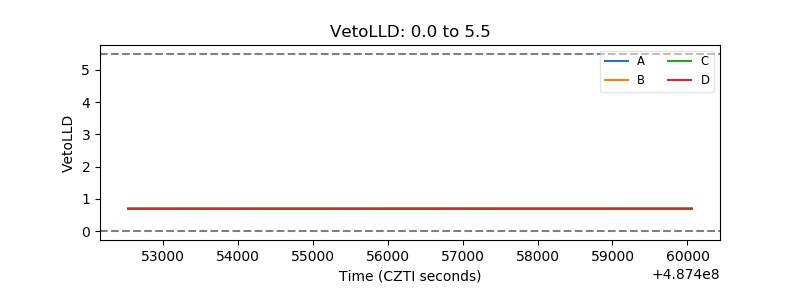 |
| Alpha Counter | 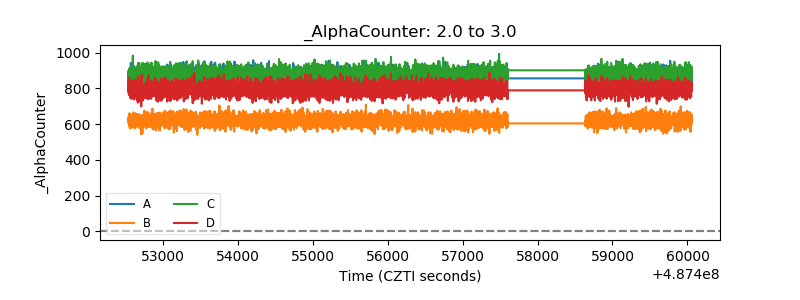 |
| _CPM_Rate | 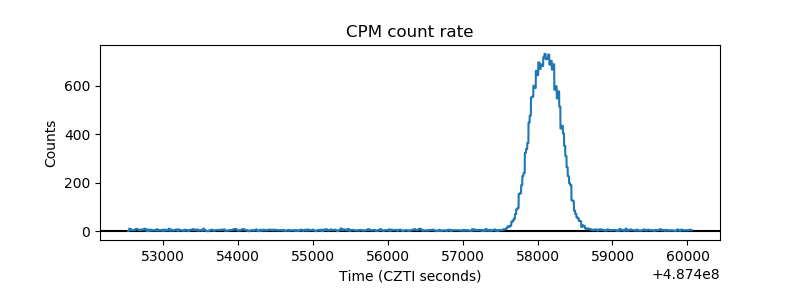 |
| CZT Counter | 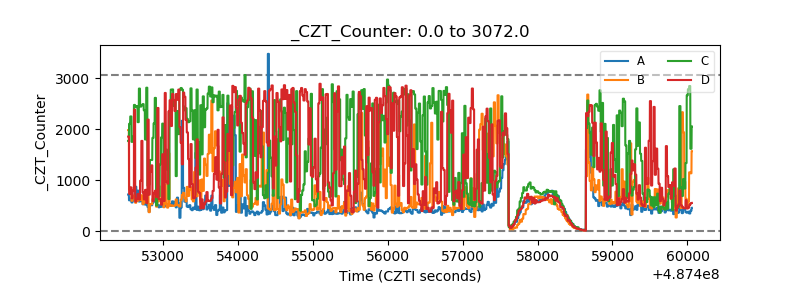 |
| +2.5 Volts monitor |  |
| +5 Volts monitor |  |
| _ROLL_ROT | 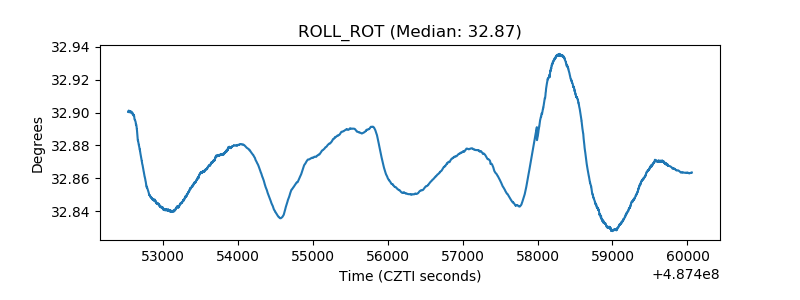 |
| _Roll_DEC | 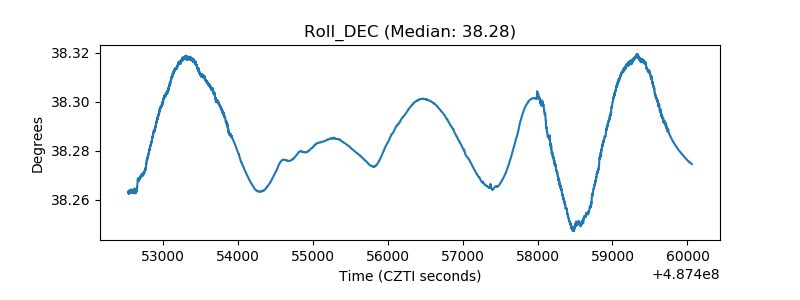 |
| _Roll_RA | 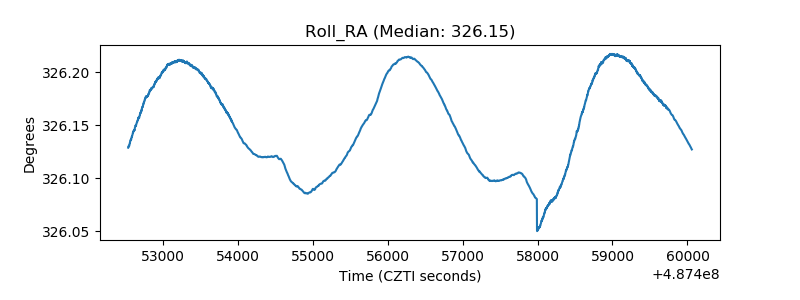 |
| Veto Counter | 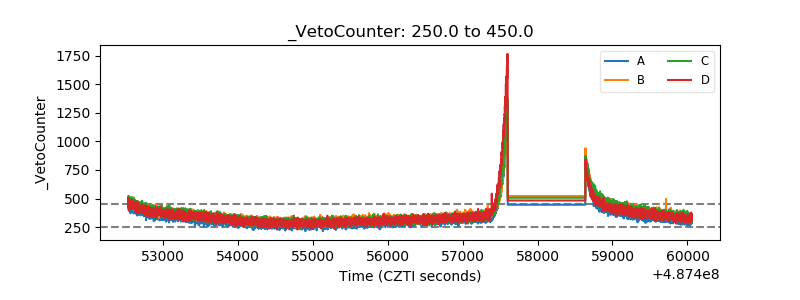 |