| Param | Original file | Final file |
|---|---|---|
| Filename | modeM0/AS1A13_037T01_9000006476_52510cztM0_level2.fits | modeM0/AS1A13_037T01_9000006476_52510cztM0_level2_quad_clean.evt |
| Size (bytes) | 738,541,440 | 88,433,280 |
| Size | 704.3 MB | 84.3 MB |
| Events in quadrant A | 2,969,710 | 659,041 |
| Events in quadrant B | 4,794,334 | 695,813 |
| Events in quadrant C | 10,188,132 | 409,425 |
| Events in quadrant D | 8,883,869 | 460,205 |
| Mode M9 | |||
|---|---|---|---|
| Quadrant | BADHDUFLAG | Total packets | Discarded packets |
| A | 0 | 15 | 0 |
| B | 0 | 16 | 0 |
| C | 0 | 16 | 0 |
| D | 0 | 16 | 0 |
| Mode M0 | |||
|---|---|---|---|
| Quadrant | BADHDUFLAG | Total packets | Discarded packets |
| A | 0 | 13814 | 2 |
| B | 0 | 18781 | 2 |
| C | 0 | 34789 | 3 |
| D | 0 | 30956 | 2 |
| Mode SS | |||
|---|---|---|---|
| Quadrant | BADHDUFLAG | Total packets | Discarded packets |
| A | 0 | 132 | 0 |
| B | 0 | 132 | 0 |
| C | 0 | 132 | 0 |
| D | 0 | 132 | 0 |
| Quadrant | Total seconds | Saturated seconds | Saturation percentage |
|---|---|---|---|
| A | 6494 | 80 | 1.231906% |
| B | 6494 | 247 | 3.803511% |
| C | 6493 | 2517 | 38.764824% |
| D | 6493 | 1531 | 23.579239% |
Noise dominated data is calculated using 1-second bins in cleaned event files. If a bin has >2000 counts, and if more than 50% of those come from <1% of pixels, then it is considered to be noise-dominated and hence unusable.
| Quadrant | # 1 sec bins | Bins with >0 counts | Bins with >2000 counts | High rate bins dominated by noise | Noise dominated (total time) | Noise dominated (detector-on time) | Marked lightcurve |
|---|---|---|---|---|---|---|---|
| A | 7634 | 6495 | 19 | 19 | 0.25% | 0.29% | 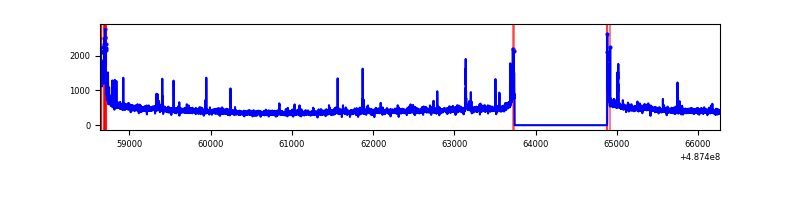 |
| B | 7634 | 6495 | 148 | 148 | 1.94% | 2.28% | 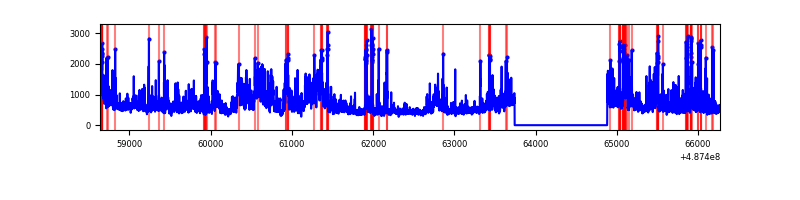 |
| C | 7632 | 6493 | 2413 | 2413 | 31.62% | 37.16% | 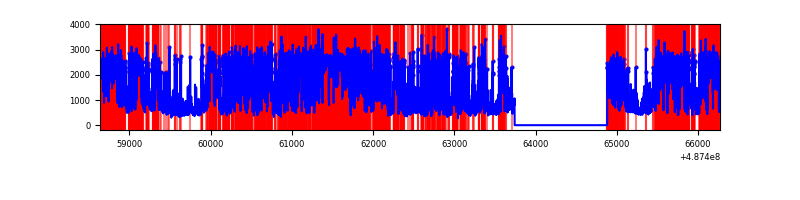 |
| D | 7633 | 6493 | 1579 | 1579 | 20.69% | 24.32% | 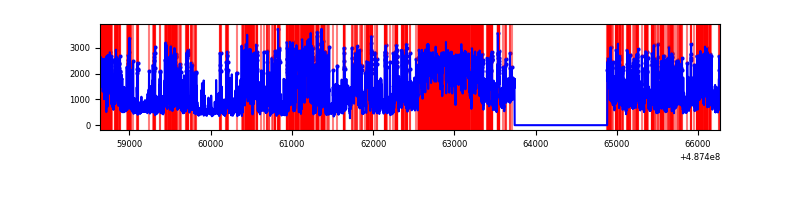 |
Top three noisy pixels from each quadrant. If the there are fewer than three noisy pixels in the level2.evt file, extra rows are filled as -1
| Pixel properties | Quadrant properties | ||||||
|---|---|---|---|---|---|---|---|
| Quadrant | DetID | PixID | Counts | Sigma | Mean | Median | Sigma |
| A | 13 | 248 | 80867 | 450.12 | 710 | 692 | 178.1 |
| A | 3 | 14 | 31899 | 175.2 | 710 | 692 | 178.1 |
| A | 11 | 3 | 29046 | 159.19 | 710 | 692 | 178.1 |
| B | 10 | 254 | 924934 | 6153.75 | 703 | 678 | 150.2 |
| B | 10 | 44 | 318043 | 2113.03 | 703 | 678 | 150.2 |
| B | 4 | 81 | 255050 | 1693.62 | 703 | 678 | 150.2 |
| C | 15 | 224 | 6929874 | 44383.23 | 567 | 562 | 156.1 |
| C | 13 | 3 | 364912 | 2333.71 | 567 | 562 | 156.1 |
| C | 4 | 5 | 166330 | 1061.77 | 567 | 562 | 156.1 |
| D | 15 | 93 | 3092786 | 17400.74 | 619 | 592 | 177.7 |
| D | 6 | 42 | 1169344 | 6576.93 | 619 | 592 | 177.7 |
| D | 8 | 176 | 610392 | 3431.53 | 619 | 592 | 177.7 |
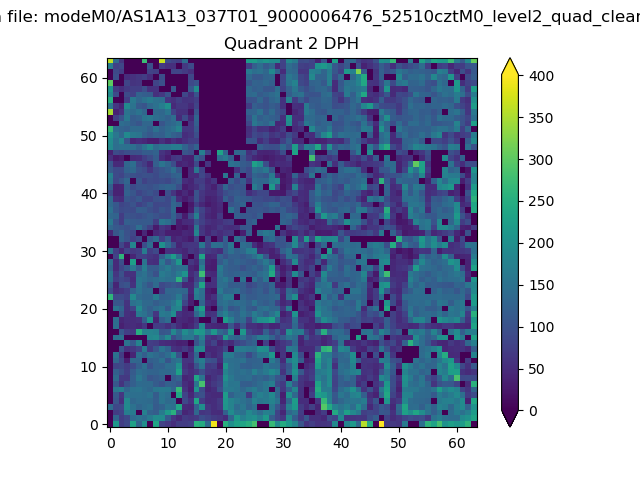
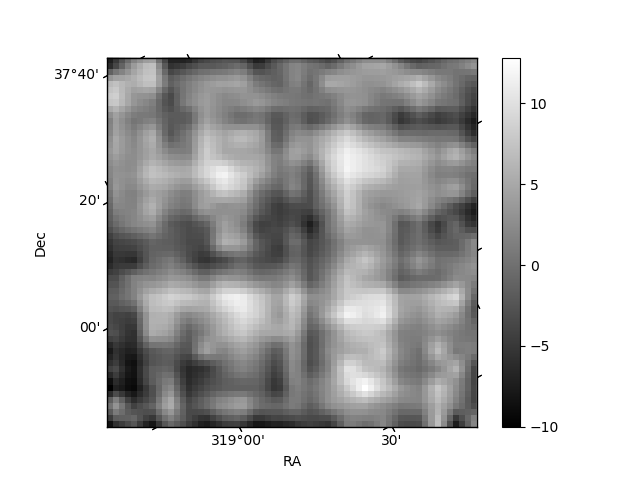
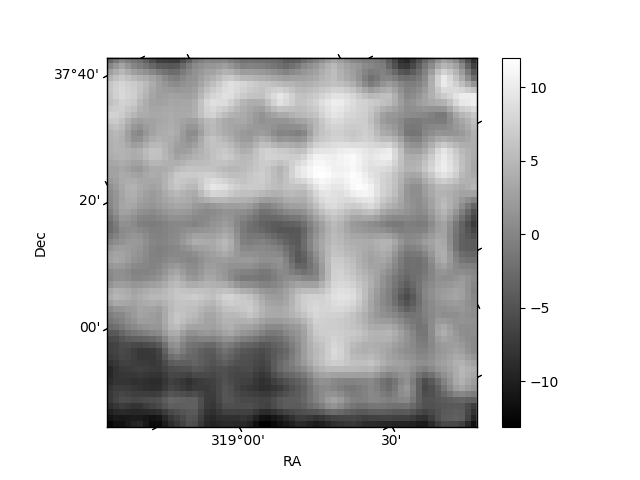
Histogram calculated using DETX and DETY for each event in the final _common_clean file
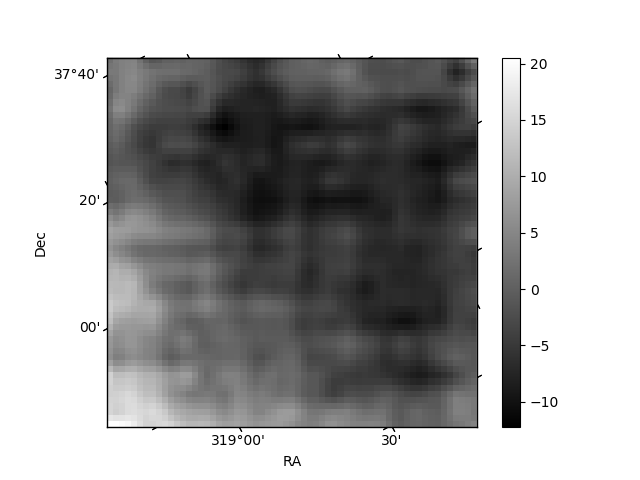
| Quadrant A | 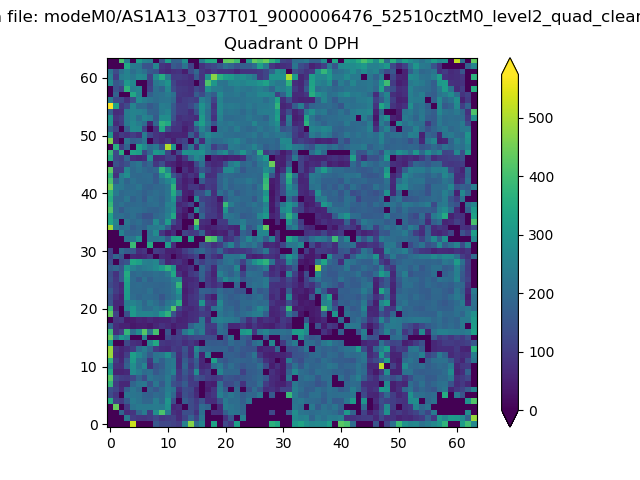 |
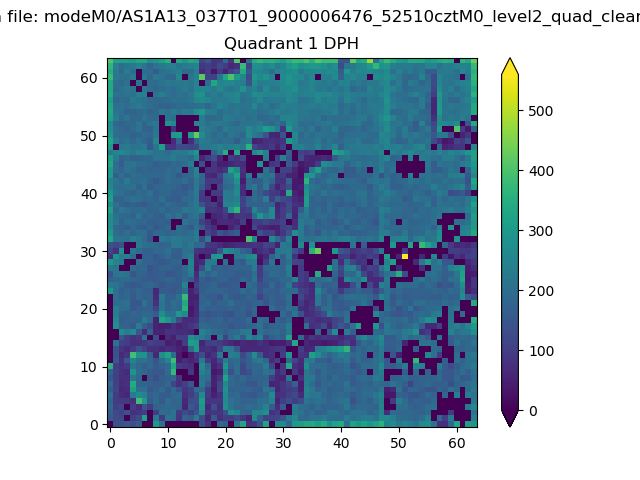 |
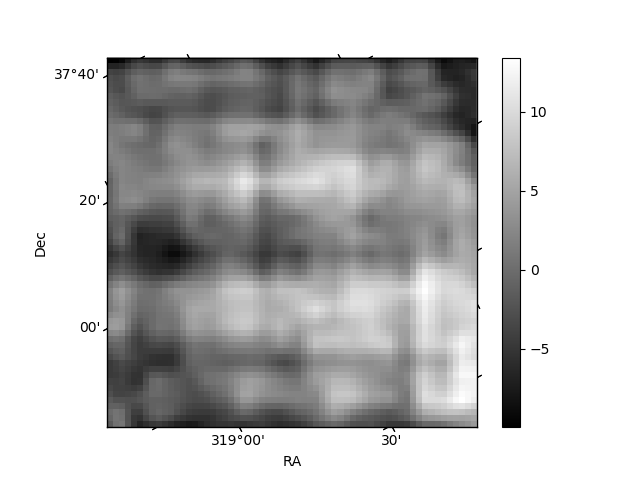
Quadrant B |
|---|---|---|---|
| Quadrant D | 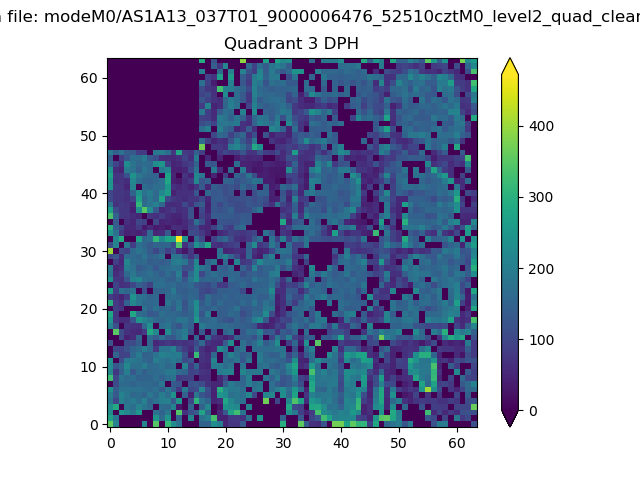 |
 |
Quadrant C |
| Plot type | Count rate plots | Images |
|---|---|---|
| Comparison with Poisson distribution Blue bars denote a histogram of data divided into 1 sec bins. Red curve is a Poisson curve with rate = median count rate of data. |
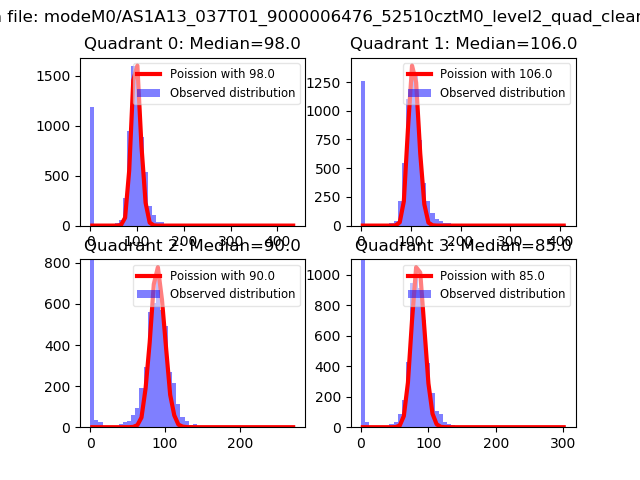 |
 |
| Quadrant-wise count rates Data is divided into 100 sec bins |
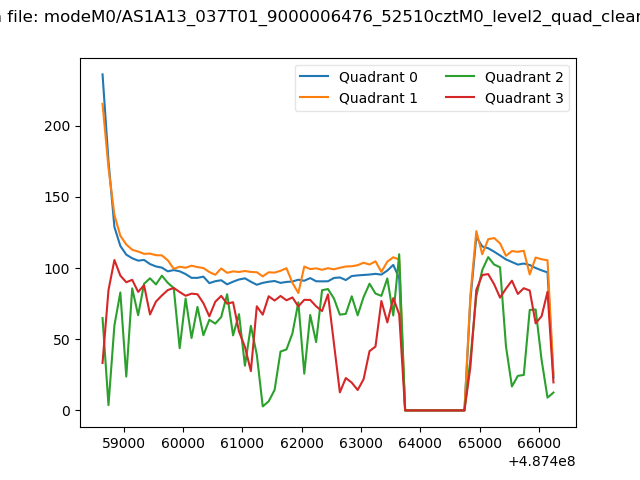 |
|
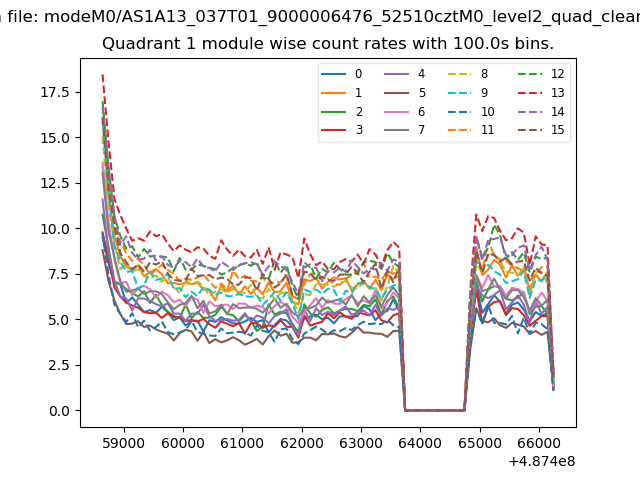
| Module-wise count rates for Quadrant A Data is divided into 100 sec bins |
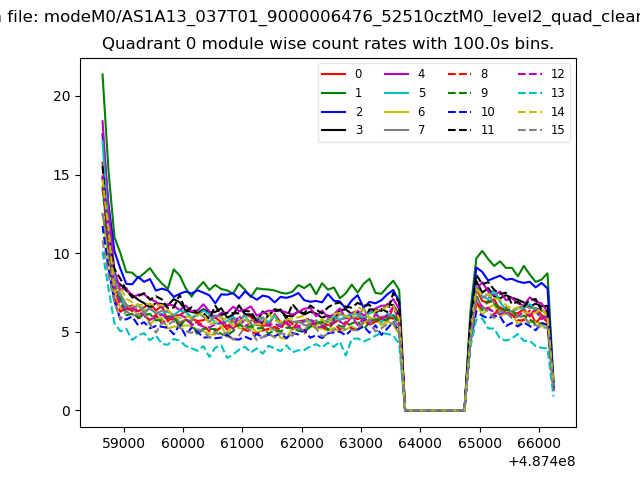 |
 |
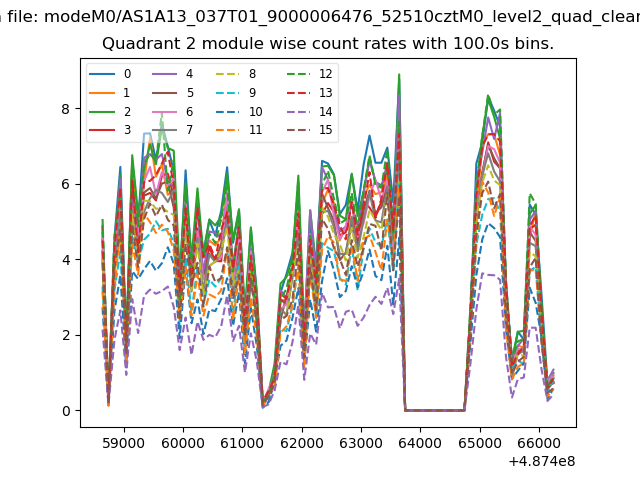
| Module-wise count rates for Quadrant B Data is divided into 100 sec bins |
 |
 |
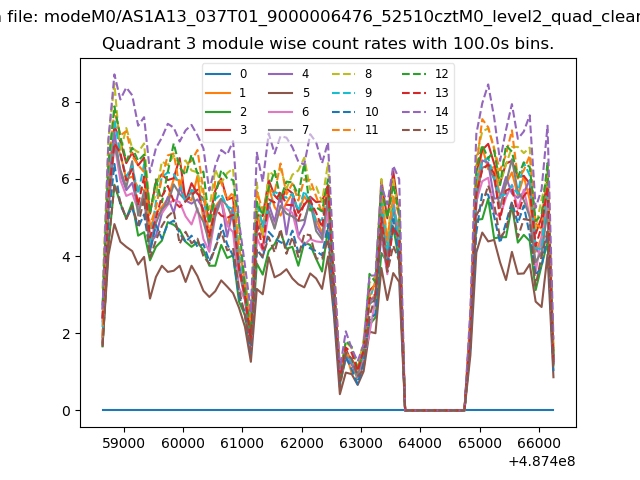
| Module-wise count rates for Quadrant C Data is divided into 100 sec bins |
 |
 |
| Module-wise count rates for Quadrant D Data is divided into 100 sec bins |
 |
 |
| Parameter | Plot |
|---|---|
| CZT HV Monitor | 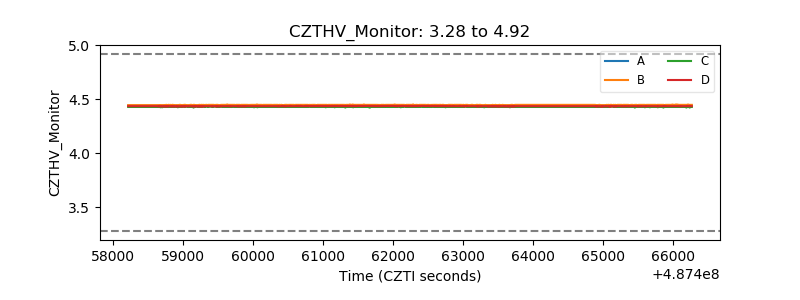 |
| D_VDD | 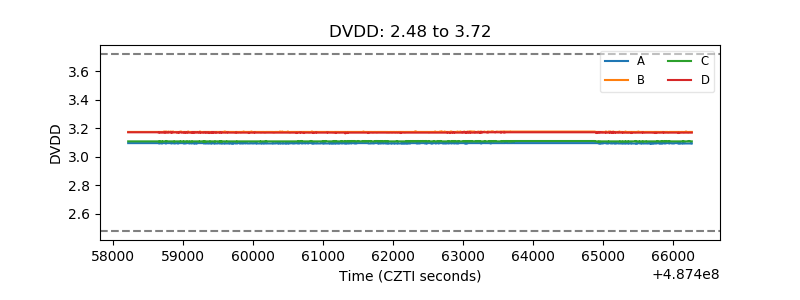 |
| Temperature 1 | 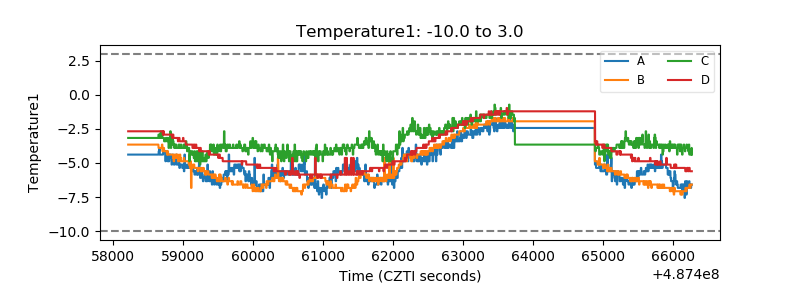 |
| Veto HV Monitor | 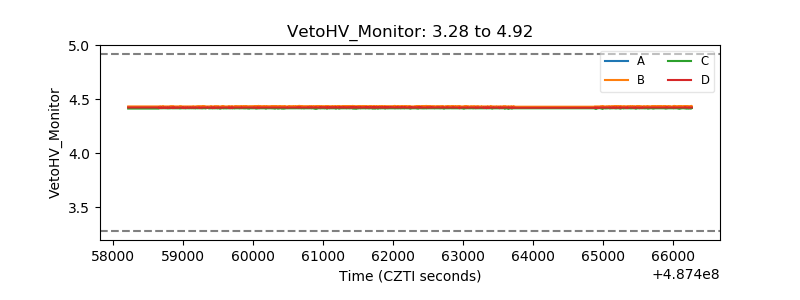 |
| Veto LLD | 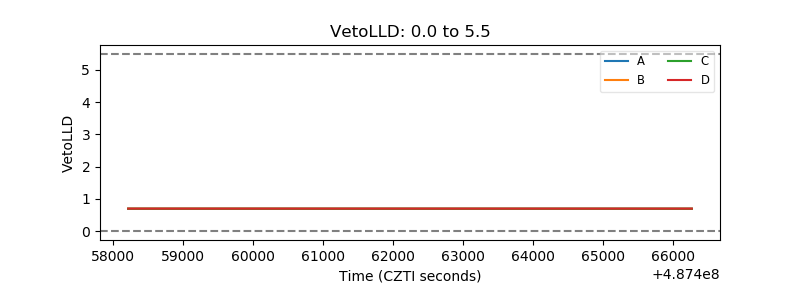 |
| Alpha Counter | 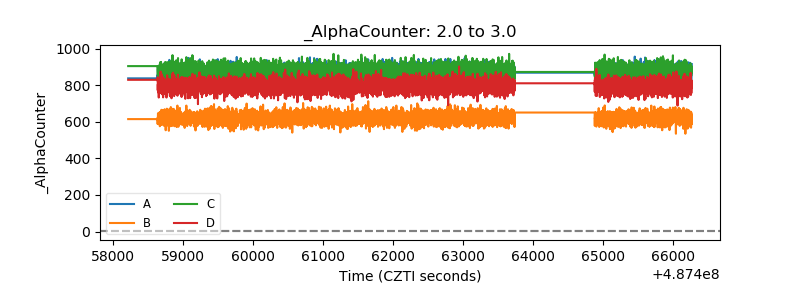 |
| _CPM_Rate | 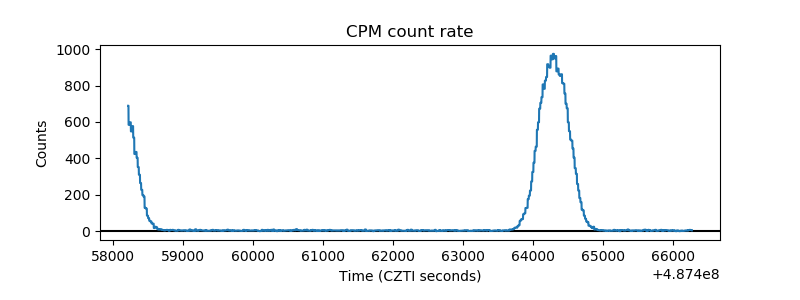 |
| CZT Counter | 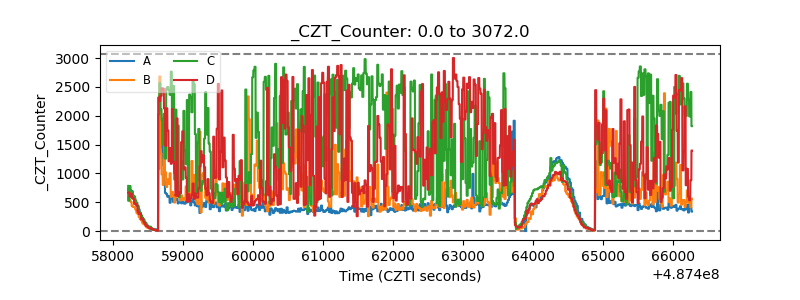 |
| +2.5 Volts monitor |  |
| +5 Volts monitor |  |
| _ROLL_ROT | 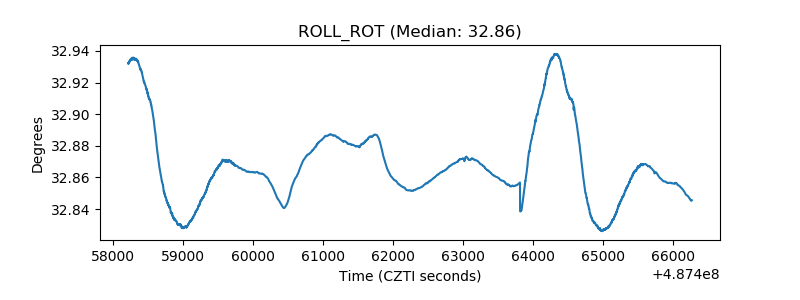 |
| _Roll_DEC | 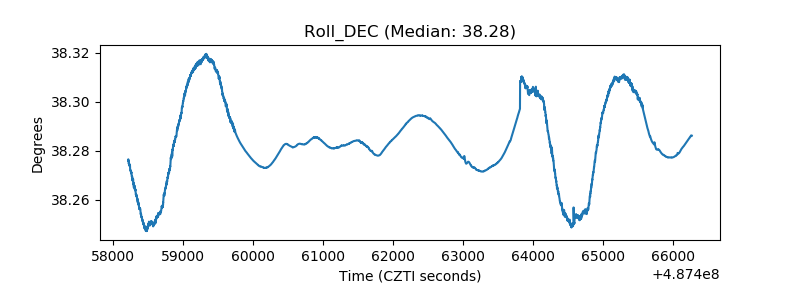 |
| _Roll_RA | 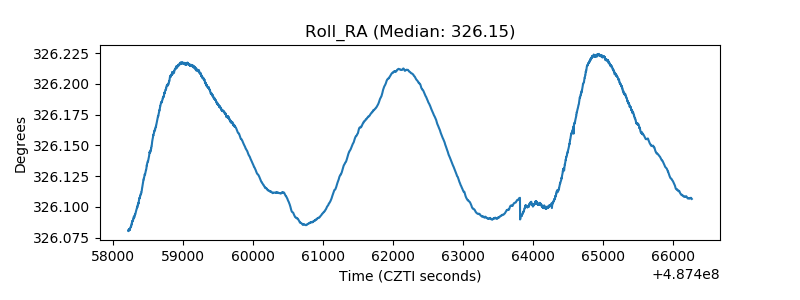 |
| Veto Counter | 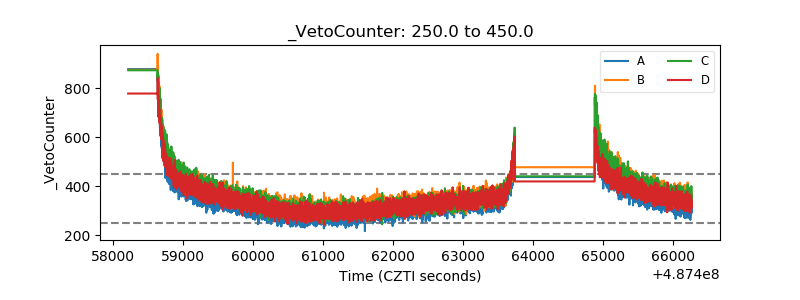 |