| Param | Original file | Final file |
|---|---|---|
| Filename | modeM0/AS1A13_037T01_9000006476_52511cztM0_level2.fits | modeM0/AS1A13_037T01_9000006476_52511cztM0_level2_quad_clean.evt |
| Size (bytes) | 813,651,840 | 82,327,680 |
| Size | 776.0 MB | 78.5 MB |
| Events in quadrant A | 2,826,226 | 641,647 |
| Events in quadrant B | 7,965,010 | 551,145 |
| Events in quadrant C | 10,064,114 | 413,841 |
| Events in quadrant D | 8,766,506 | 437,545 |
| Mode M9 | |||
|---|---|---|---|
| Quadrant | BADHDUFLAG | Total packets | Discarded packets |
| A | 0 | 17 | 0 |
| B | 0 | 18 | 0 |
| C | 0 | 18 | 0 |
| D | 0 | 18 | 0 |
| Mode M0 | |||
|---|---|---|---|
| Quadrant | BADHDUFLAG | Total packets | Discarded packets |
| A | 0 | 13321 | 2 |
| B | 0 | 28091 | 2 |
| C | 0 | 34355 | 2 |
| D | 0 | 30520 | 2 |
| Mode SS | |||
|---|---|---|---|
| Quadrant | BADHDUFLAG | Total packets | Discarded packets |
| A | 0 | 130 | 0 |
| B | 0 | 130 | 0 |
| C | 0 | 130 | 0 |
| D | 0 | 130 | 0 |
| Quadrant | Total seconds | Saturated seconds | Saturation percentage |
|---|---|---|---|
| A | 6427 | 27 | 0.420103% |
| B | 6427 | 1583 | 24.630465% |
| C | 6427 | 2371 | 36.891240% |
| D | 6427 | 1669 | 25.968570% |
Noise dominated data is calculated using 1-second bins in cleaned event files. If a bin has >2000 counts, and if more than 50% of those come from <1% of pixels, then it is considered to be noise-dominated and hence unusable.
| Quadrant | # 1 sec bins | Bins with >0 counts | Bins with >2000 counts | High rate bins dominated by noise | Noise dominated (total time) | Noise dominated (detector-on time) | Marked lightcurve |
|---|---|---|---|---|---|---|---|
| A | 7632 | 6428 | 8 | 8 | 0.10% | 0.12% | 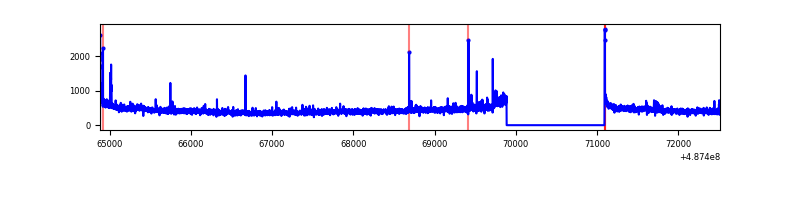 |
| B | 7632 | 6428 | 1505 | 1505 | 19.72% | 23.41% | 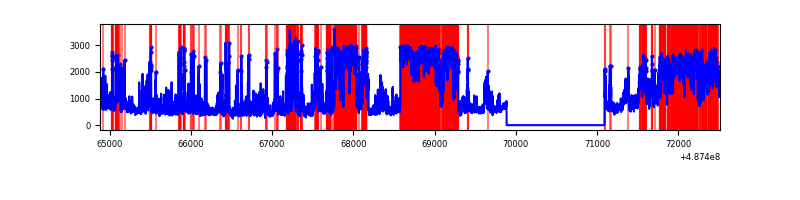 |
| C | 7631 | 6427 | 2302 | 2302 | 30.17% | 35.82% | 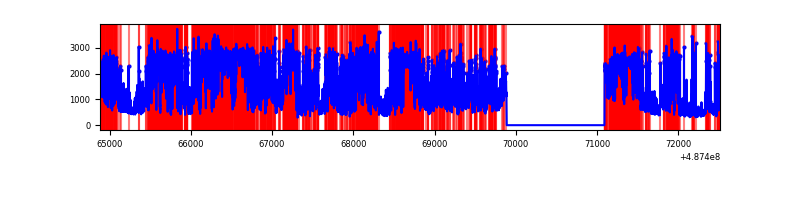 |
| D | 7632 | 6427 | 1702 | 1702 | 22.30% | 26.48% | 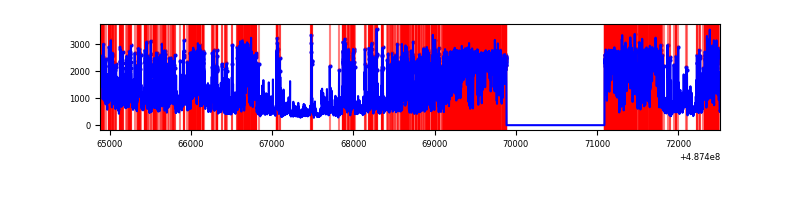 |
Top three noisy pixels from each quadrant. If the there are fewer than three noisy pixels in the level2.evt file, extra rows are filled as -1
| Pixel properties | Quadrant properties | ||||||
|---|---|---|---|---|---|---|---|
| Quadrant | DetID | PixID | Counts | Sigma | Mean | Median | Sigma |
| A | 11 | 3 | 17019 | 95.11 | 692 | 675 | 171.9 |
| A | 4 | 159 | 15095 | 83.91 | 692 | 675 | 171.9 |
| A | 4 | 95 | 15037 | 83.57 | 692 | 675 | 171.9 |
| B | 10 | 44 | 3253058 | 24626.73 | 620 | 599 | 132.1 |
| B | 10 | 254 | 1587422 | 12014.99 | 620 | 599 | 132.1 |
| B | 4 | 81 | 225420 | 1702.28 | 620 | 599 | 132.1 |
| C | 15 | 224 | 4716698 | 30458.76 | 557 | 553 | 154.8 |
| C | 15 | 233 | 1751888 | 11310.83 | 557 | 553 | 154.8 |
| C | 13 | 3 | 508163 | 3278.35 | 557 | 553 | 154.8 |
| D | 15 | 93 | 4501165 | 26985.64 | 581 | 555 | 166.8 |
| D | 8 | 176 | 442695 | 2651.07 | 581 | 555 | 166.8 |
| D | 6 | 42 | 290309 | 1737.36 | 581 | 555 | 166.8 |
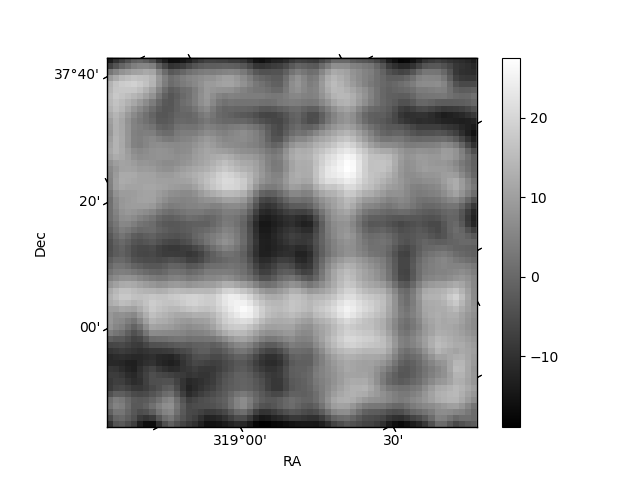
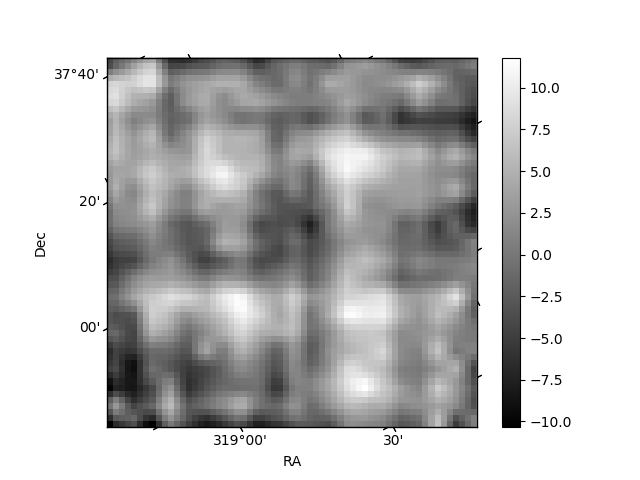
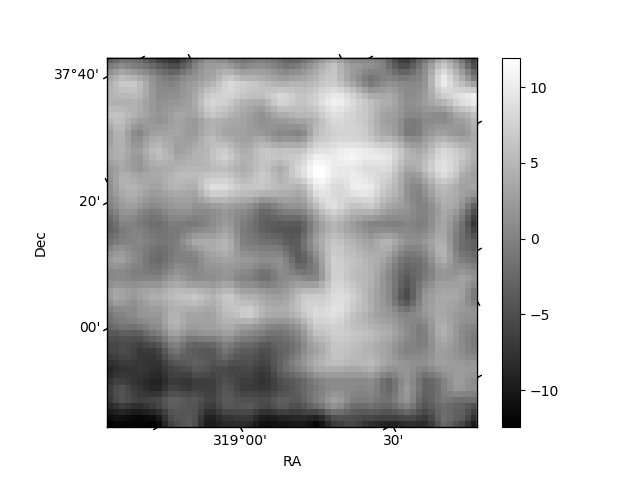
Histogram calculated using DETX and DETY for each event in the final _common_clean file
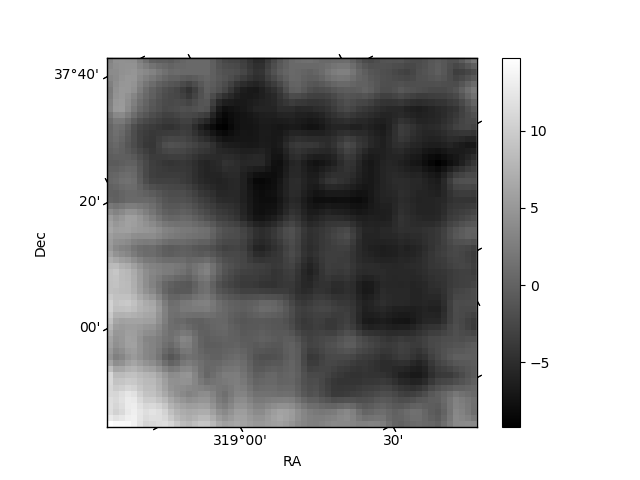
| Quadrant A | 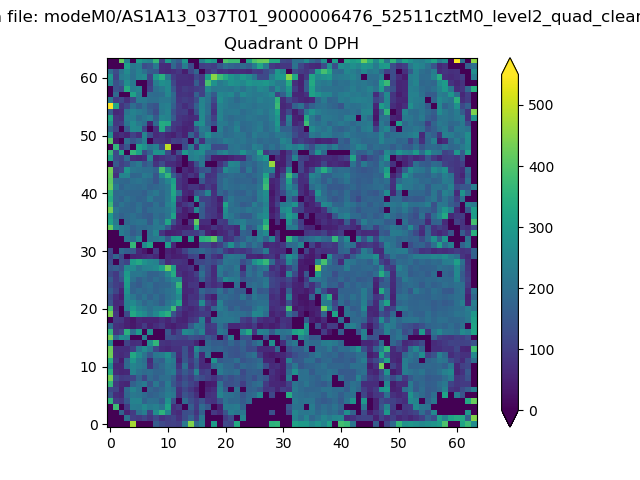 |
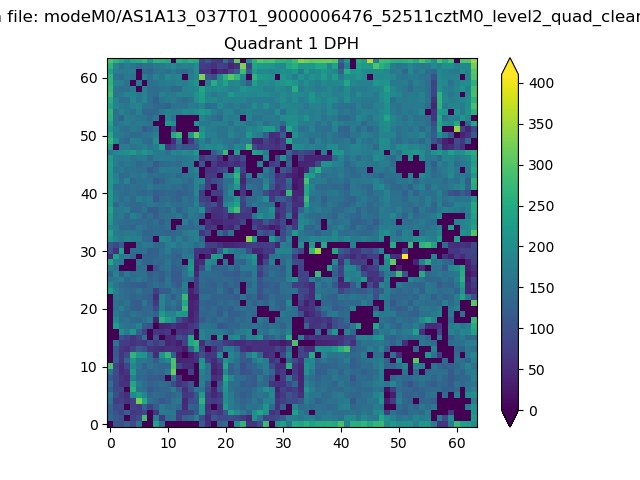 |
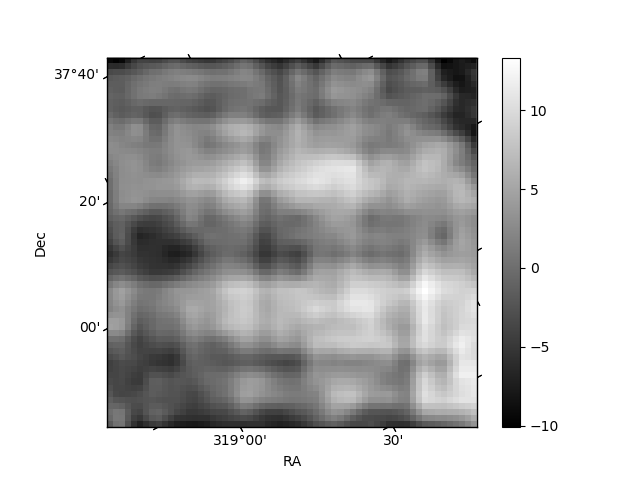
Quadrant B |
|---|---|---|---|
| Quadrant D | 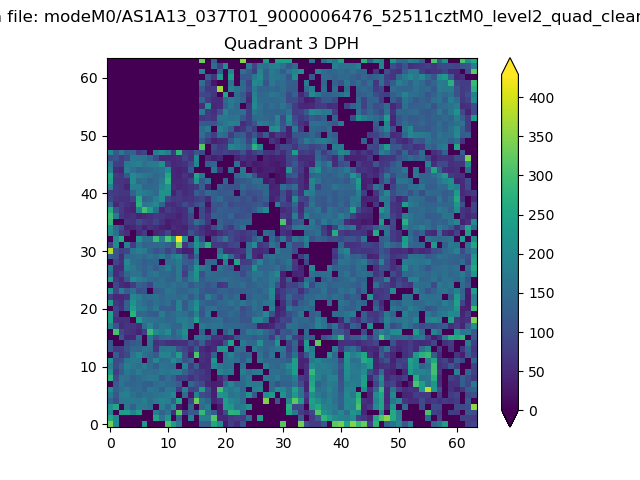 |
 |
Quadrant C |
| Plot type | Count rate plots | Images |
|---|---|---|
| Comparison with Poisson distribution Blue bars denote a histogram of data divided into 1 sec bins. Red curve is a Poisson curve with rate = median count rate of data. |
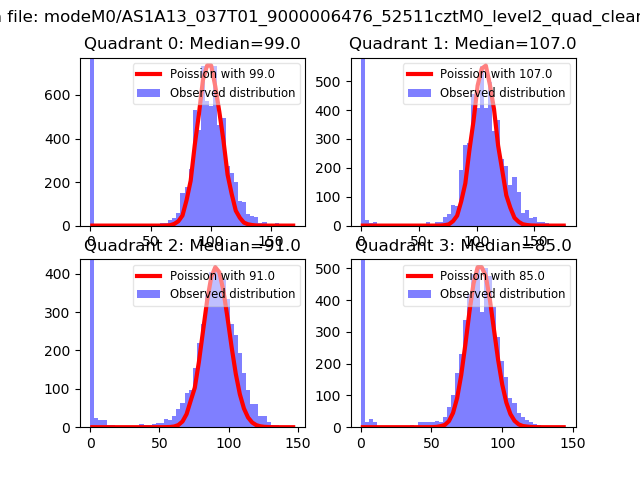 |
 |
| Quadrant-wise count rates Data is divided into 100 sec bins |
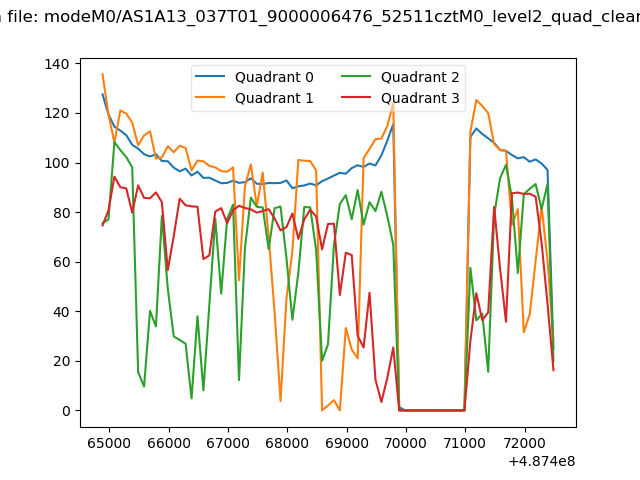 |
|
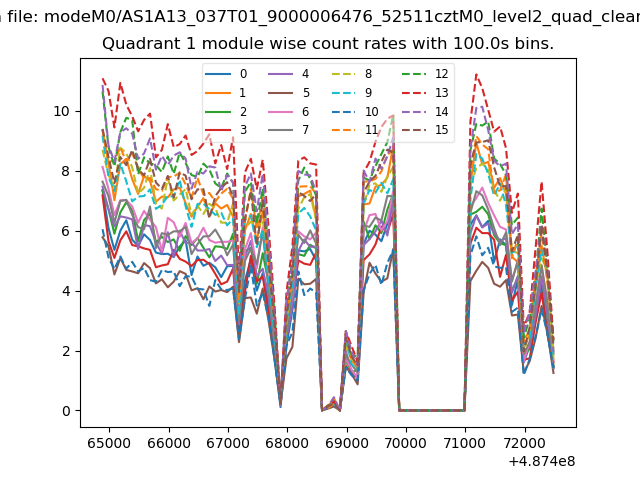
| Module-wise count rates for Quadrant A Data is divided into 100 sec bins |
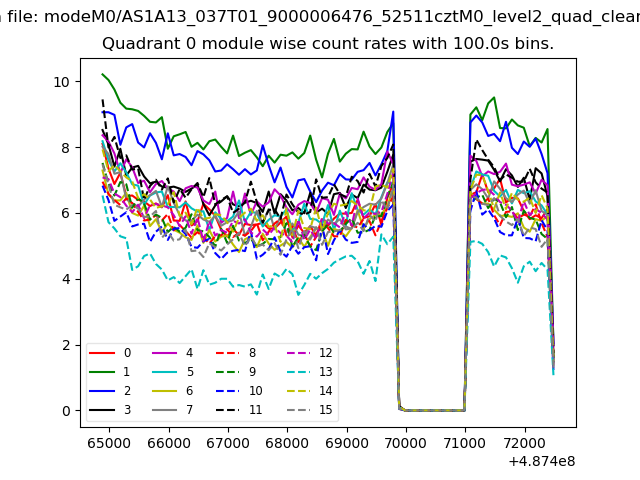 |
 |
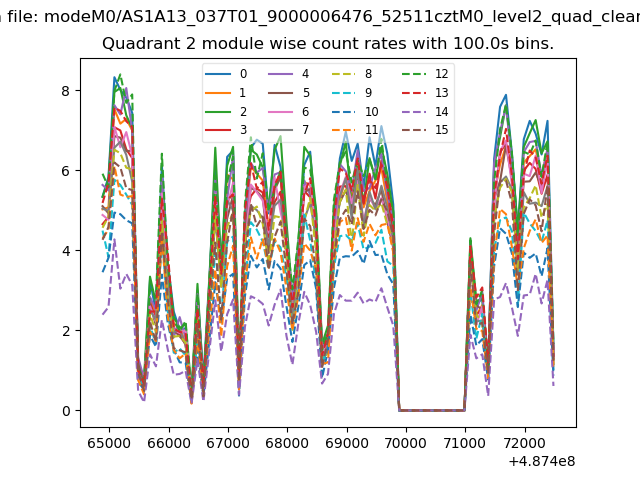
| Module-wise count rates for Quadrant B Data is divided into 100 sec bins |
 |
 |
| Module-wise count rates for Quadrant C Data is divided into 100 sec bins |
 |
 |
| Module-wise count rates for Quadrant D Data is divided into 100 sec bins |
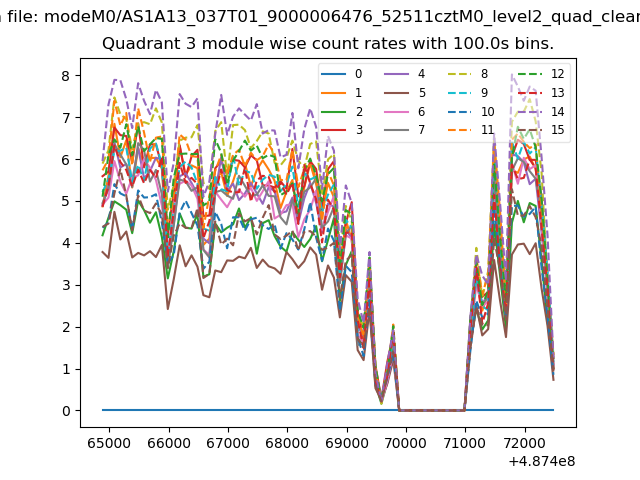 |
 |
| Parameter | Plot |
|---|---|
| CZT HV Monitor | 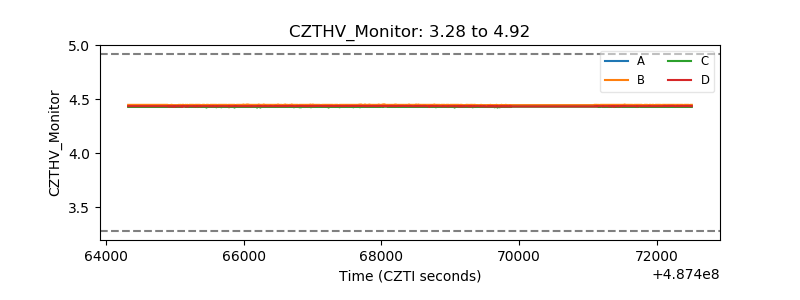 |
| D_VDD | 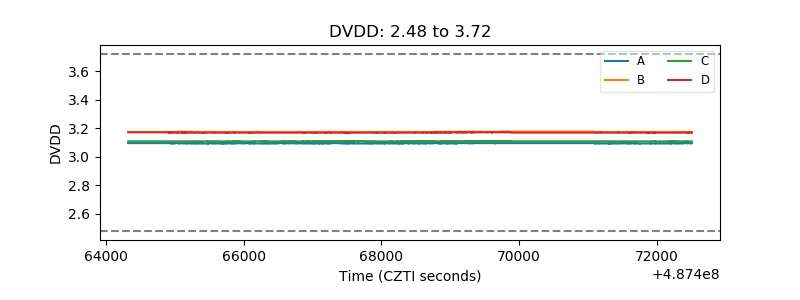 |
| Temperature 1 | 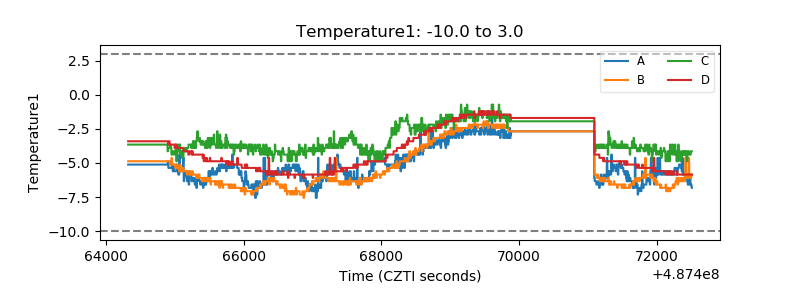 |
| Veto HV Monitor | 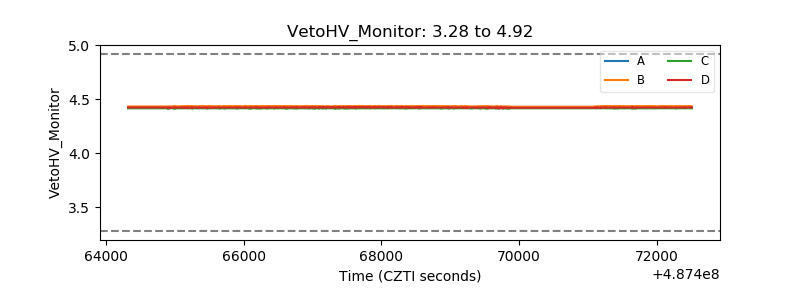 |
| Veto LLD | 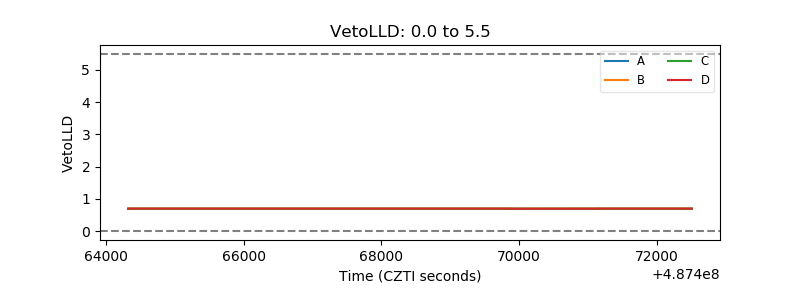 |
| Alpha Counter | 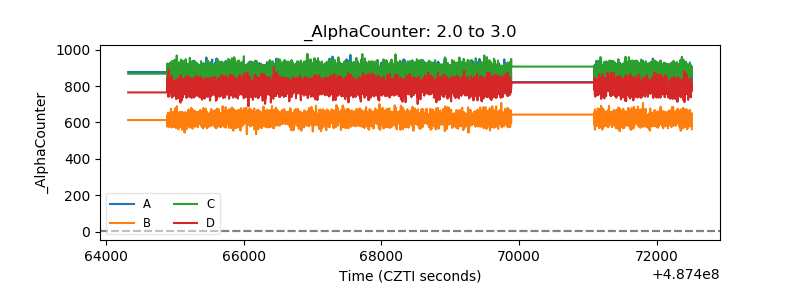 |
| _CPM_Rate | 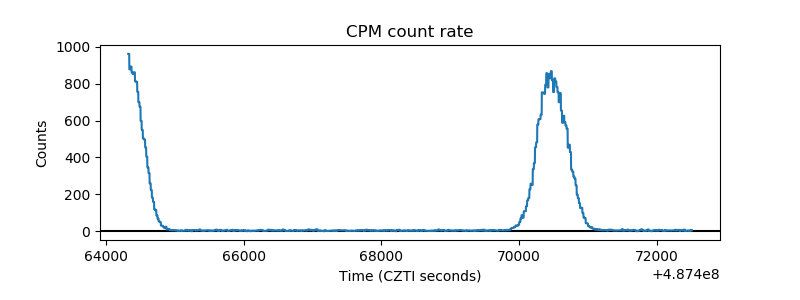 |
| CZT Counter | 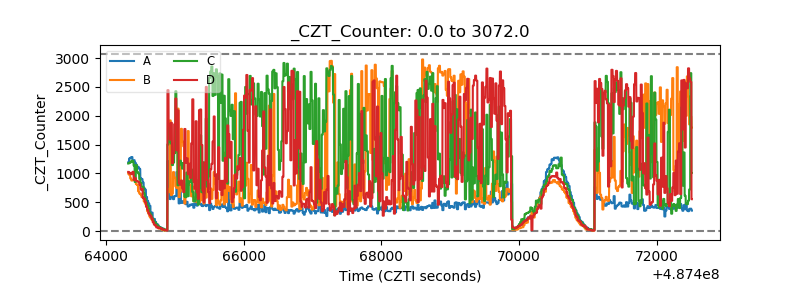 |
| +2.5 Volts monitor | 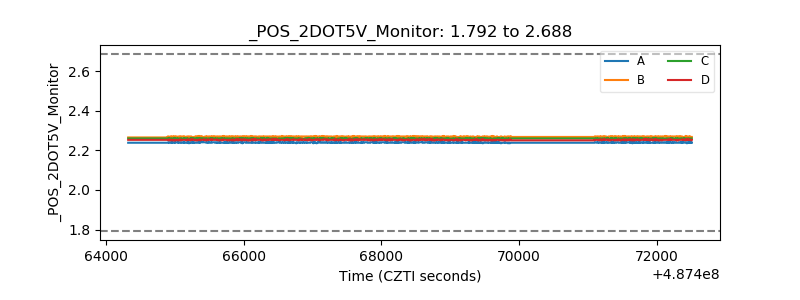 |
| +5 Volts monitor | 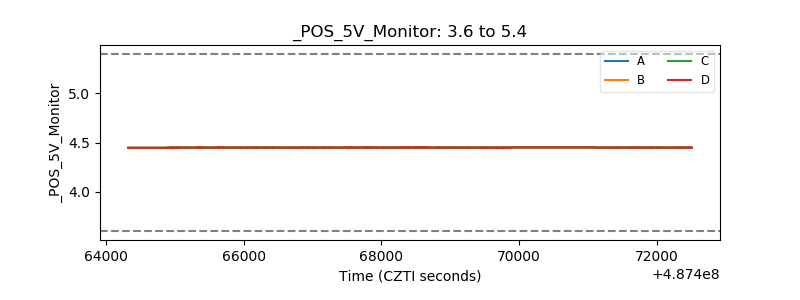 |
| _ROLL_ROT | 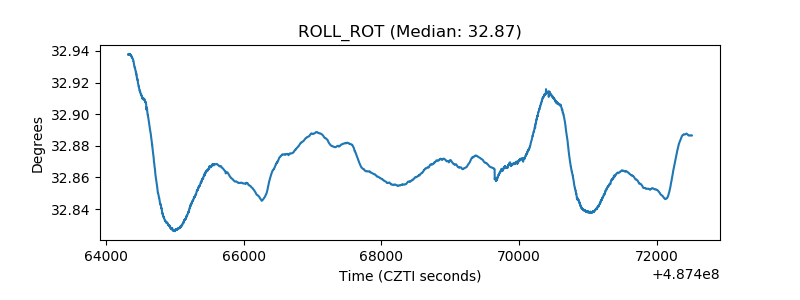 |
| _Roll_DEC | 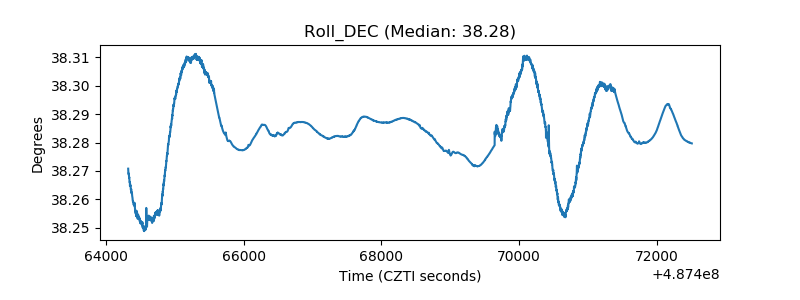 |
| _Roll_RA | 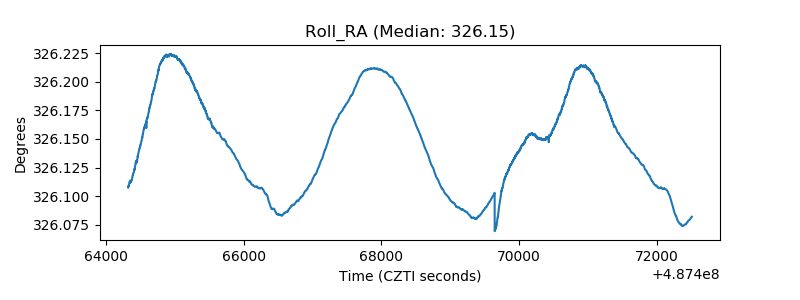 |
| Veto Counter | 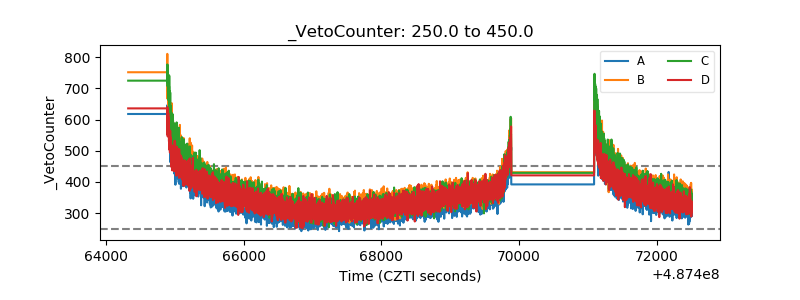 |