| Param | Original file | Final file |
|---|---|---|
| Filename | modeM0/AS1A13_037T01_9000006476_52513cztM0_level2.fits | modeM0/AS1A13_037T01_9000006476_52513cztM0_level2_quad_clean.evt |
| Size (bytes) | 489,628,800 | 50,325,120 |
| Size | 466.9 MB | 48.0 MB |
| Events in quadrant A | 1,659,523 | 378,905 |
| Events in quadrant B | 6,133,107 | 270,654 |
| Events in quadrant C | 6,032,096 | 276,608 |
| Events in quadrant D | 3,986,121 | 312,789 |
| Mode M0 | |||
|---|---|---|---|
| Quadrant | BADHDUFLAG | Total packets | Discarded packets |
| A | 0 | 8182 | 0 |
| B | 0 | 21027 | 0 |
| C | 0 | 20739 | 0 |
| D | 0 | 14698 | 0 |
| Mode SS | |||
|---|---|---|---|
| Quadrant | BADHDUFLAG | Total packets | Discarded packets |
| A | 0 | 80 | 0 |
| B | 0 | 80 | 0 |
| C | 0 | 80 | 0 |
| D | 0 | 80 | 0 |
| Quadrant | Total seconds | Saturated seconds | Saturation percentage |
|---|---|---|---|
| A | 4037 | 3 | 0.074313% |
| B | 4038 | 1551 | 38.410104% |
| C | 4038 | 1181 | 29.247152% |
| D | 4038 | 397 | 9.831600% |
Noise dominated data is calculated using 1-second bins in cleaned event files. If a bin has >2000 counts, and if more than 50% of those come from <1% of pixels, then it is considered to be noise-dominated and hence unusable.
| Quadrant | # 1 sec bins | Bins with >0 counts | Bins with >2000 counts | High rate bins dominated by noise | Noise dominated (total time) | Noise dominated (detector-on time) | Marked lightcurve |
|---|---|---|---|---|---|---|---|
| A | 4037 | 4037 | 1 | 1 | 0.02% | 0.02% | 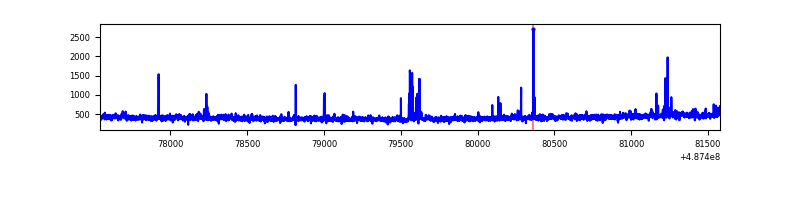 |
| B | 4038 | 4038 | 1497 | 1497 | 37.07% | 37.07% | 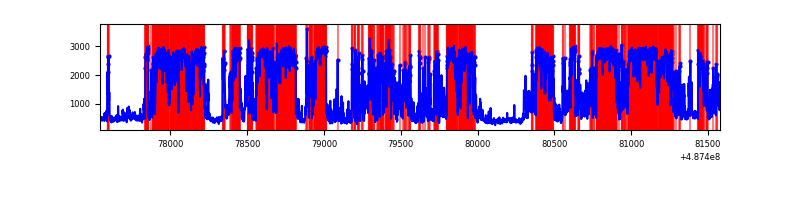 |
| C | 4038 | 4038 | 1301 | 1301 | 32.22% | 32.22% | 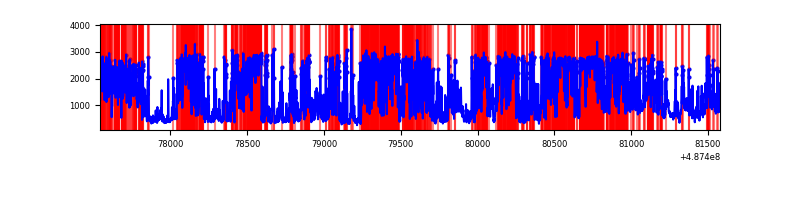 |
| D | 4038 | 4038 | 469 | 469 | 11.61% | 11.61% | 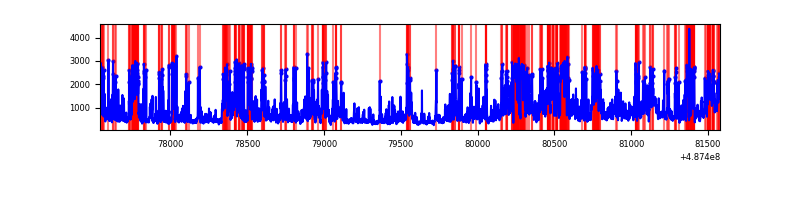 |
Top three noisy pixels from each quadrant. If the there are fewer than three noisy pixels in the level2.evt file, extra rows are filled as -1
| Pixel properties | Quadrant properties | ||||||
|---|---|---|---|---|---|---|---|
| Quadrant | DetID | PixID | Counts | Sigma | Mean | Median | Sigma |
| A | 5 | 240 | 19653 | 188.79 | 406 | 397 | 102.0 |
| A | 11 | 3 | 19206 | 184.41 | 406 | 397 | 102.0 |
| A | 13 | 248 | 9429 | 88.55 | 406 | 397 | 102.0 |
| B | 10 | 44 | 4249723 | 60029.47 | 322 | 311 | 70.8 |
| B | 4 | 171 | 398194 | 5620.71 | 322 | 311 | 70.8 |
| B | 10 | 254 | 107226 | 1510.34 | 322 | 311 | 70.8 |
| C | 15 | 224 | 2133318 | 22270.91 | 344 | 341 | 95.8 |
| C | 15 | 233 | 2122037 | 22153.12 | 344 | 341 | 95.8 |
| C | 13 | 3 | 284822 | 2970.33 | 344 | 341 | 95.8 |
| D | 15 | 93 | 1622680 | 14987.13 | 372 | 356 | 108.2 |
| D | 6 | 42 | 251412 | 2319.27 | 372 | 356 | 108.2 |
| D | 8 | 176 | 189548 | 1747.77 | 372 | 356 | 108.2 |
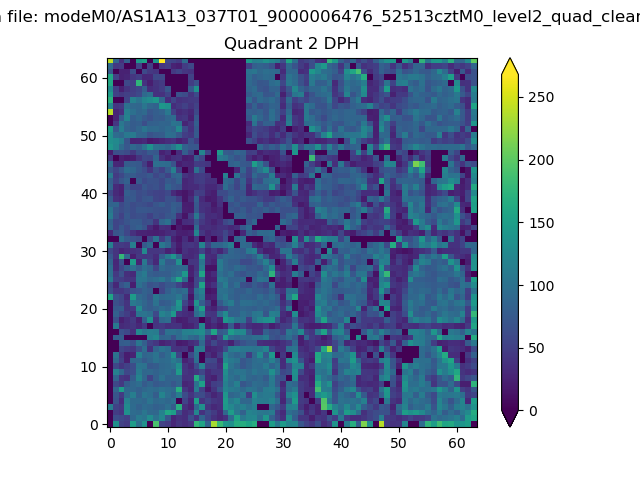
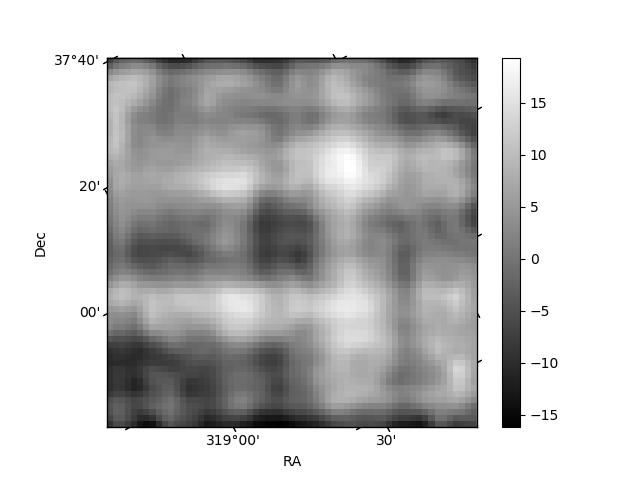
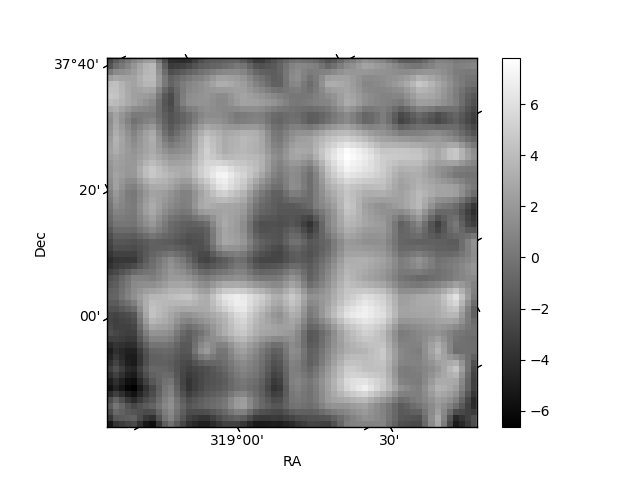
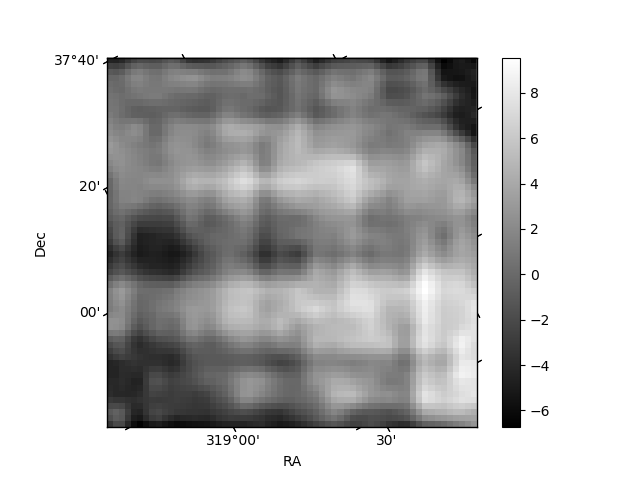
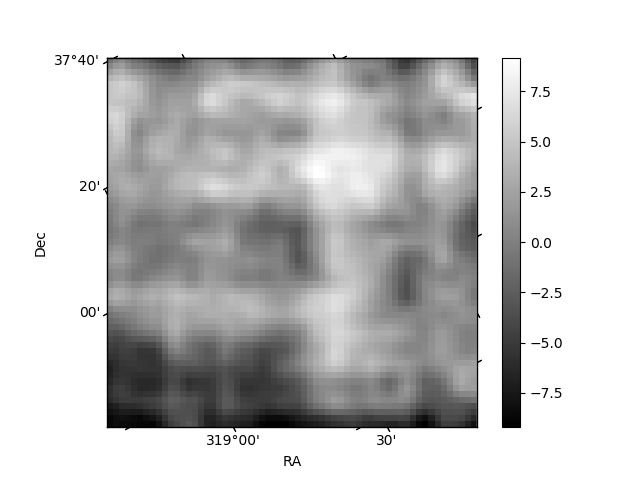
Histogram calculated using DETX and DETY for each event in the final _common_clean file
| Quadrant A | 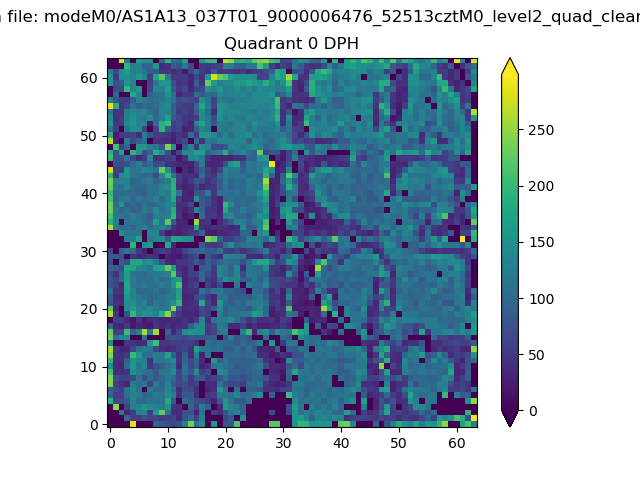 |
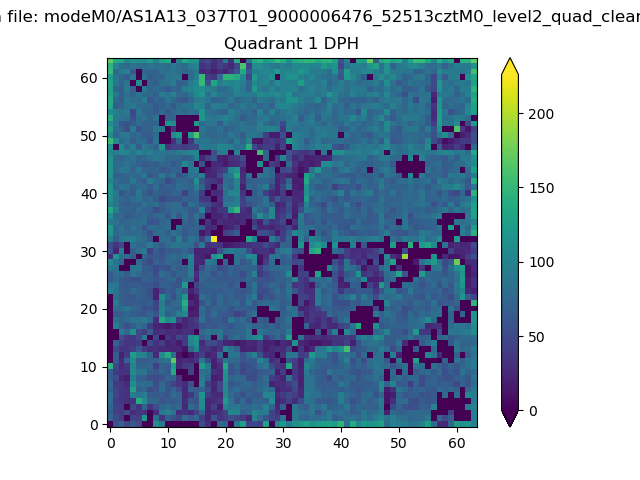 |
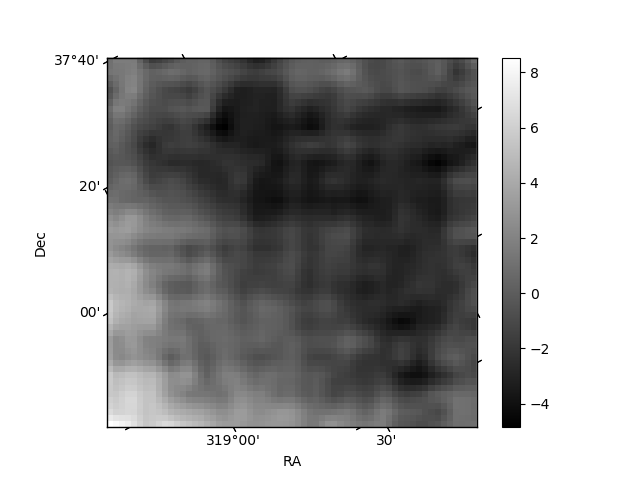
Quadrant B |
|---|---|---|---|
| Quadrant D | 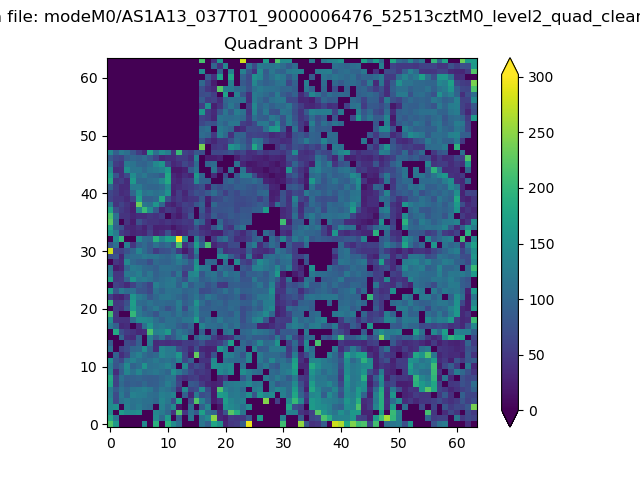 |
 |
Quadrant C |
| Plot type | Count rate plots | Images |
|---|---|---|
| Comparison with Poisson distribution Blue bars denote a histogram of data divided into 1 sec bins. Red curve is a Poisson curve with rate = median count rate of data. |
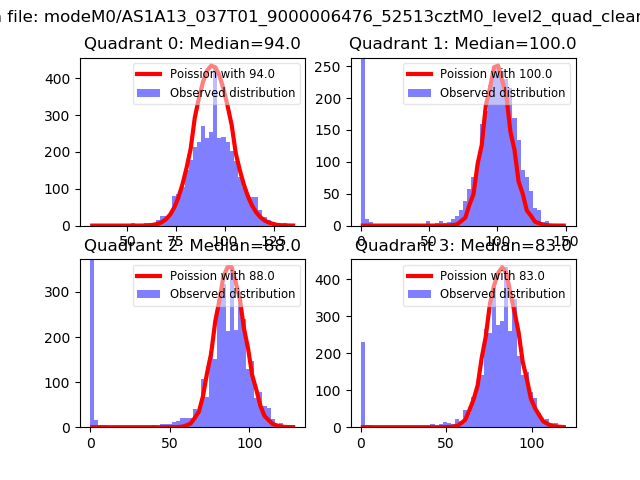 |
 |
| Quadrant-wise count rates Data is divided into 100 sec bins |
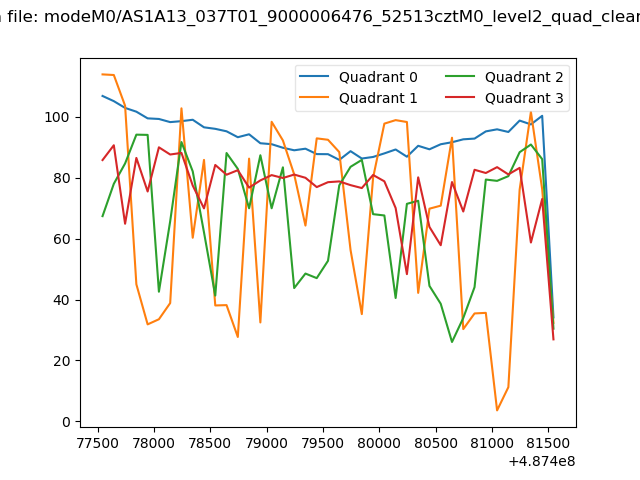 |
|
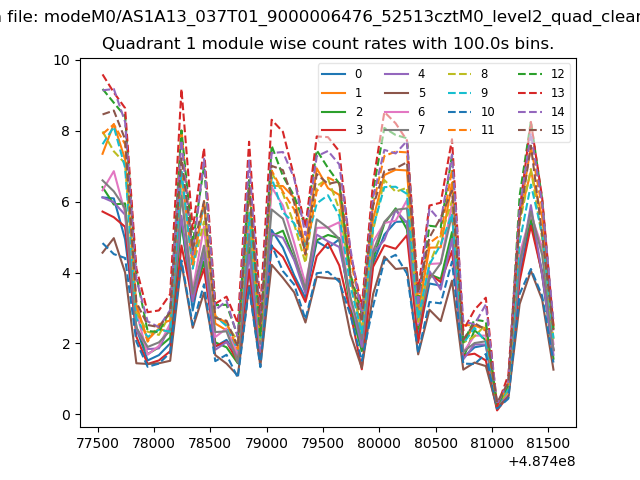
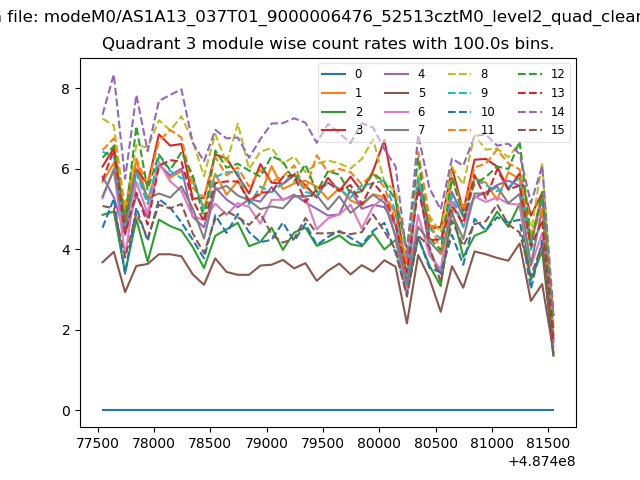
| Module-wise count rates for Quadrant A Data is divided into 100 sec bins |
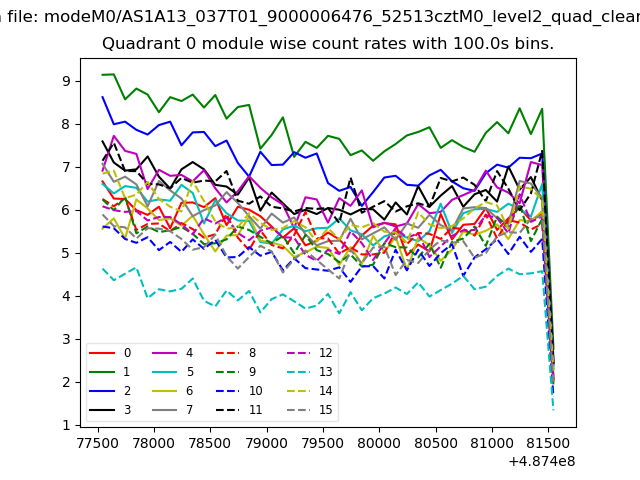 |
 |
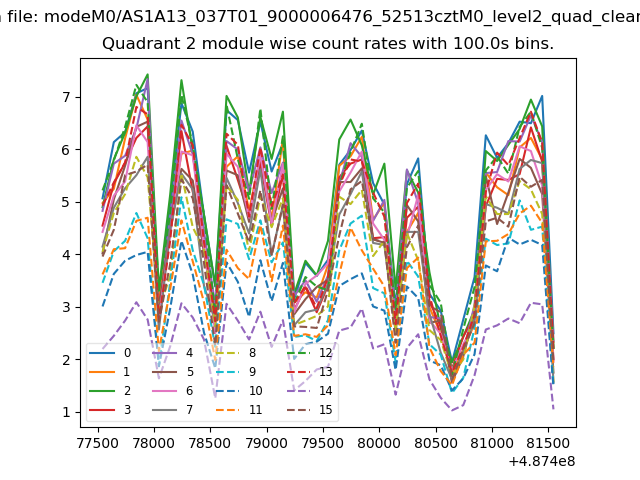
| Module-wise count rates for Quadrant B Data is divided into 100 sec bins |
 |
 |
| Module-wise count rates for Quadrant C Data is divided into 100 sec bins |
 |
 |
| Module-wise count rates for Quadrant D Data is divided into 100 sec bins |
 |
 |
| Parameter | Plot |
|---|---|
| CZT HV Monitor | 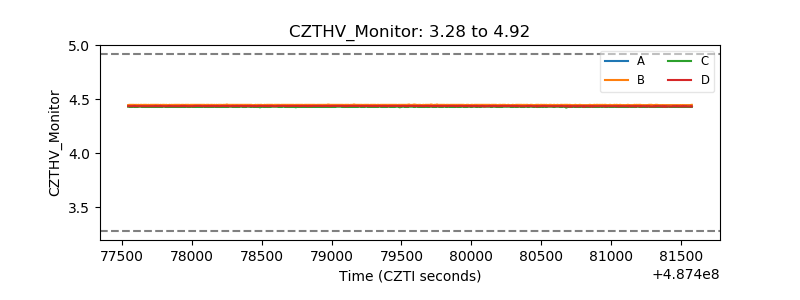 |
| D_VDD | 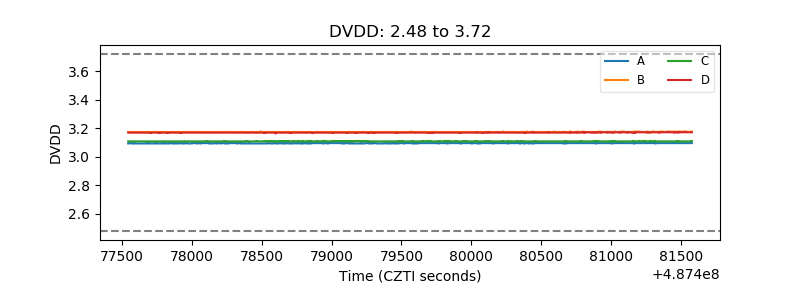 |
| Temperature 1 | 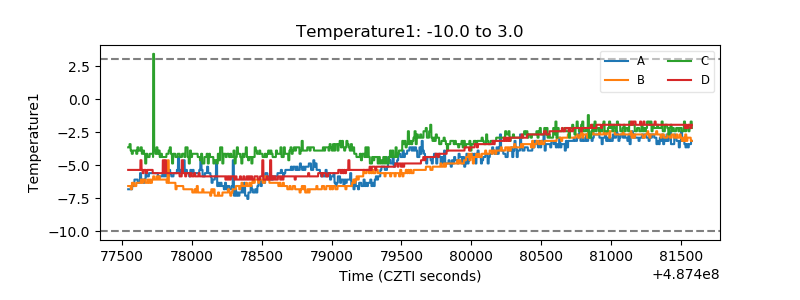 |
| Veto HV Monitor | 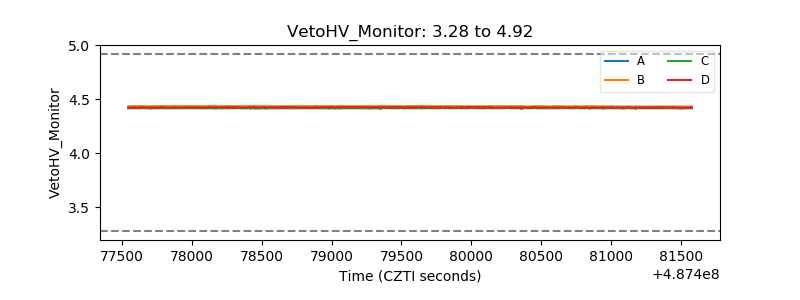 |
| Veto LLD | 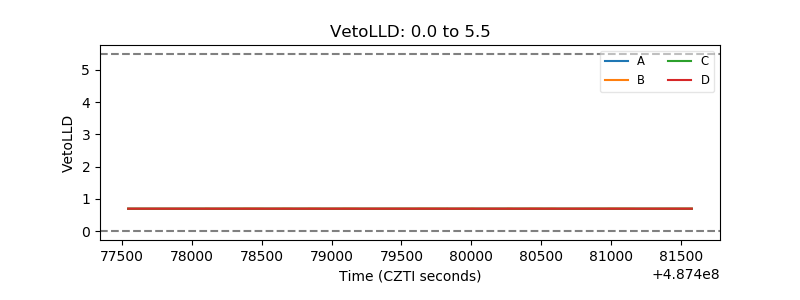 |
| Alpha Counter | 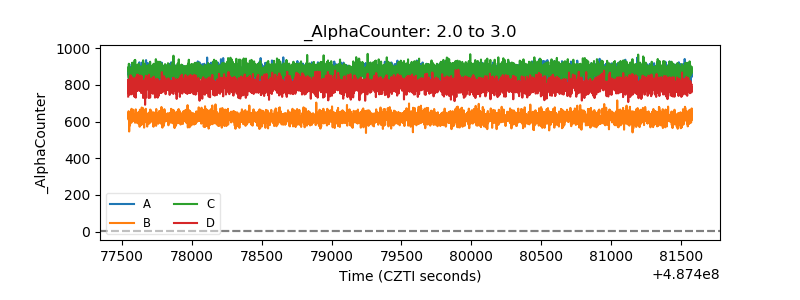 |
| _CPM_Rate | 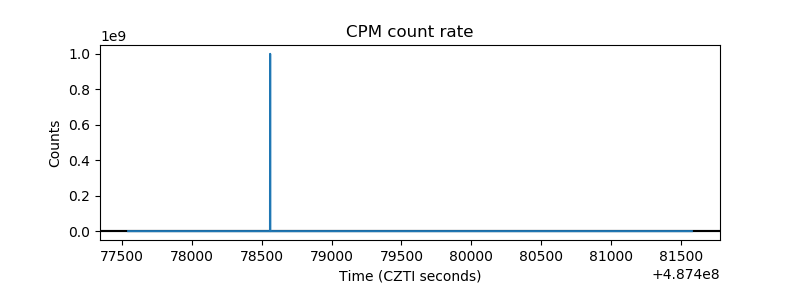 |
| CZT Counter | 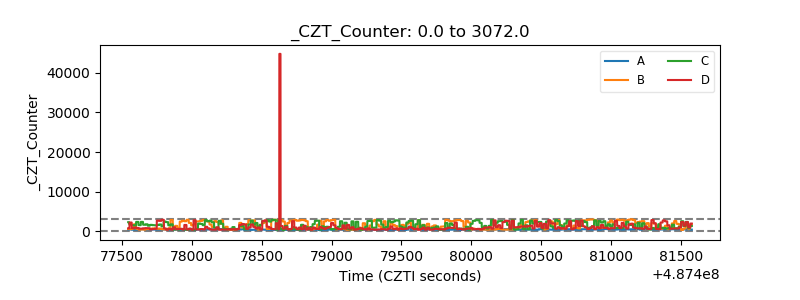 |
| +2.5 Volts monitor |  |
| +5 Volts monitor |  |
| _ROLL_ROT | 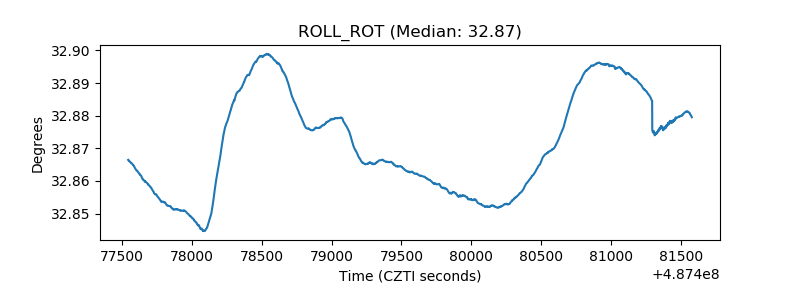 |
| _Roll_DEC | 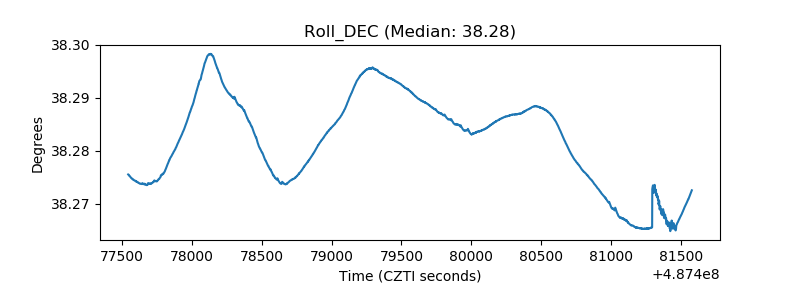 |
| _Roll_RA | 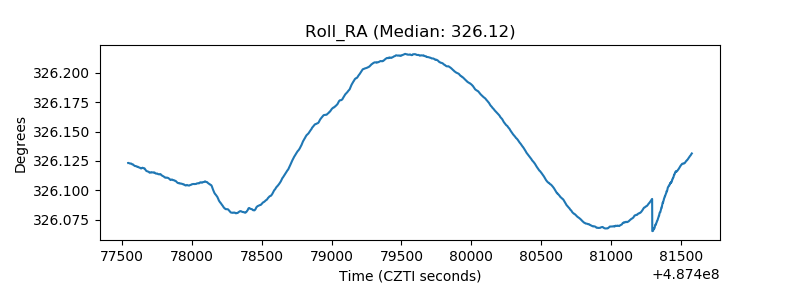 |
| Veto Counter | 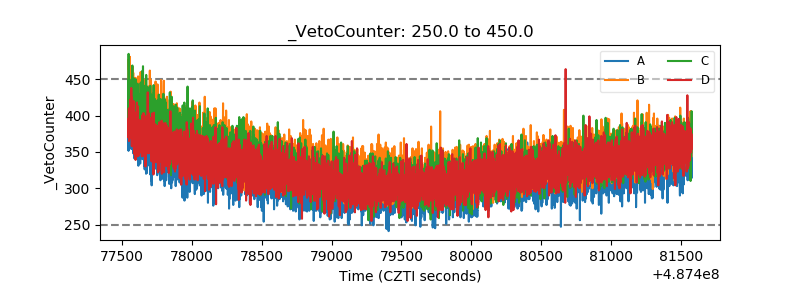 |