| Param | Original file | Final file |
|---|---|---|
| Filename | modeM0/AS1C09_011T06_9000006478_52515cztM0_level2.fits | modeM0/AS1C09_011T06_9000006478_52515cztM0_level2_quad_clean.evt |
| Size (bytes) | 853,375,680 | 79,375,680 |
| Size | 813.8 MB | 75.7 MB |
| Events in quadrant A | 3,653,025 | 663,255 |
| Events in quadrant B | 4,915,761 | 668,312 |
| Events in quadrant C | 15,230,308 | 26,191 |
| Events in quadrant D | 7,251,104 | 562,082 |
| Mode M0 | |||
|---|---|---|---|
| Quadrant | BADHDUFLAG | Total packets | Discarded packets |
| A | 0 | 16129 | 2 |
| B | 0 | 19554 | 2 |
| C | 0 | 50035 | 3 |
| D | 0 | 26407 | 2 |
| Mode SS | |||
|---|---|---|---|
| Quadrant | BADHDUFLAG | Total packets | Discarded packets |
| A | 0 | 140 | 0 |
| B | 0 | 140 | 0 |
| C | 0 | 140 | 0 |
| D | 0 | 140 | 0 |
| Quadrant | Total seconds | Saturated seconds | Saturation percentage |
|---|---|---|---|
| A | 6936 | 270 | 3.892734% |
| B | 6936 | 598 | 8.621684% |
| C | 6935 | 6660 | 96.034607% |
| D | 6935 | 779 | 11.232877% |
Noise dominated data is calculated using 1-second bins in cleaned event files. If a bin has >2000 counts, and if more than 50% of those come from <1% of pixels, then it is considered to be noise-dominated and hence unusable.
| Quadrant | # 1 sec bins | Bins with >0 counts | Bins with >2000 counts | High rate bins dominated by noise | Noise dominated (total time) | Noise dominated (detector-on time) | Marked lightcurve |
|---|---|---|---|---|---|---|---|
| A | 6976 | 6938 | 97 | 97 | 1.39% | 1.40% | 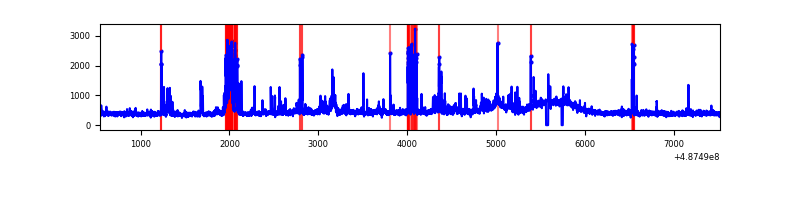 |
| B | 6976 | 6937 | 339 | 339 | 4.86% | 4.89% | 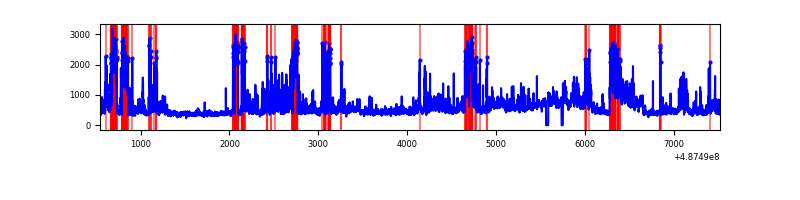 |
| C | 6974 | 6934 | 5087 | 5087 | 72.94% | 73.36% | 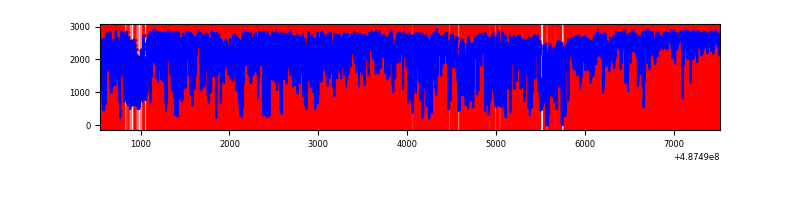 |
| D | 6975 | 6936 | 707 | 707 | 10.14% | 10.19% | 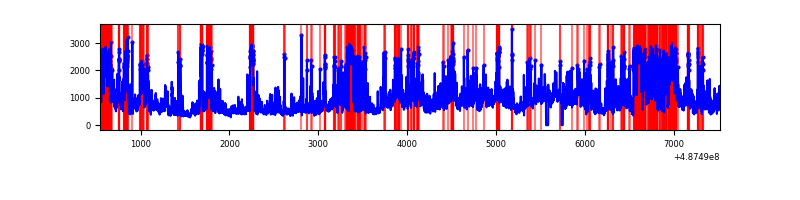 |
Top three noisy pixels from each quadrant. If the there are fewer than three noisy pixels in the level2.evt file, extra rows are filled as -1
| Pixel properties | Quadrant properties | ||||||
|---|---|---|---|---|---|---|---|
| Quadrant | DetID | PixID | Counts | Sigma | Mean | Median | Sigma |
| A | 4 | 237 | 280369 | 1523.55 | 741 | 722 | 183.5 |
| A | 8 | 249 | 180989 | 982.11 | 741 | 722 | 183.5 |
| A | 3 | 45 | 108809 | 588.87 | 741 | 722 | 183.5 |
| B | 10 | 44 | 1148398 | 7498.03 | 715 | 688 | 153.1 |
| B | 4 | 171 | 373984 | 2438.76 | 715 | 688 | 153.1 |
| B | 10 | 254 | 146292 | 951.24 | 715 | 688 | 153.1 |
| C | 15 | 233 | 7235727 | 182687.53 | 137 | 135 | 39.6 |
| C | 15 | 224 | 7088580 | 178972.3 | 137 | 135 | 39.6 |
| C | 13 | 3 | 101427 | 2557.47 | 137 | 135 | 39.6 |
| D | 6 | 42 | 2796131 | 14261.44 | 692 | 661 | 196.0 |
| D | 12 | 17 | 368785 | 1878.03 | 692 | 661 | 196.0 |
| D | 8 | 176 | 230398 | 1172.03 | 692 | 661 | 196.0 |
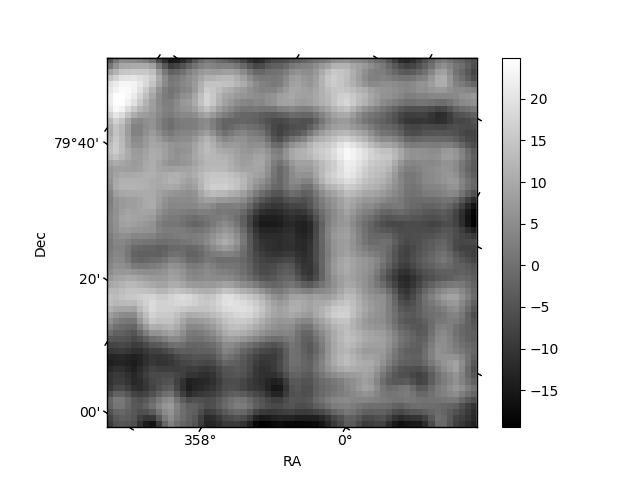
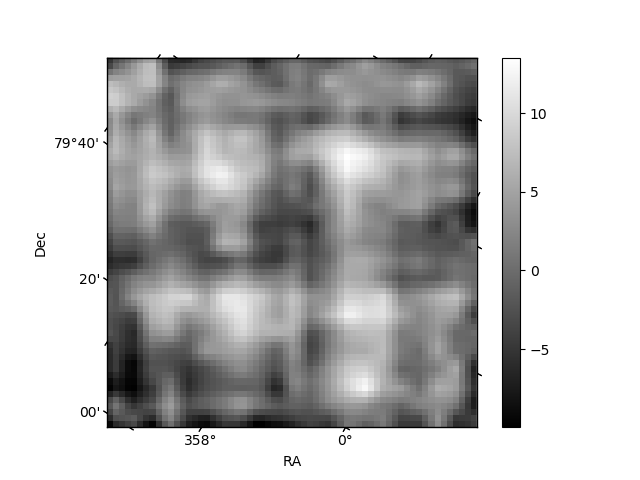
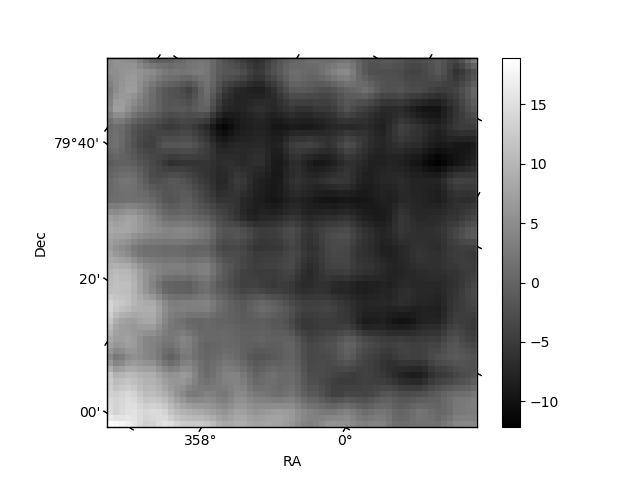
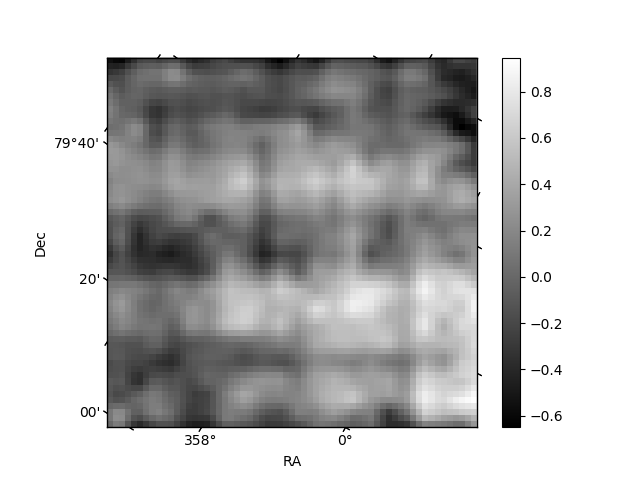
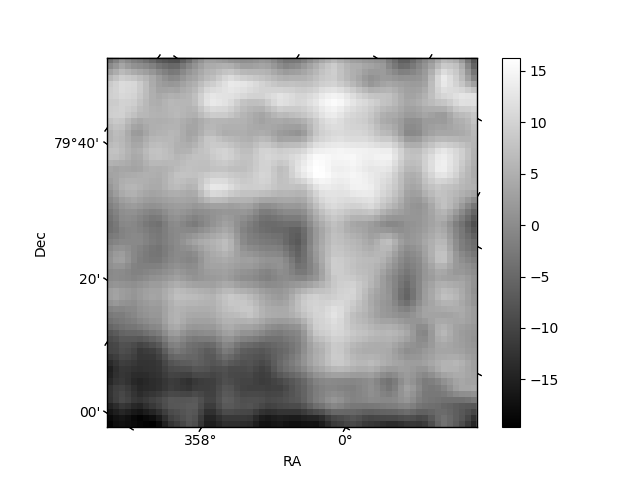
Histogram calculated using DETX and DETY for each event in the final _common_clean file
| Quadrant A | 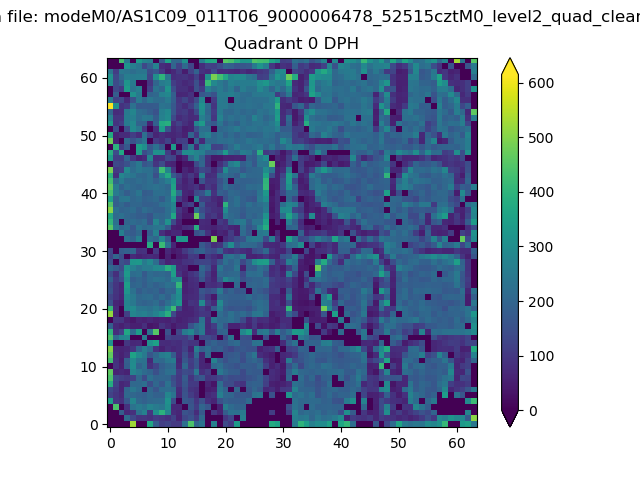 |
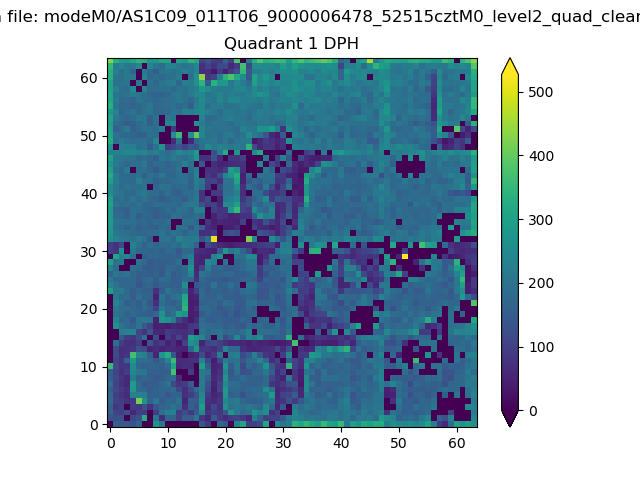 |
Quadrant B |
|---|---|---|---|
| Quadrant D | 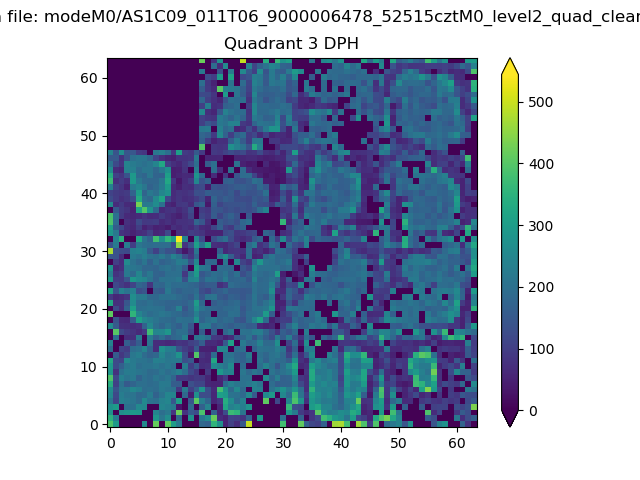 |
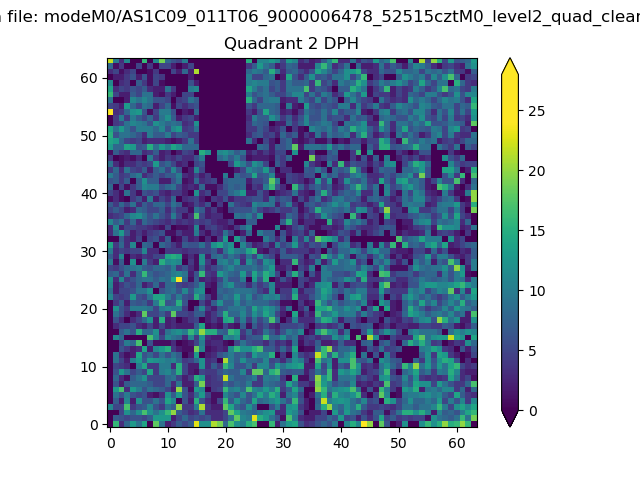 |
Quadrant C |
| Plot type | Count rate plots | Images |
|---|---|---|
| Comparison with Poisson distribution Blue bars denote a histogram of data divided into 1 sec bins. Red curve is a Poisson curve with rate = median count rate of data. |
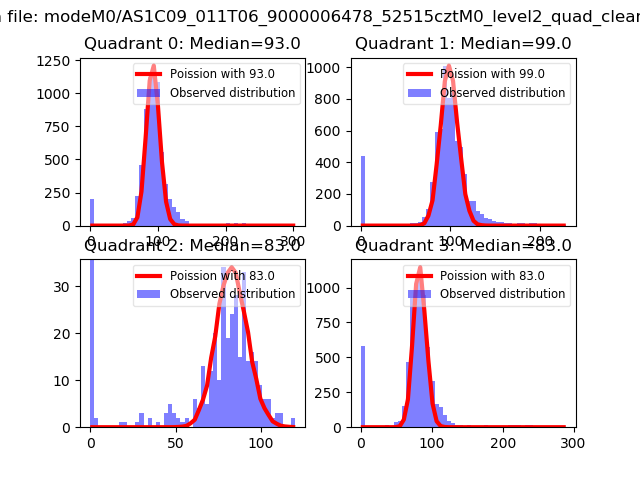 |
 |
| Quadrant-wise count rates Data is divided into 100 sec bins |
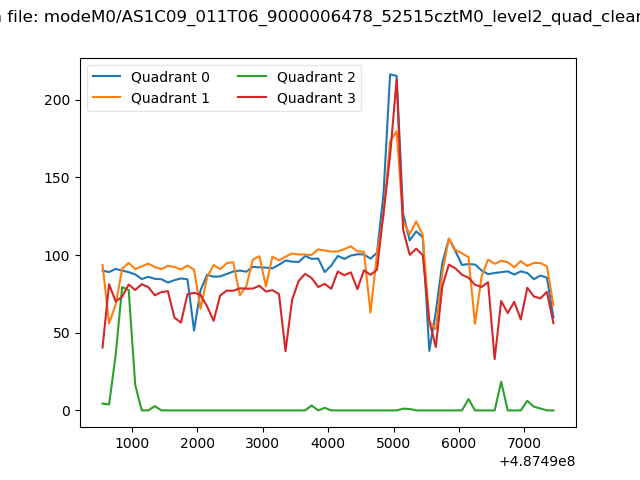 |
|
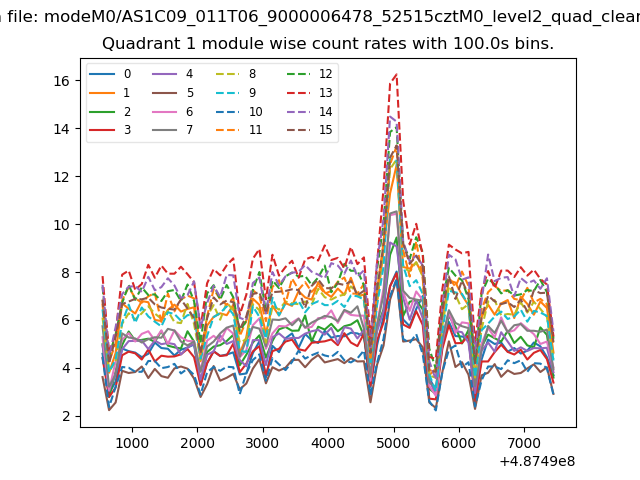
| Module-wise count rates for Quadrant A Data is divided into 100 sec bins |
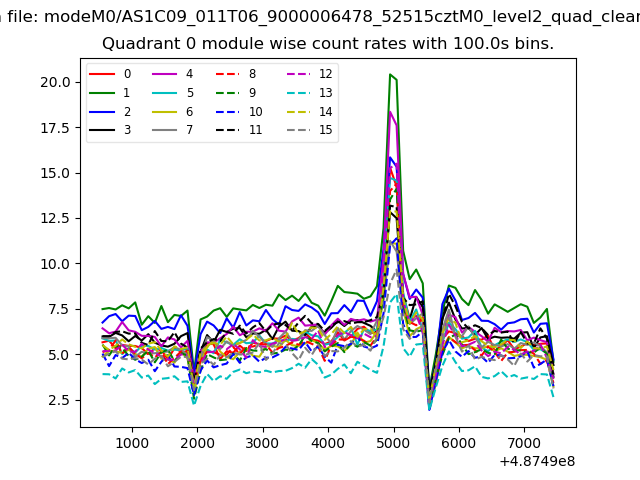 |
 |
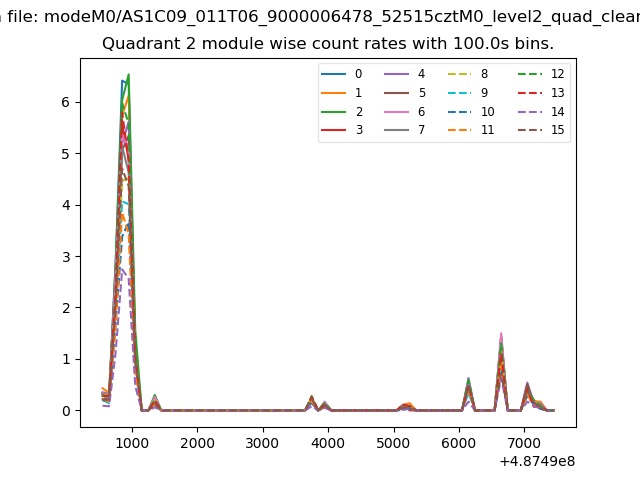
| Module-wise count rates for Quadrant B Data is divided into 100 sec bins |
 |
 |
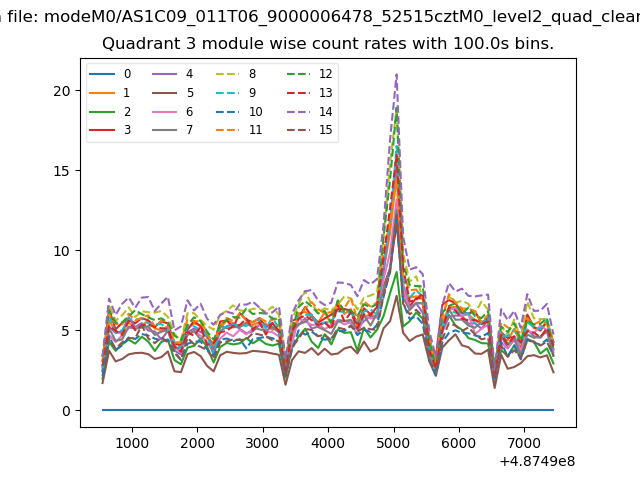
| Module-wise count rates for Quadrant C Data is divided into 100 sec bins |
 |
 |
| Module-wise count rates for Quadrant D Data is divided into 100 sec bins |
 |
 |
| Parameter | Plot |
|---|---|
| CZT HV Monitor | 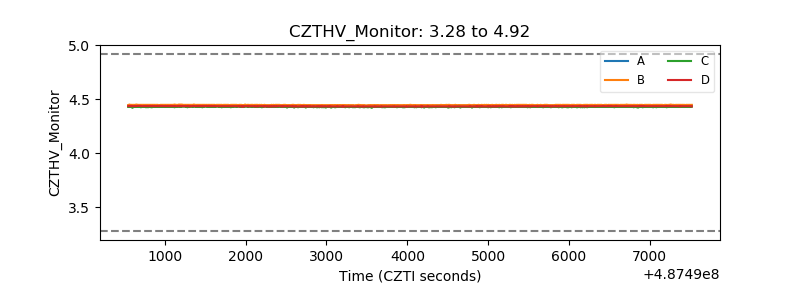 |
| D_VDD | 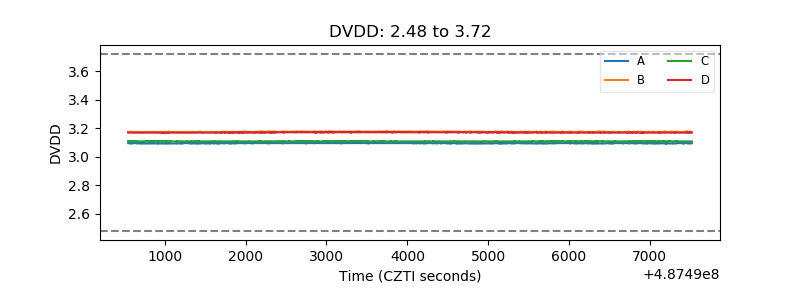 |
| Temperature 1 | 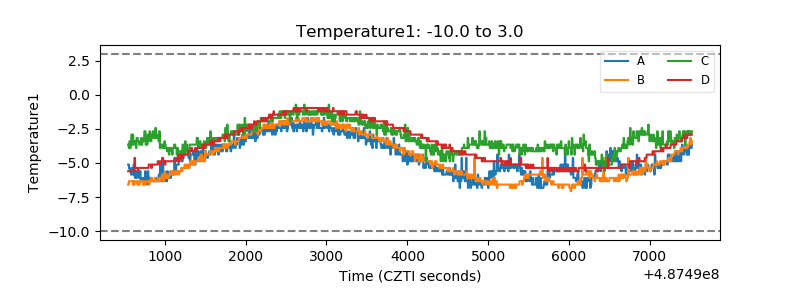 |
| Veto HV Monitor | 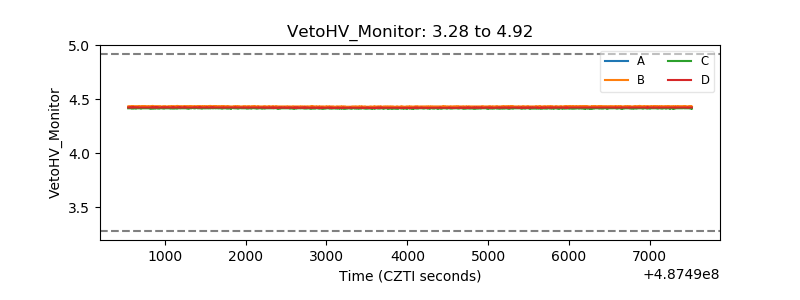 |
| Veto LLD | 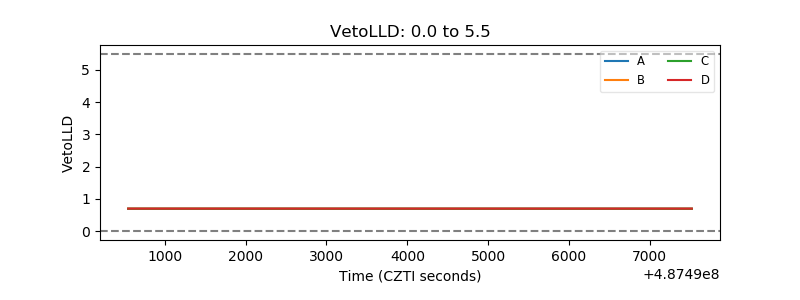 |
| Alpha Counter | 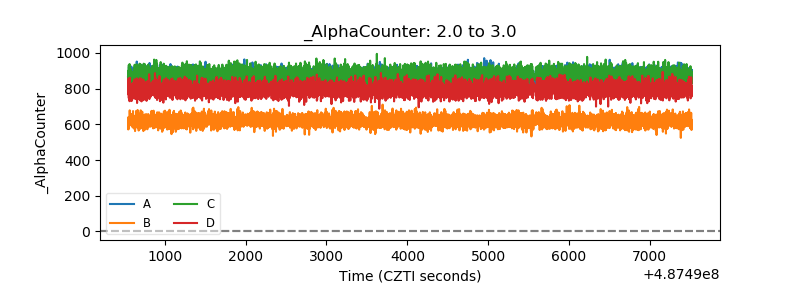 |
| _CPM_Rate | 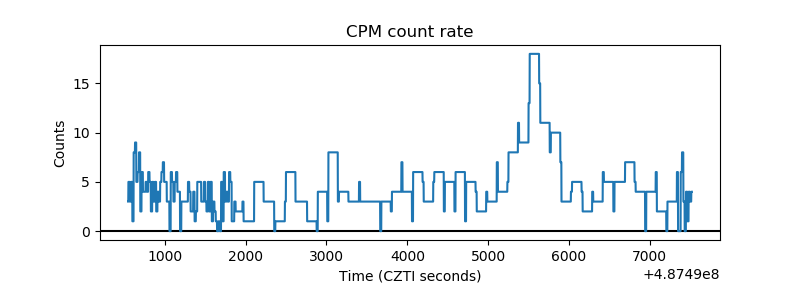 |
| CZT Counter |  |
| +2.5 Volts monitor |  |
| +5 Volts monitor |  |
| _ROLL_ROT | 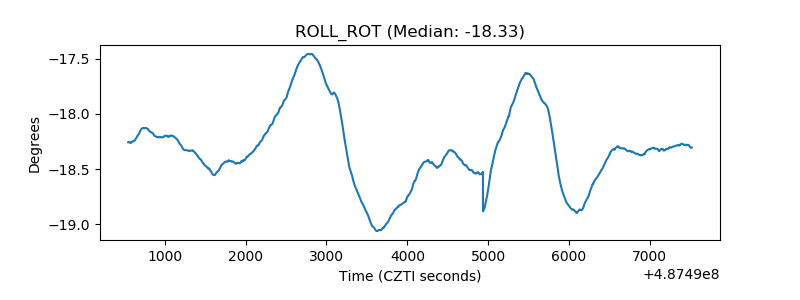 |
| _Roll_DEC | 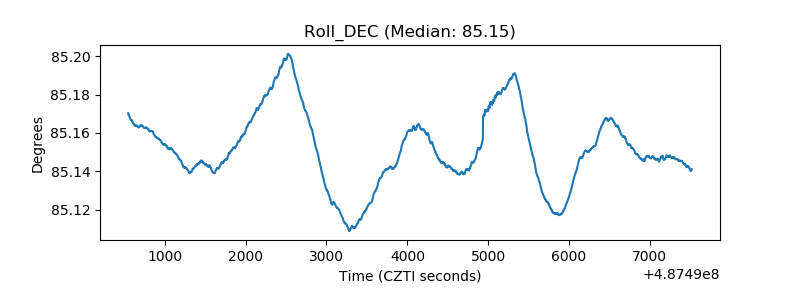 |
| _Roll_RA | 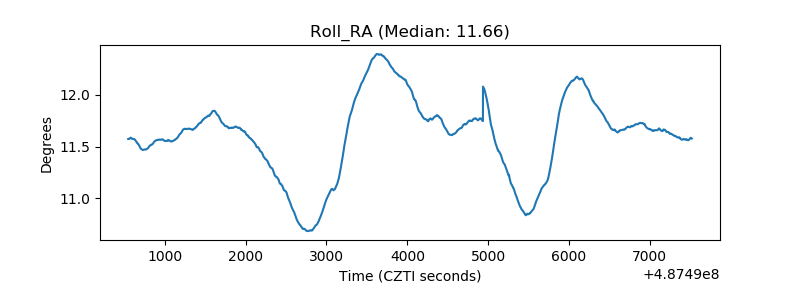 |
| Veto Counter | 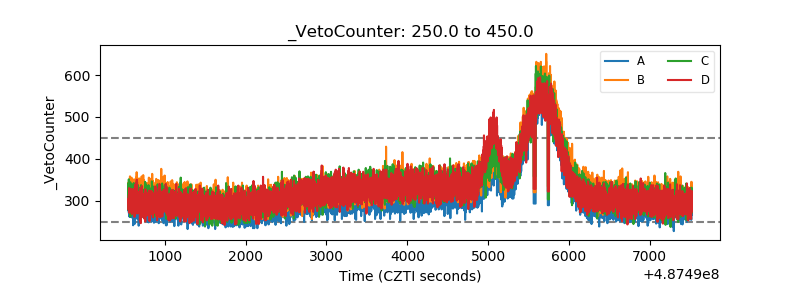 |