| Param | Original file | Final file |
|---|---|---|
| Filename | modeM0/AS1C09_011T06_9000006478_52516cztM0_level2.fits | modeM0/AS1C09_011T06_9000006478_52516cztM0_level2_quad_clean.evt |
| Size (bytes) | 908,029,440 | 84,697,920 |
| Size | 866.0 MB | 80.8 MB |
| Events in quadrant A | 3,759,129 | 683,700 |
| Events in quadrant B | 6,603,842 | 627,056 |
| Events in quadrant C | 16,704,361 | 145,581 |
| Events in quadrant D | 5,971,858 | 593,225 |
| Mode M0 | |||
|---|---|---|---|
| Quadrant | BADHDUFLAG | Total packets | Discarded packets |
| A | 0 | 16700 | 0 |
| B | 0 | 24789 | 0 |
| C | 0 | 54733 | 0 |
| D | 0 | 22849 | 1 |
| Mode SS | |||
|---|---|---|---|
| Quadrant | BADHDUFLAG | Total packets | Discarded packets |
| A | 0 | 148 | 0 |
| B | 0 | 148 | 0 |
| C | 0 | 148 | 0 |
| D | 0 | 148 | 0 |
| Quadrant | Total seconds | Saturated seconds | Saturation percentage |
|---|---|---|---|
| A | 7394 | 94 | 1.271301% |
| B | 7394 | 1056 | 14.281850% |
| C | 7394 | 5942 | 80.362456% |
| D | 7393 | 361 | 4.882997% |
Noise dominated data is calculated using 1-second bins in cleaned event files. If a bin has >2000 counts, and if more than 50% of those come from <1% of pixels, then it is considered to be noise-dominated and hence unusable.
| Quadrant | # 1 sec bins | Bins with >0 counts | Bins with >2000 counts | High rate bins dominated by noise | Noise dominated (total time) | Noise dominated (detector-on time) | Marked lightcurve |
|---|---|---|---|---|---|---|---|
| A | 7394 | 7394 | 97 | 97 | 1.31% | 1.31% | 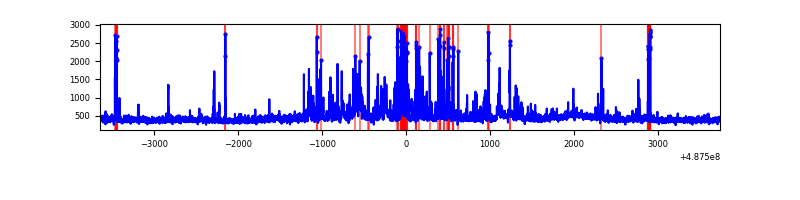 |
| B | 7394 | 7394 | 870 | 870 | 11.77% | 11.77% | 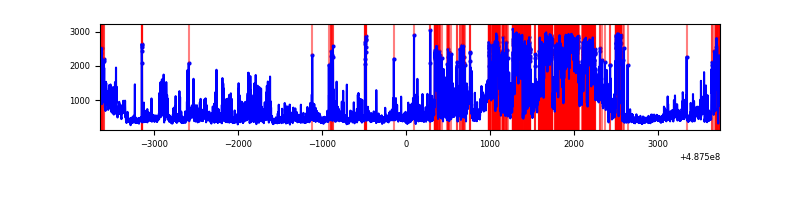 |
| C | 7394 | 7394 | 5801 | 5801 | 78.46% | 78.46% | 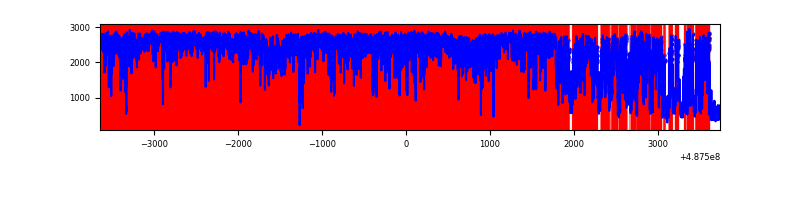 |
| D | 7393 | 7393 | 439 | 439 | 5.94% | 5.94% | 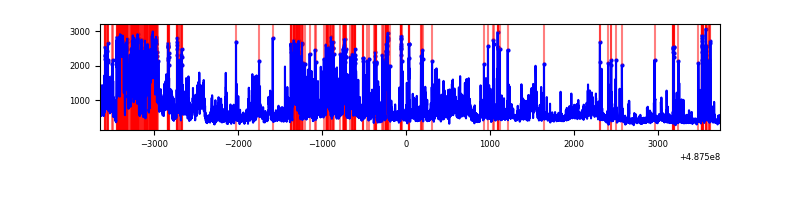 |
Top three noisy pixels from each quadrant. If the there are fewer than three noisy pixels in the level2.evt file, extra rows are filled as -1
| Pixel properties | Quadrant properties | ||||||
|---|---|---|---|---|---|---|---|
| Quadrant | DetID | PixID | Counts | Sigma | Mean | Median | Sigma |
| A | 3 | 62 | 311383 | 1676.35 | 747 | 730 | 185.3 |
| A | 8 | 249 | 214850 | 1155.44 | 747 | 730 | 185.3 |
| A | 15 | 174 | 99688 | 534.0 | 747 | 730 | 185.3 |
| B | 10 | 44 | 2349919 | 16095.72 | 686 | 663 | 146.0 |
| B | 7 | 0 | 672054 | 4599.98 | 686 | 663 | 146.0 |
| B | 4 | 171 | 378935 | 2591.7 | 686 | 663 | 146.0 |
| C | 15 | 233 | 11601655 | 123793.12 | 337 | 333 | 93.7 |
| C | 15 | 224 | 2534385 | 27039.87 | 337 | 333 | 93.7 |
| C | 4 | 5 | 261936 | 2791.46 | 337 | 333 | 93.7 |
| D | 6 | 42 | 1244498 | 6141.63 | 710 | 679 | 202.5 |
| D | 11 | 176 | 448002 | 2208.76 | 710 | 679 | 202.5 |
| D | 8 | 176 | 442480 | 2181.49 | 710 | 679 | 202.5 |
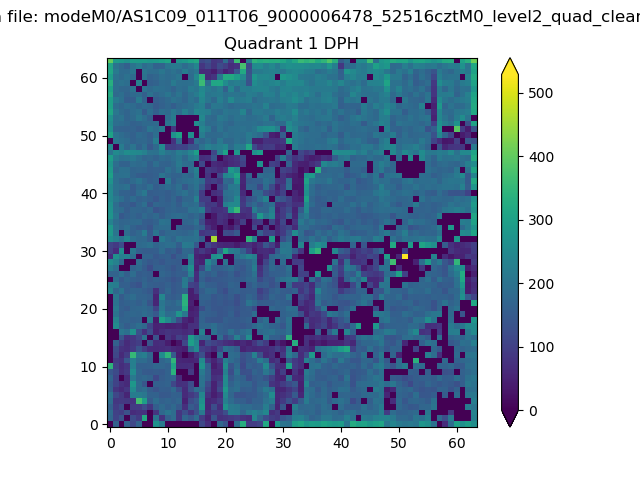
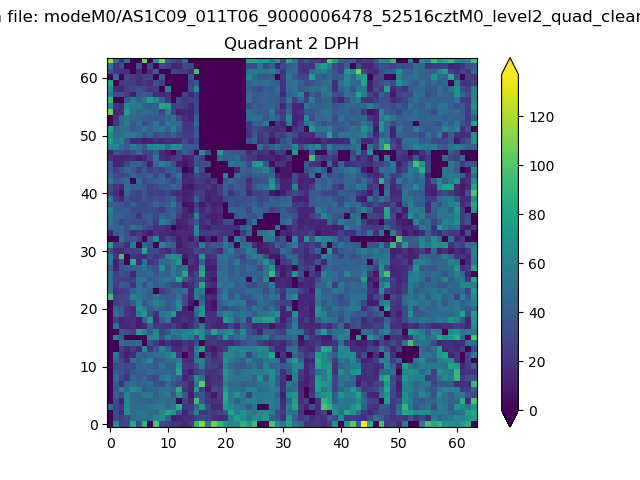
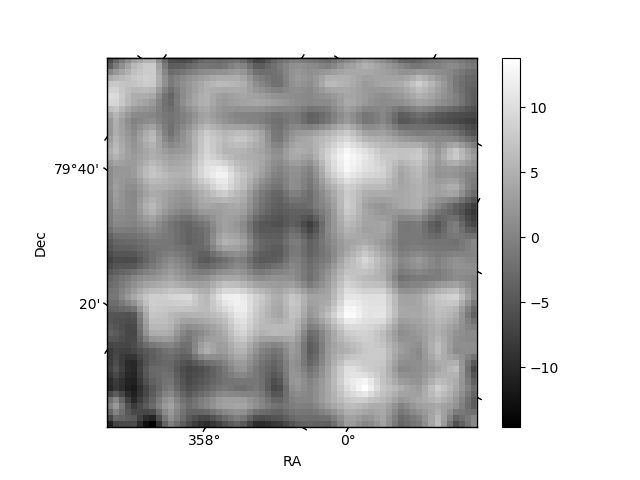
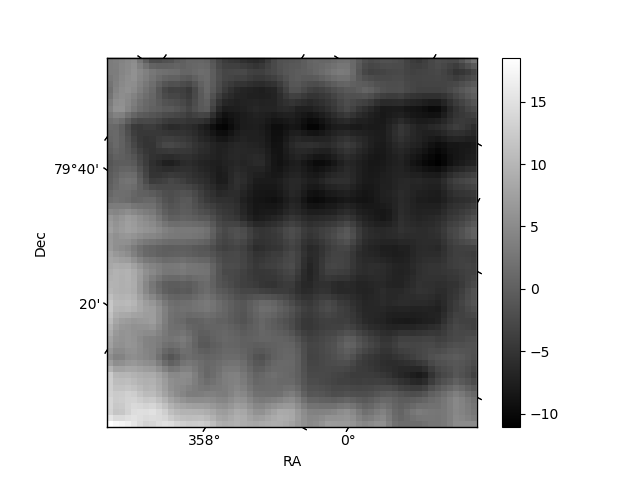
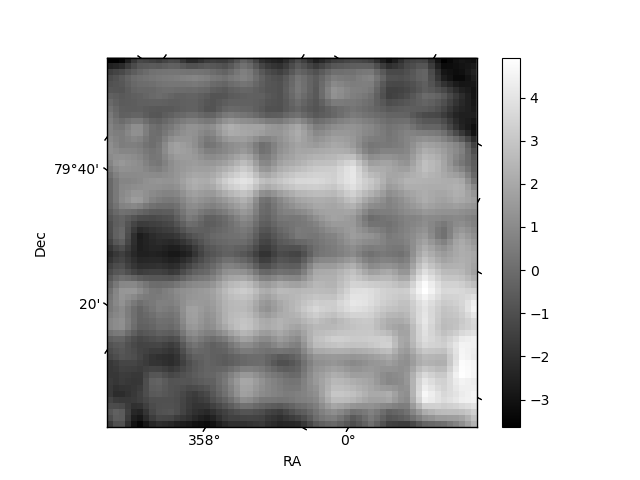
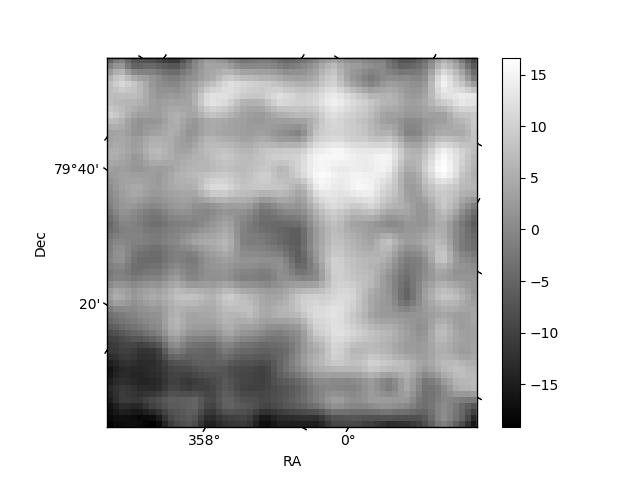
Histogram calculated using DETX and DETY for each event in the final _common_clean file
| Quadrant A |  |
 |
Quadrant B |
|---|---|---|---|
| Quadrant D | 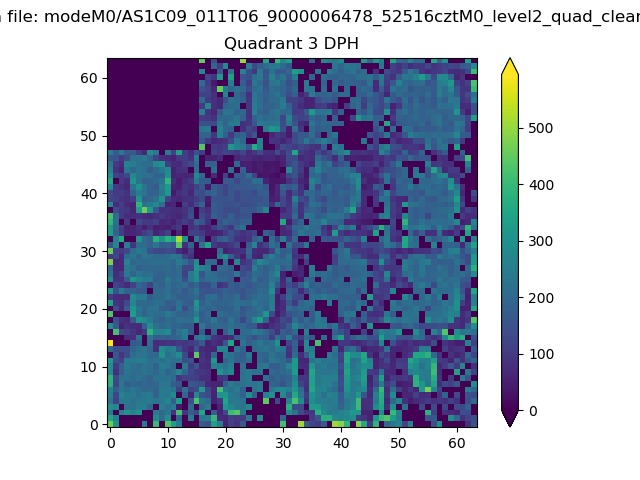 |
 |
Quadrant C |
| Plot type | Count rate plots | Images |
|---|---|---|
| Comparison with Poisson distribution Blue bars denote a histogram of data divided into 1 sec bins. Red curve is a Poisson curve with rate = median count rate of data. |
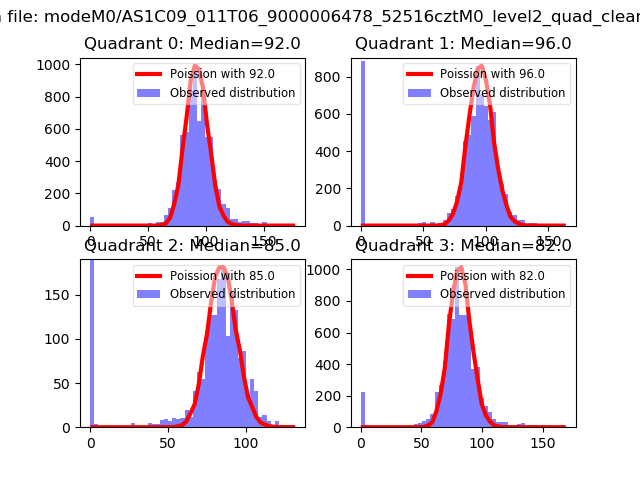 |
 |
| Quadrant-wise count rates Data is divided into 100 sec bins |
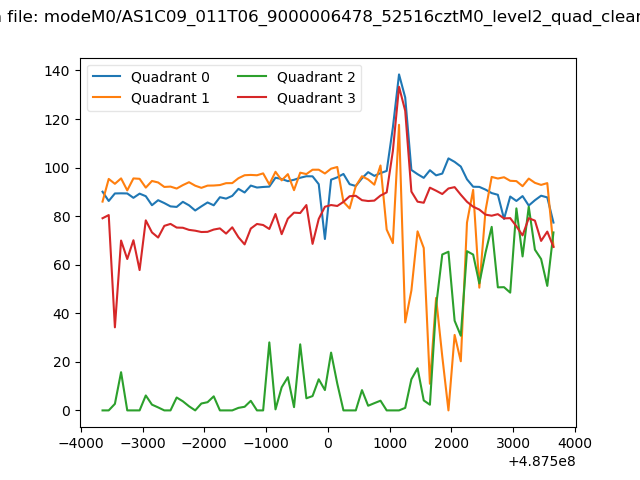 |
|
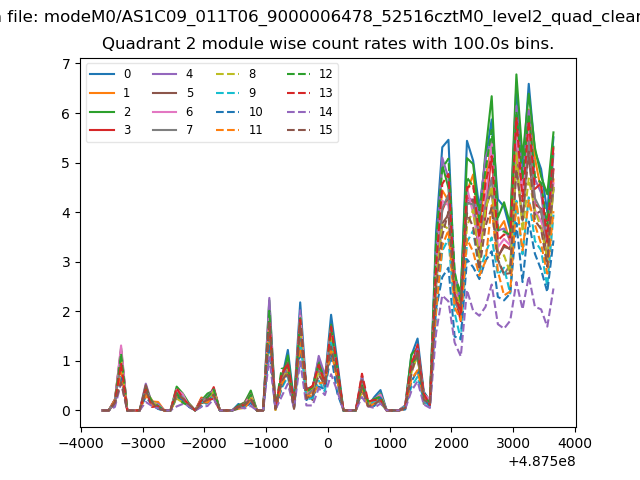
| Module-wise count rates for Quadrant A Data is divided into 100 sec bins |
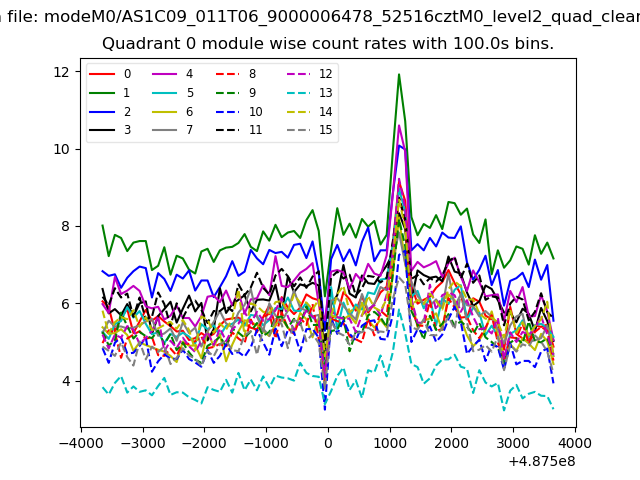 |
 |
| Module-wise count rates for Quadrant B Data is divided into 100 sec bins |
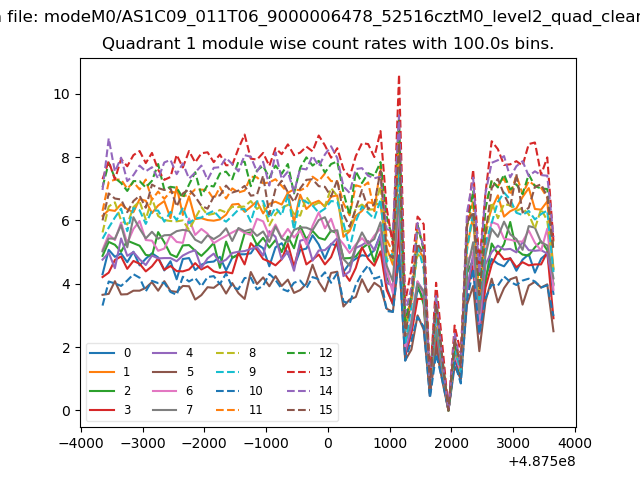 |
 |
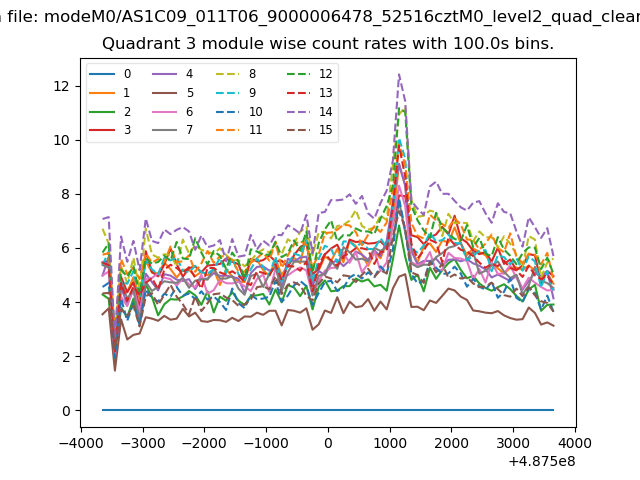
| Module-wise count rates for Quadrant C Data is divided into 100 sec bins |
 |
 |
| Module-wise count rates for Quadrant D Data is divided into 100 sec bins |
 |
 |
| Parameter | Plot |
|---|---|
| CZT HV Monitor | 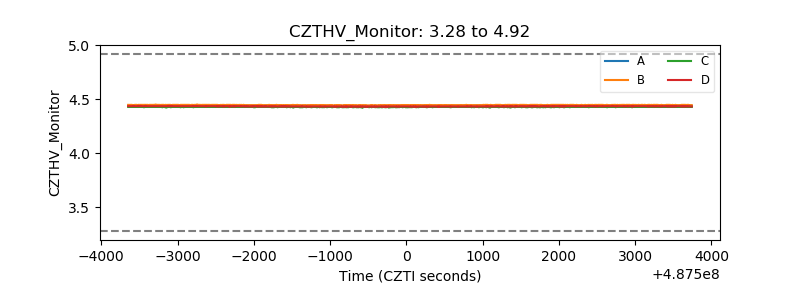 |
| D_VDD | 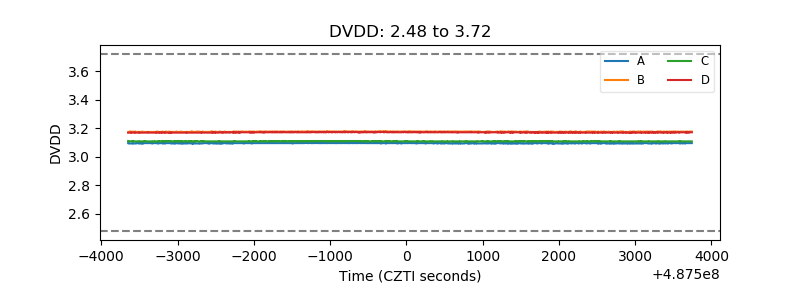 |
| Temperature 1 | 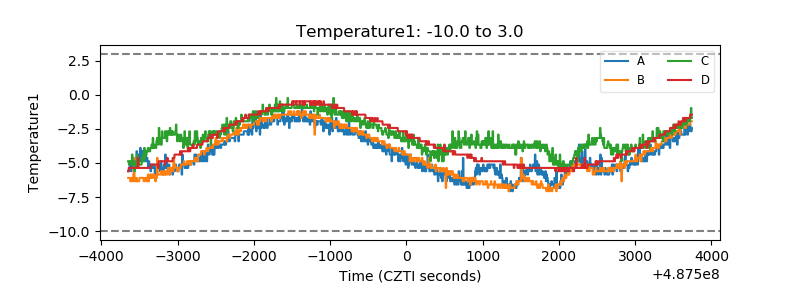 |
| Veto HV Monitor |  |
| Veto LLD | 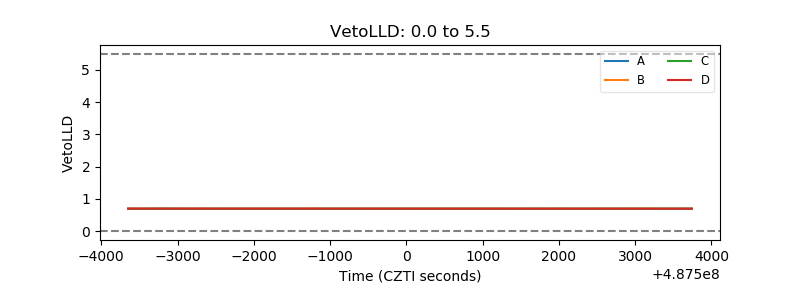 |
| Alpha Counter | 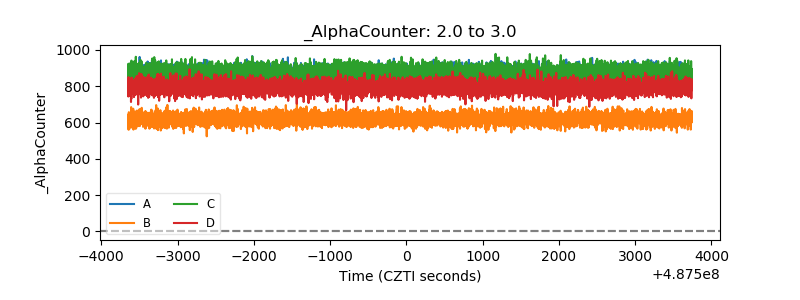 |
| _CPM_Rate | 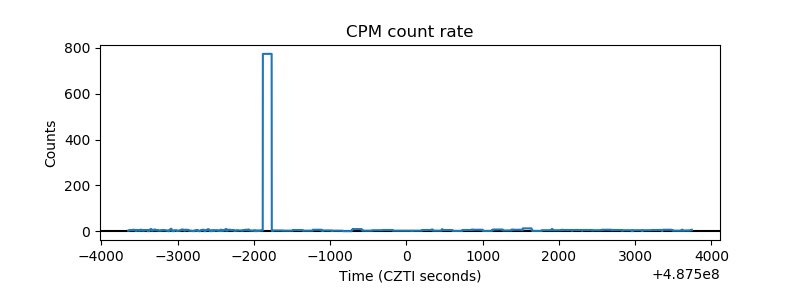 |
| CZT Counter | 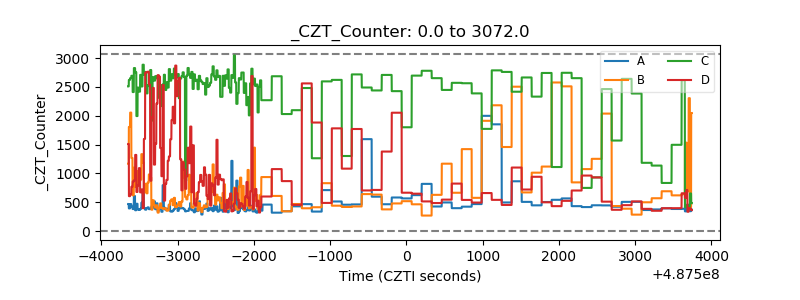 |
| +2.5 Volts monitor |  |
| +5 Volts monitor |  |
| _ROLL_ROT | 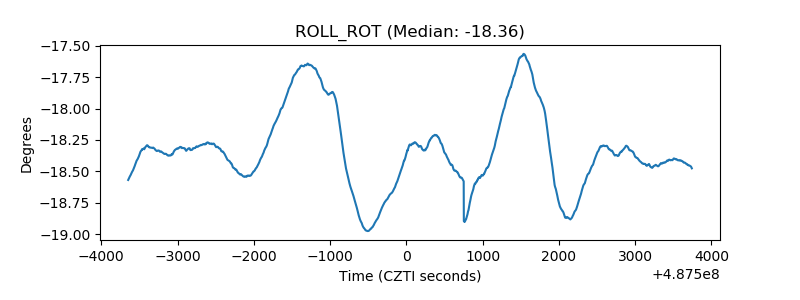 |
| _Roll_DEC | 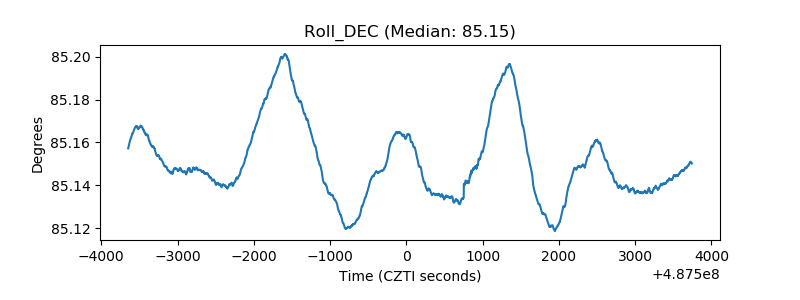 |
| _Roll_RA | 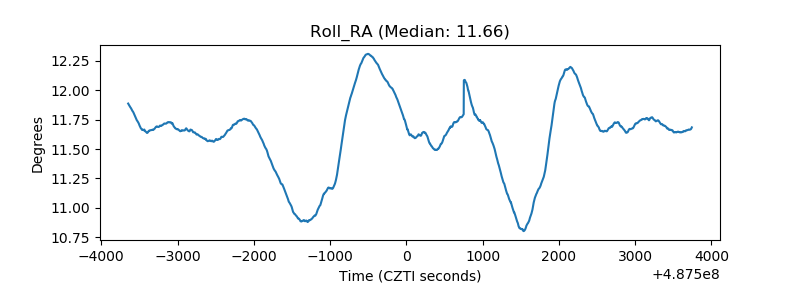 |
| Veto Counter | 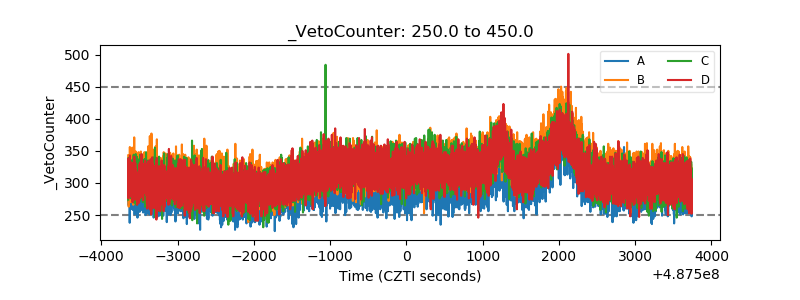 |