| Param | Original file | Final file |
|---|---|---|
| Filename | modeM0/AS1C09_011T06_9000006478_52517cztM0_level2.fits | modeM0/AS1C09_011T06_9000006478_52517cztM0_level2_quad_clean.evt |
| Size (bytes) | 706,527,360 | 96,557,760 |
| Size | 673.8 MB | 92.1 MB |
| Events in quadrant A | 4,233,819 | 658,098 |
| Events in quadrant B | 5,031,645 | 697,956 |
| Events in quadrant C | 10,019,556 | 492,799 |
| Events in quadrant D | 6,299,064 | 562,650 |
| Mode M0 | |||
|---|---|---|---|
| Quadrant | BADHDUFLAG | Total packets | Discarded packets |
| A | 0 | 17956 | 0 |
| B | 0 | 20050 | 0 |
| C | 0 | 34893 | 0 |
| D | 0 | 23868 | 0 |
| Mode SS | |||
|---|---|---|---|
| Quadrant | BADHDUFLAG | Total packets | Discarded packets |
| A | 0 | 148 | 0 |
| B | 0 | 148 | 0 |
| C | 0 | 148 | 0 |
| D | 0 | 148 | 0 |
| Quadrant | Total seconds | Saturated seconds | Saturation percentage |
|---|---|---|---|
| A | 7350 | 260 | 3.537415% |
| B | 7351 | 292 | 3.972249% |
| C | 7351 | 1963 | 26.703850% |
| D | 7351 | 593 | 8.066930% |
Noise dominated data is calculated using 1-second bins in cleaned event files. If a bin has >2000 counts, and if more than 50% of those come from <1% of pixels, then it is considered to be noise-dominated and hence unusable.
| Quadrant | # 1 sec bins | Bins with >0 counts | Bins with >2000 counts | High rate bins dominated by noise | Noise dominated (total time) | Noise dominated (detector-on time) | Marked lightcurve |
|---|---|---|---|---|---|---|---|
| A | 7350 | 7350 | 258 | 258 | 3.51% | 3.51% | 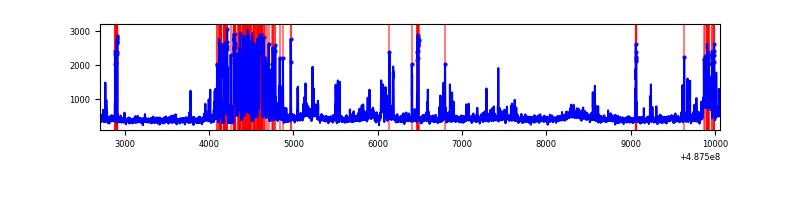 |
| B | 7351 | 7351 | 221 | 221 | 3.01% | 3.01% | 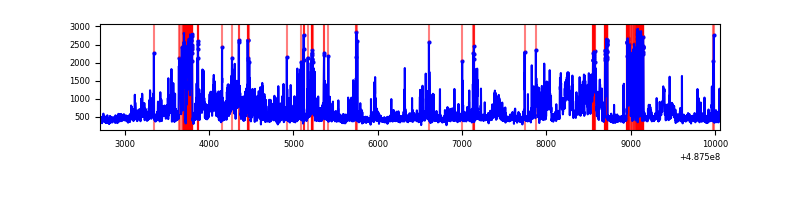 |
| C | 7350 | 7350 | 2075 | 2075 | 28.23% | 28.23% | 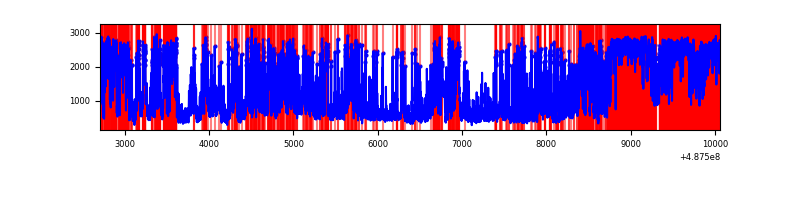 |
| D | 7351 | 7351 | 623 | 623 | 8.48% | 8.48% | 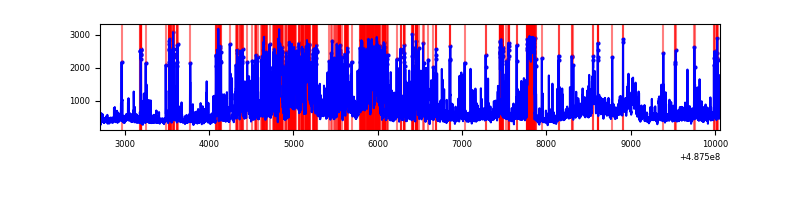 |
Top three noisy pixels from each quadrant. If the there are fewer than three noisy pixels in the level2.evt file, extra rows are filled as -1
| Pixel properties | Quadrant properties | ||||||
|---|---|---|---|---|---|---|---|
| Quadrant | DetID | PixID | Counts | Sigma | Mean | Median | Sigma |
| A | 3 | 62 | 458907 | 2464.15 | 741 | 721 | 185.9 |
| A | 15 | 174 | 219208 | 1175.03 | 741 | 721 | 185.9 |
| A | 5 | 243 | 175568 | 940.33 | 741 | 721 | 185.9 |
| B | 10 | 44 | 683551 | 4334.6 | 733 | 707 | 157.5 |
| B | 10 | 254 | 371680 | 2354.88 | 733 | 707 | 157.5 |
| B | 4 | 171 | 283818 | 1797.15 | 733 | 707 | 157.5 |
| C | 15 | 224 | 2507330 | 14301.94 | 634 | 629 | 175.3 |
| C | 15 | 233 | 2274030 | 12970.85 | 634 | 629 | 175.3 |
| C | 2 | 12 | 633052 | 3608.28 | 634 | 629 | 175.3 |
| D | 8 | 176 | 1006579 | 5018.04 | 698 | 664 | 200.5 |
| D | 15 | 93 | 329464 | 1640.23 | 698 | 664 | 200.5 |
| D | 2 | 153 | 325437 | 1620.14 | 698 | 664 | 200.5 |
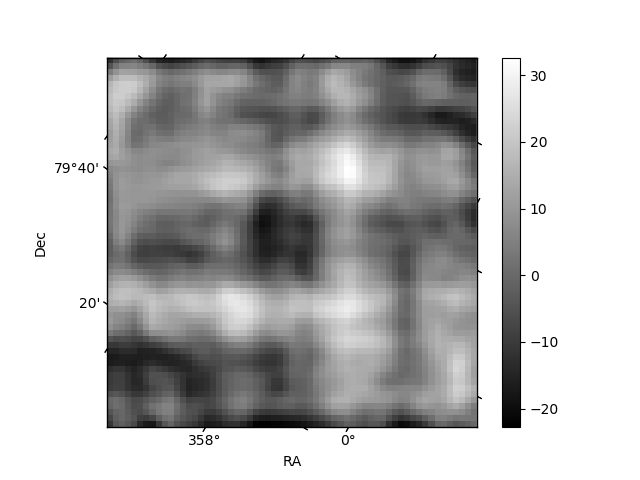
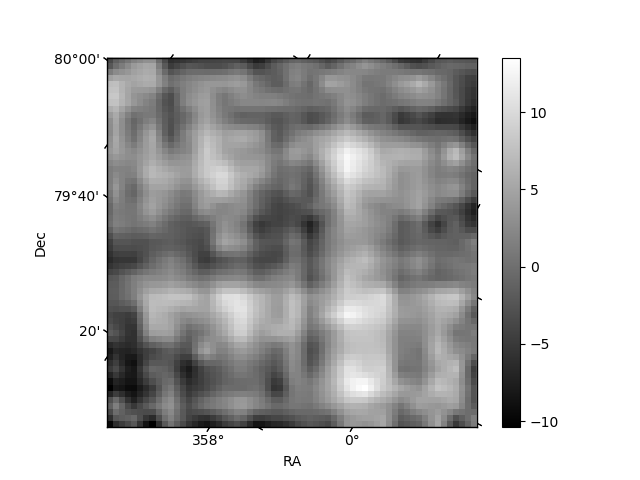
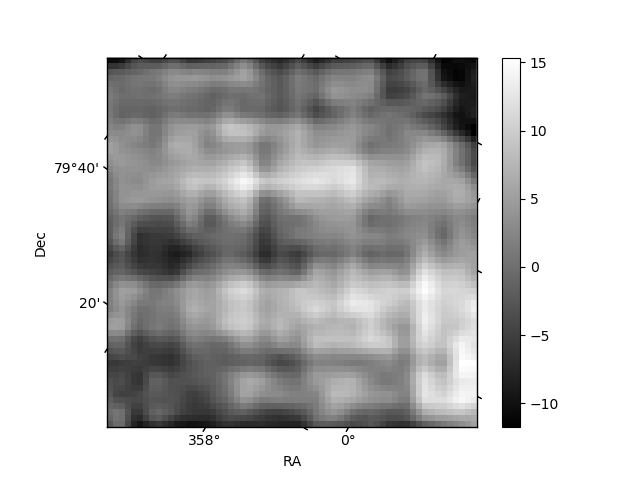
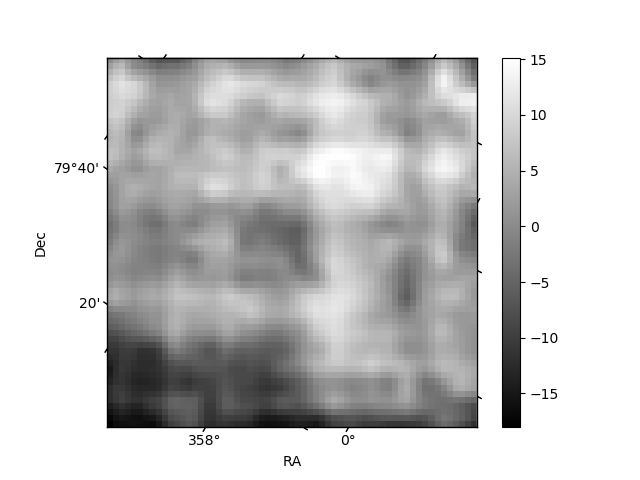
Histogram calculated using DETX and DETY for each event in the final _common_clean file
| Quadrant A | 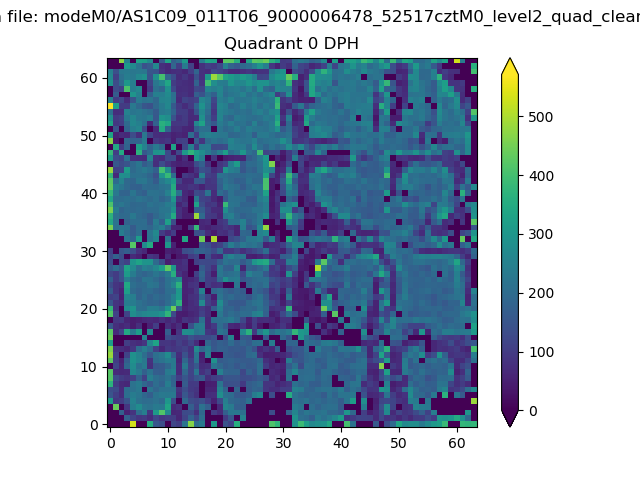 |
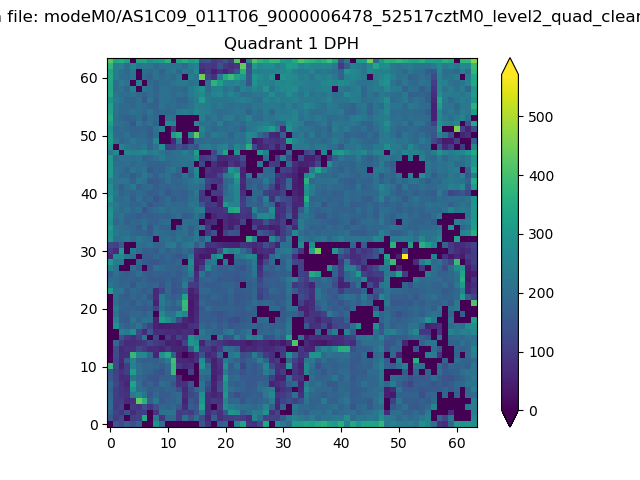 |
Quadrant B |
|---|---|---|---|
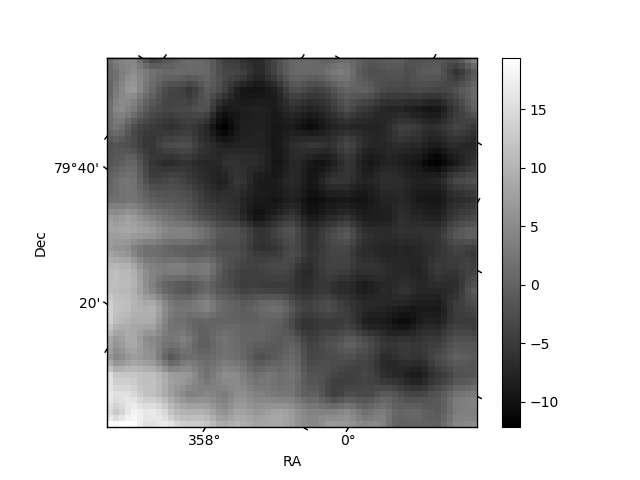
| Quadrant D | 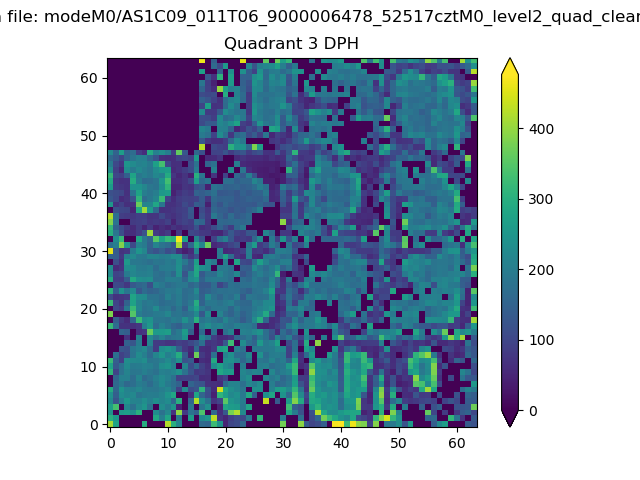 |
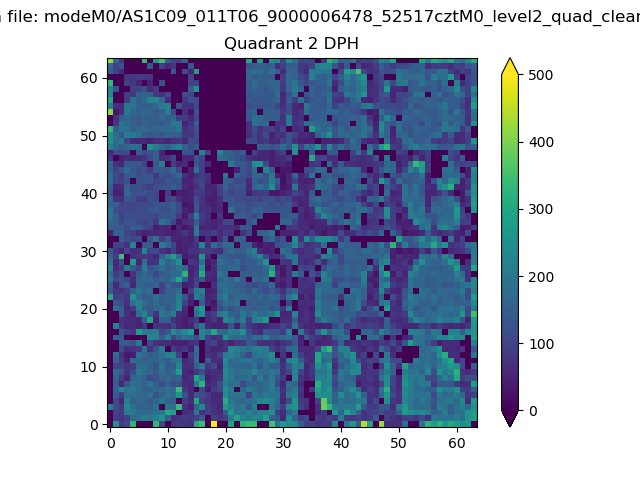 |
Quadrant C |
| Plot type | Count rate plots | Images |
|---|---|---|
| Comparison with Poisson distribution Blue bars denote a histogram of data divided into 1 sec bins. Red curve is a Poisson curve with rate = median count rate of data. |
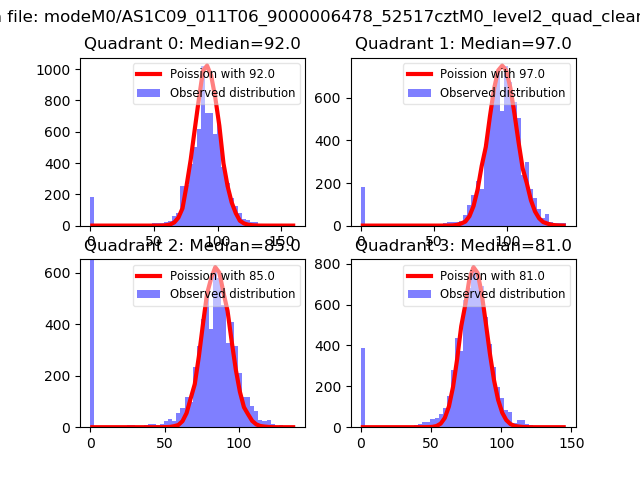 |
 |
| Quadrant-wise count rates Data is divided into 100 sec bins |
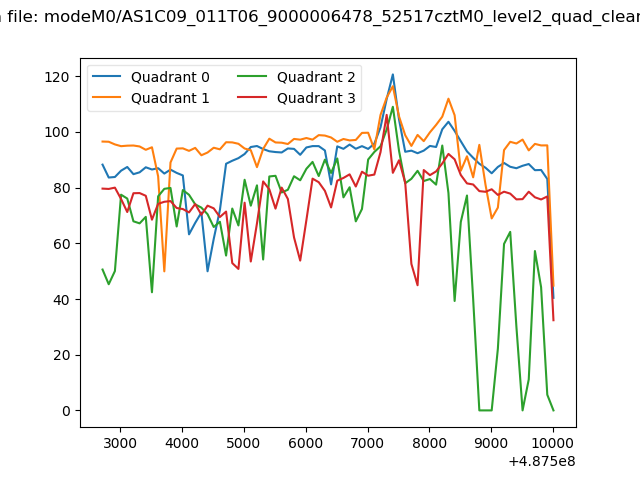 |
|
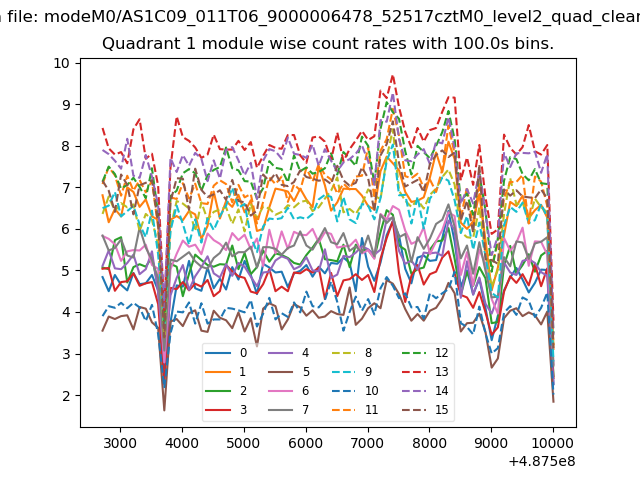
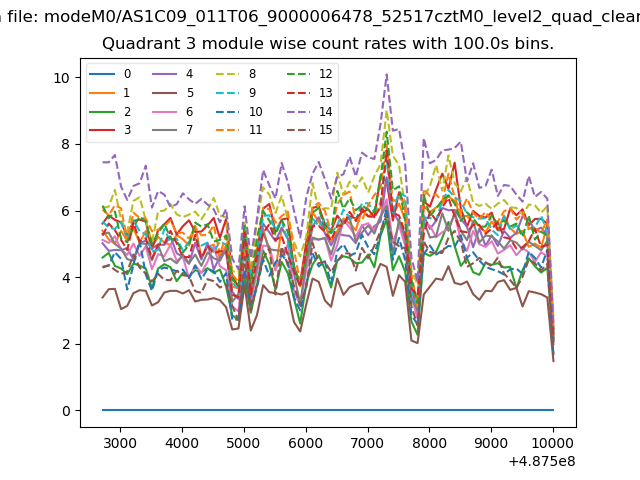
| Module-wise count rates for Quadrant A Data is divided into 100 sec bins |
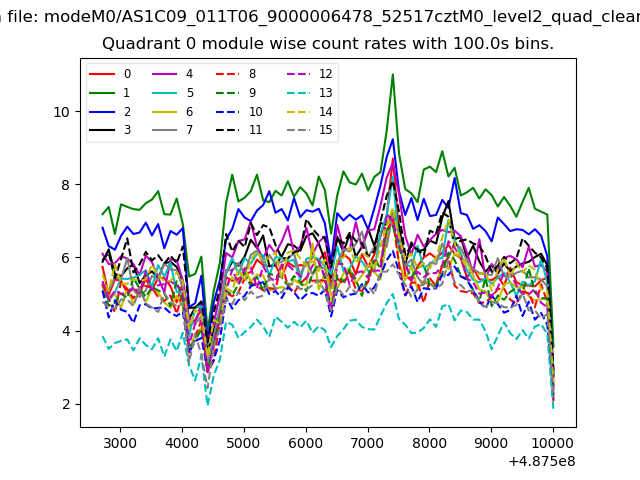 |
 |
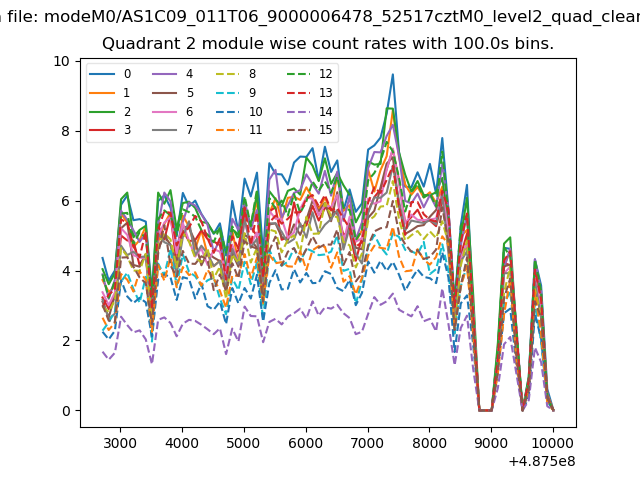
| Module-wise count rates for Quadrant B Data is divided into 100 sec bins |
 |
 |
| Module-wise count rates for Quadrant C Data is divided into 100 sec bins |
 |
 |
| Module-wise count rates for Quadrant D Data is divided into 100 sec bins |
 |
 |
| Parameter | Plot |
|---|---|
| CZT HV Monitor | 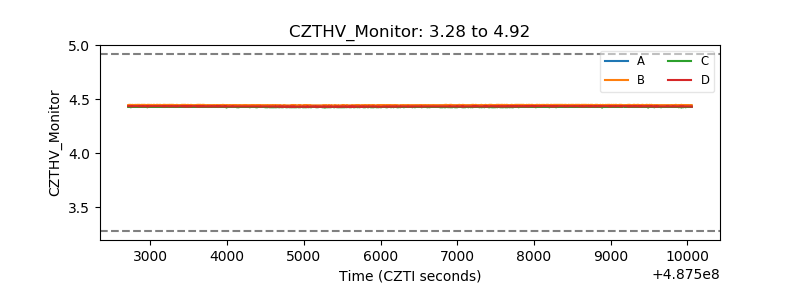 |
| D_VDD | 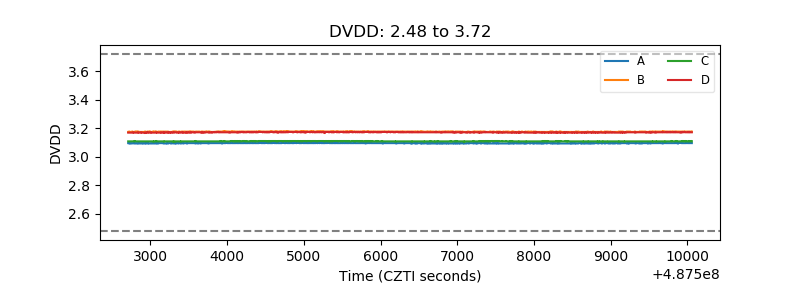 |
| Temperature 1 | 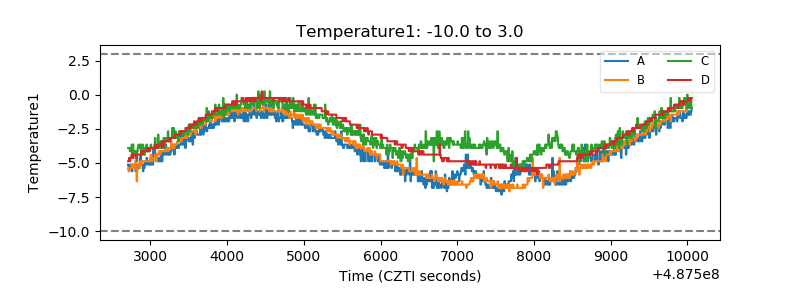 |
| Veto HV Monitor | 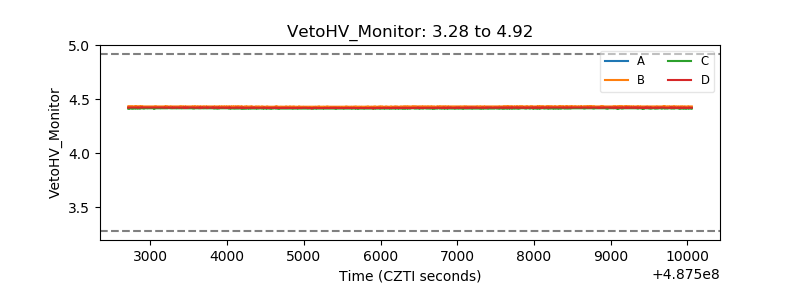 |
| Veto LLD | 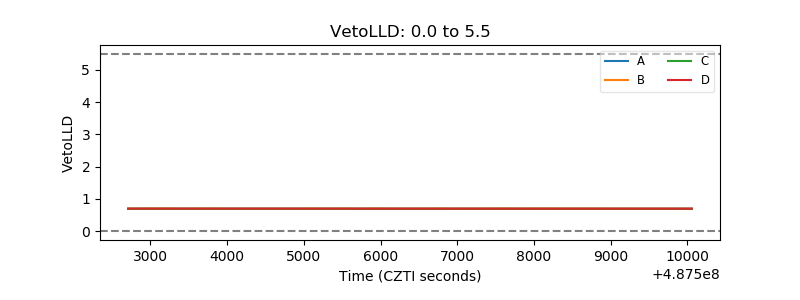 |
| Alpha Counter | 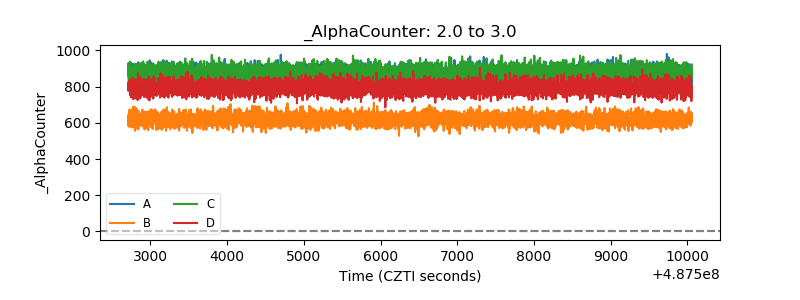 |
| _CPM_Rate | 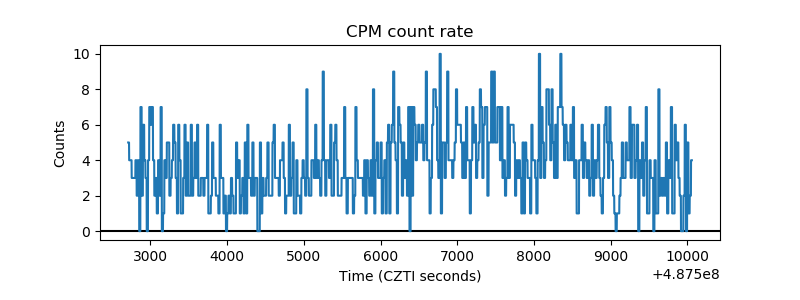 |
| CZT Counter | 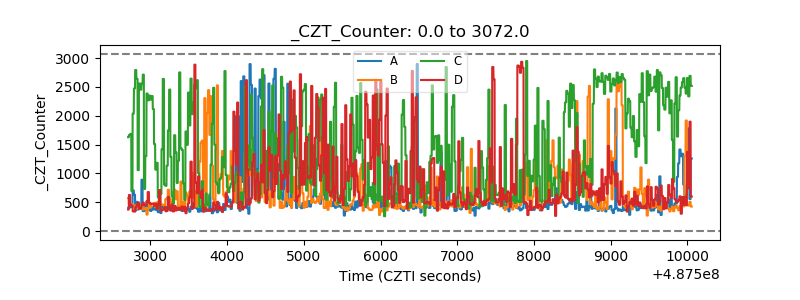 |
| +2.5 Volts monitor | 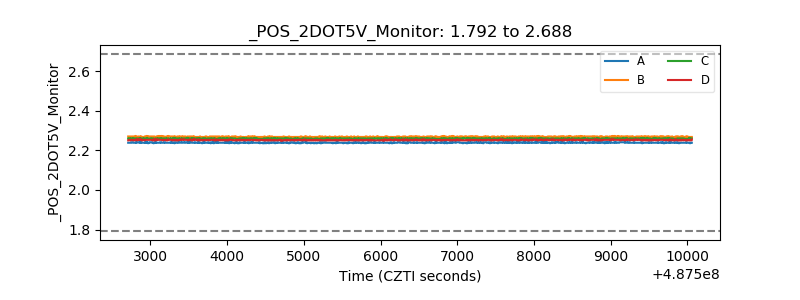 |
| +5 Volts monitor |  |
| _ROLL_ROT | 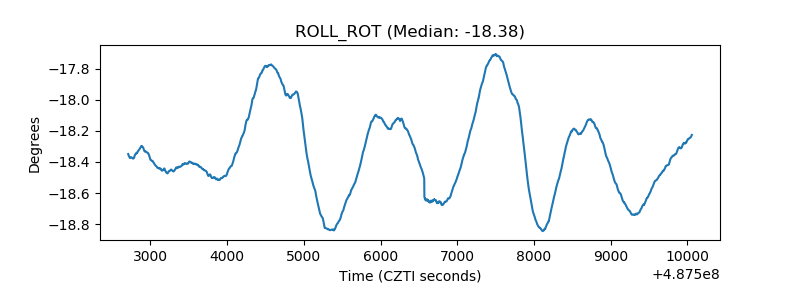 |
| _Roll_DEC | 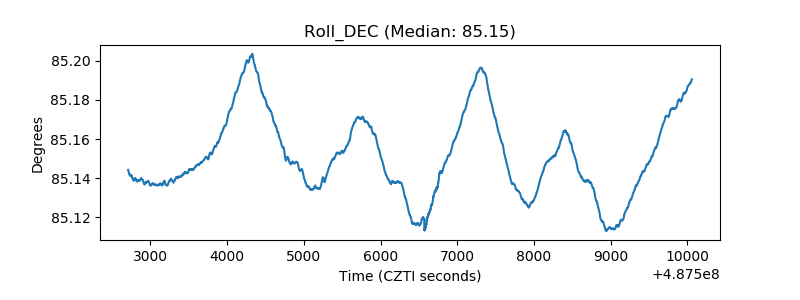 |
| _Roll_RA | 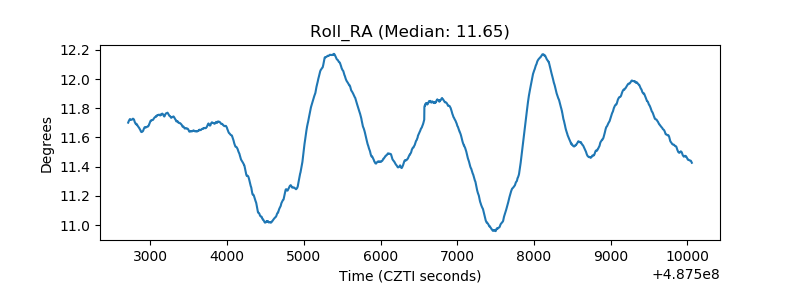 |
| Veto Counter | 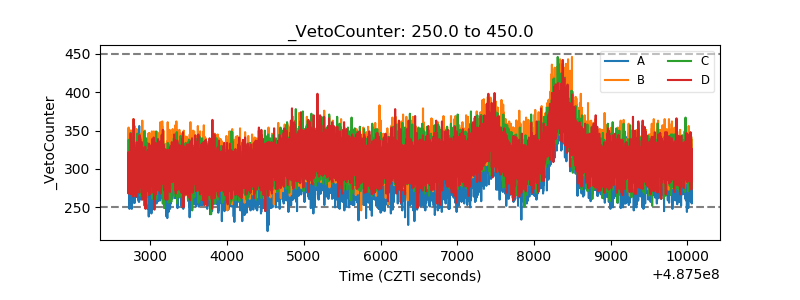 |