| Param | Original file | Final file |
|---|---|---|
| Filename | modeM0/AS1C09_011T06_9000006478_52525cztM0_level2.fits | modeM0/AS1C09_011T06_9000006478_52525cztM0_level2_quad_clean.evt |
| Size (bytes) | 725,178,240 | 81,417,600 |
| Size | 691.6 MB | 77.6 MB |
| Events in quadrant A | 2,882,828 | 618,060 |
| Events in quadrant B | 3,444,589 | 657,213 |
| Events in quadrant C | 8,150,434 | 447,581 |
| Events in quadrant D | 11,876,241 | 301,297 |
| Mode M0 | |||
|---|---|---|---|
| Quadrant | BADHDUFLAG | Total packets | Discarded packets |
| A | 0 | 13358 | 2 |
| B | 0 | 14528 | 2 |
| C | 0 | 28704 | 2 |
| D | 0 | 39701 | 2 |
| Mode M9 | |||
|---|---|---|---|
| Quadrant | BADHDUFLAG | Total packets | Discarded packets |
| A | 0 | 20 | 0 |
| B | 0 | 21 | 0 |
| C | 0 | 21 | 0 |
| D | 0 | 21 | 0 |
| Mode SS | |||
|---|---|---|---|
| Quadrant | BADHDUFLAG | Total packets | Discarded packets |
| A | 0 | 128 | 0 |
| B | 0 | 128 | 0 |
| C | 0 | 128 | 0 |
| D | 0 | 128 | 0 |
| Quadrant | Total seconds | Saturated seconds | Saturation percentage |
|---|---|---|---|
| A | 6318 | 30 | 0.474834% |
| B | 6318 | 89 | 1.408674% |
| C | 6317 | 1741 | 27.560551% |
| D | 6317 | 3241 | 51.306000% |
Noise dominated data is calculated using 1-second bins in cleaned event files. If a bin has >2000 counts, and if more than 50% of those come from <1% of pixels, then it is considered to be noise-dominated and hence unusable.
| Quadrant | # 1 sec bins | Bins with >0 counts | Bins with >2000 counts | High rate bins dominated by noise | Noise dominated (total time) | Noise dominated (detector-on time) | Marked lightcurve |
|---|---|---|---|---|---|---|---|
| A | 7493 | 6319 | 10 | 10 | 0.13% | 0.16% | 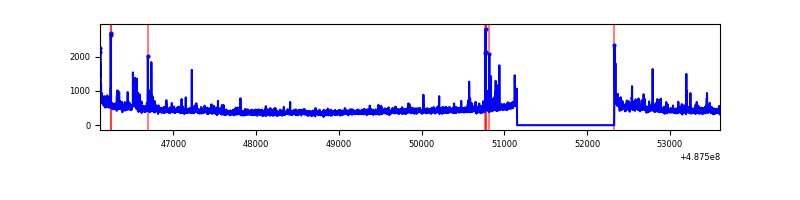 |
| B | 7493 | 6319 | 31 | 31 | 0.41% | 0.49% | 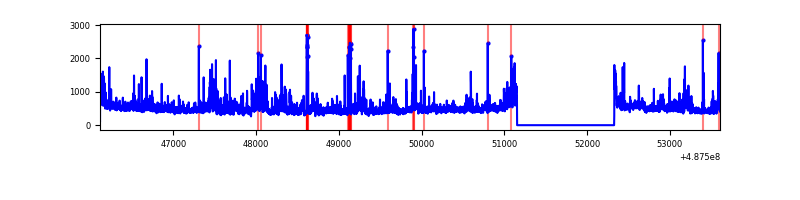 |
| C | 7492 | 6318 | 1548 | 1548 | 20.66% | 24.50% | 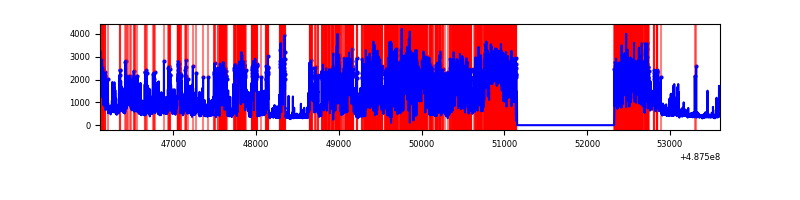 |
| D | 7492 | 6318 | 3069 | 3069 | 40.96% | 48.58% | 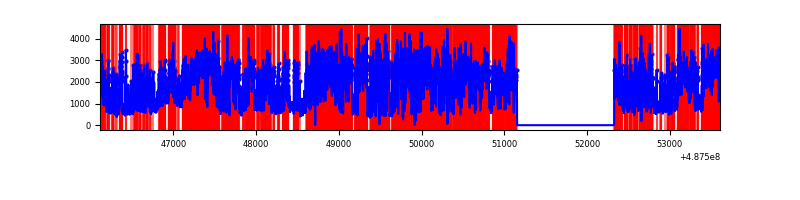 |
Top three noisy pixels from each quadrant. If the there are fewer than three noisy pixels in the level2.evt file, extra rows are filled as -1
| Pixel properties | Quadrant properties | ||||||
|---|---|---|---|---|---|---|---|
| Quadrant | DetID | PixID | Counts | Sigma | Mean | Median | Sigma |
| A | 11 | 3 | 54950 | 326.08 | 666 | 649 | 166.5 |
| A | 3 | 14 | 54322 | 322.31 | 666 | 649 | 166.5 |
| A | 4 | 30 | 28872 | 169.48 | 666 | 649 | 166.5 |
| B | 10 | 254 | 168020 | 1195.09 | 663 | 639 | 140.1 |
| B | 4 | 81 | 131573 | 934.86 | 663 | 639 | 140.1 |
| B | 4 | 21 | 91332 | 647.54 | 663 | 639 | 140.1 |
| C | 15 | 224 | 2927226 | 18586.17 | 567 | 562 | 157.5 |
| C | 15 | 233 | 558452 | 3542.95 | 567 | 562 | 157.5 |
| C | 4 | 5 | 447510 | 2838.4 | 567 | 562 | 157.5 |
| D | 15 | 93 | 7647479 | 55833.52 | 465 | 441 | 137.0 |
| D | 6 | 42 | 1090727 | 7960.53 | 465 | 441 | 137.0 |
| D | 8 | 176 | 427479 | 3117.94 | 465 | 441 | 137.0 |
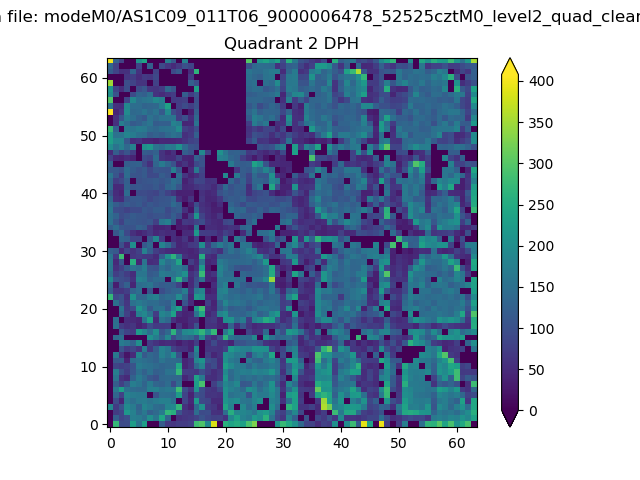
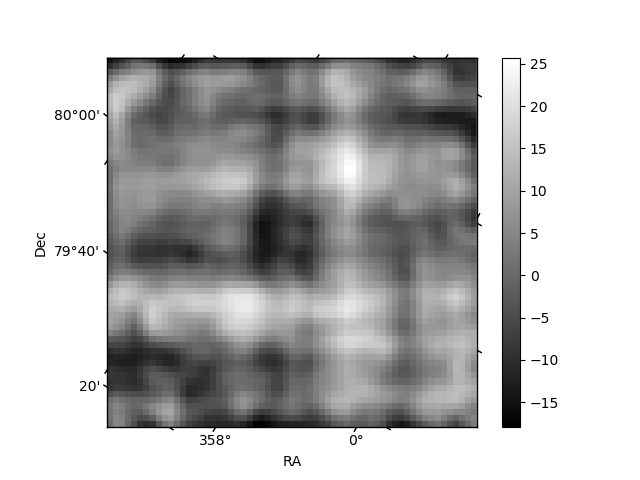
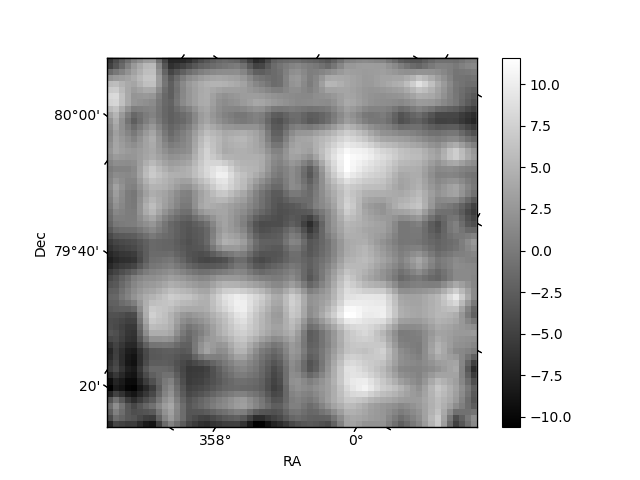
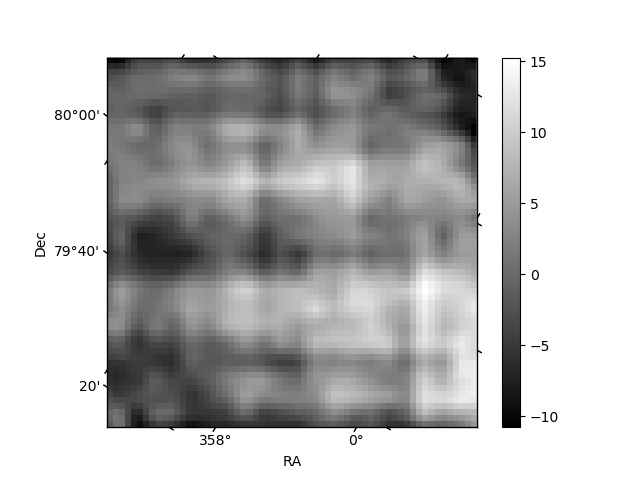
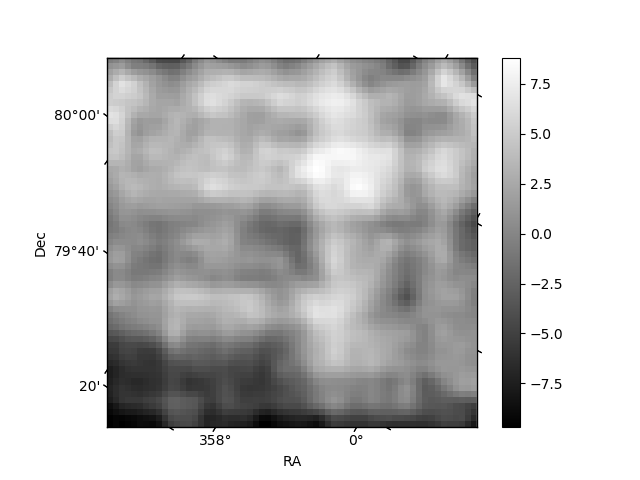
Histogram calculated using DETX and DETY for each event in the final _common_clean file
| Quadrant A | 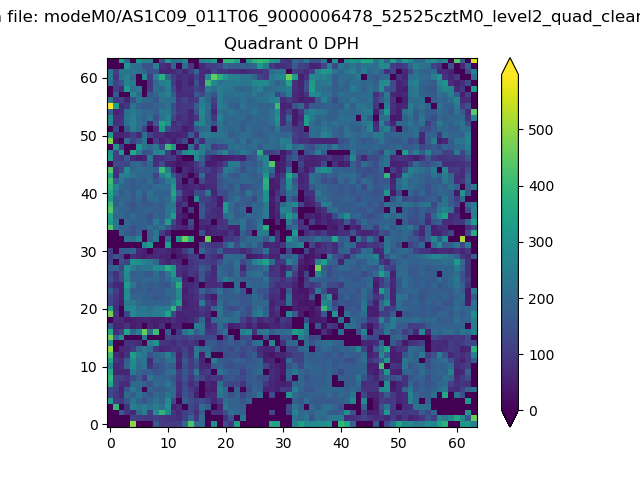 |
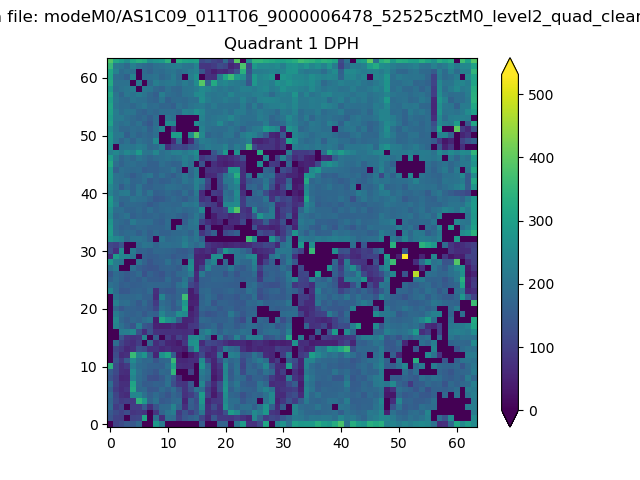 |
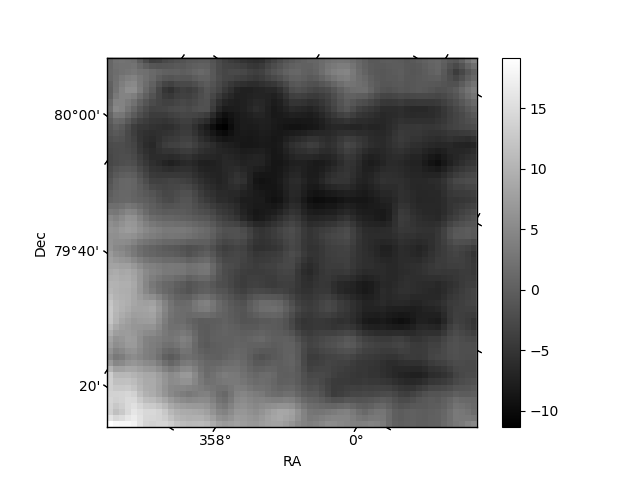
Quadrant B |
|---|---|---|---|
| Quadrant D | 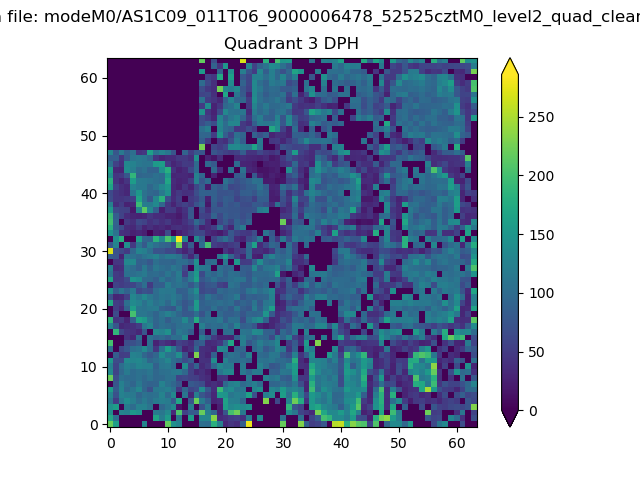 |
 |
Quadrant C |
| Plot type | Count rate plots | Images |
|---|---|---|
| Comparison with Poisson distribution Blue bars denote a histogram of data divided into 1 sec bins. Red curve is a Poisson curve with rate = median count rate of data. |
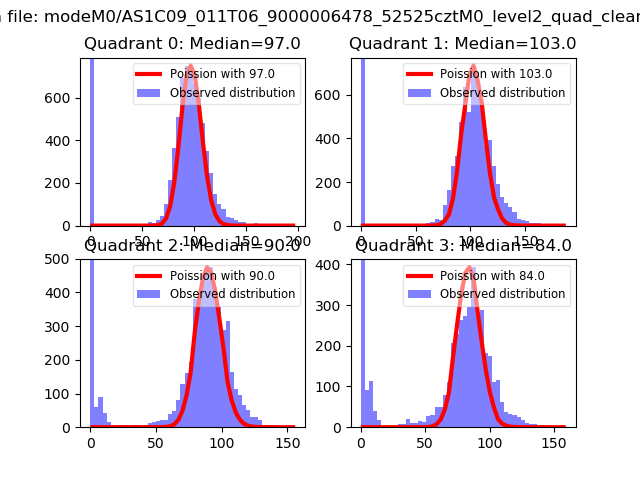 |
 |
| Quadrant-wise count rates Data is divided into 100 sec bins |
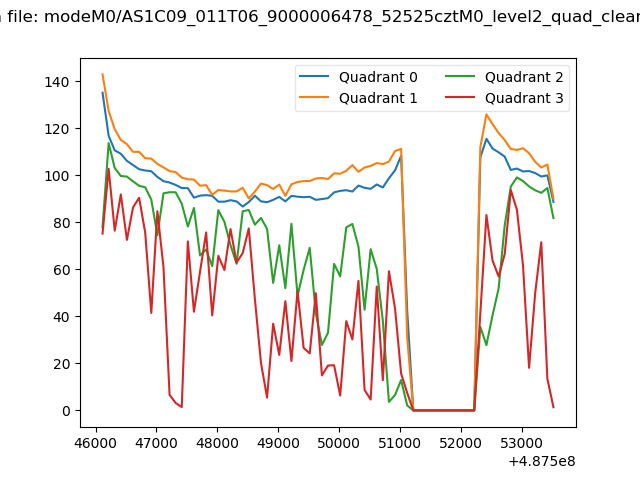 |
|
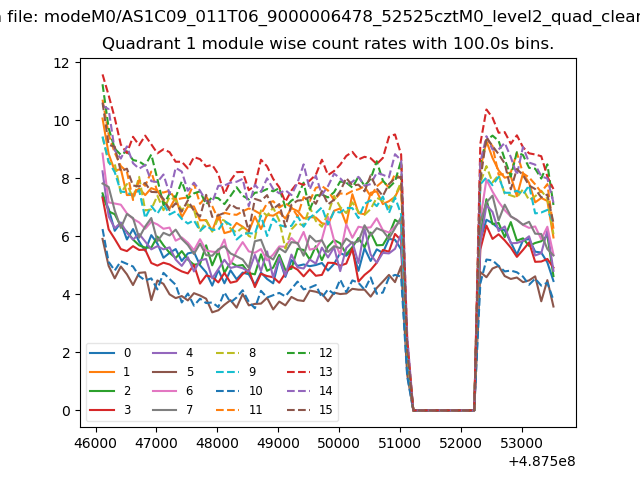
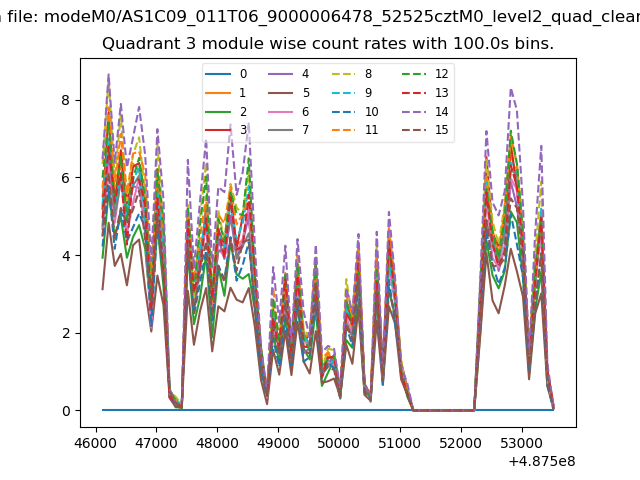
| Module-wise count rates for Quadrant A Data is divided into 100 sec bins |
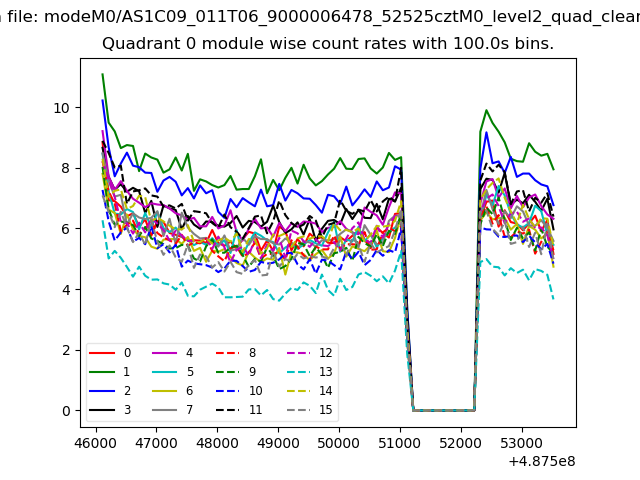 |
 |
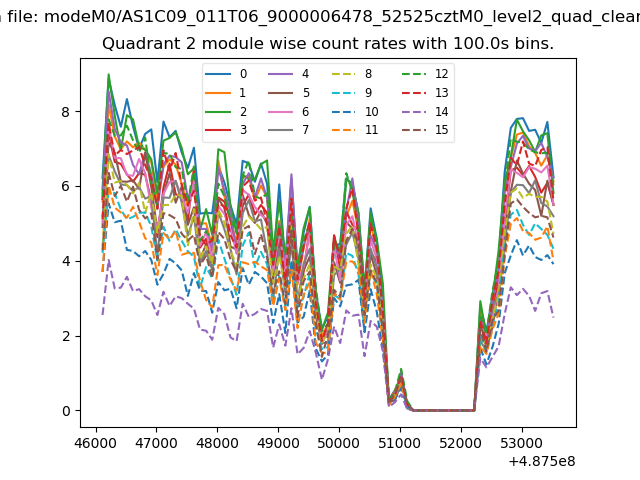
| Module-wise count rates for Quadrant B Data is divided into 100 sec bins |
 |
 |
| Module-wise count rates for Quadrant C Data is divided into 100 sec bins |
 |
 |
| Module-wise count rates for Quadrant D Data is divided into 100 sec bins |
 |
 |
| Parameter | Plot |
|---|---|
| CZT HV Monitor | 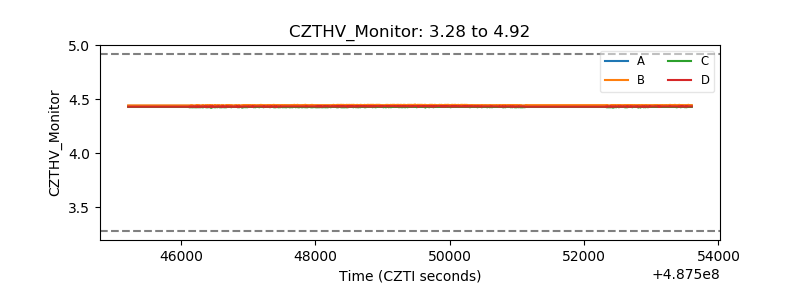 |
| D_VDD | 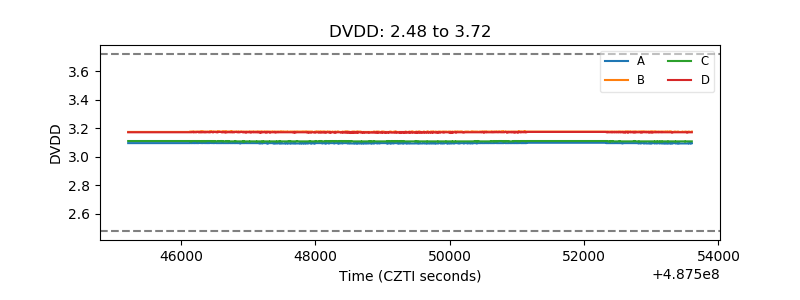 |
| Temperature 1 | 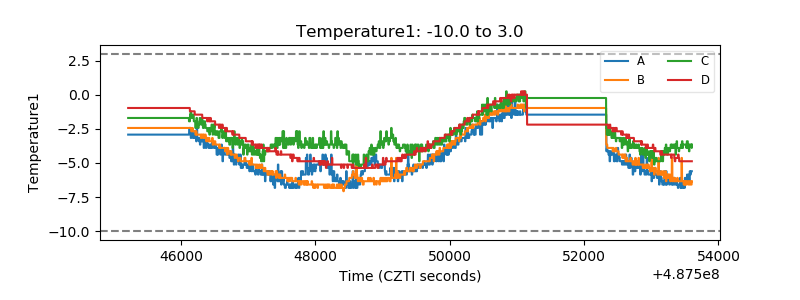 |
| Veto HV Monitor | 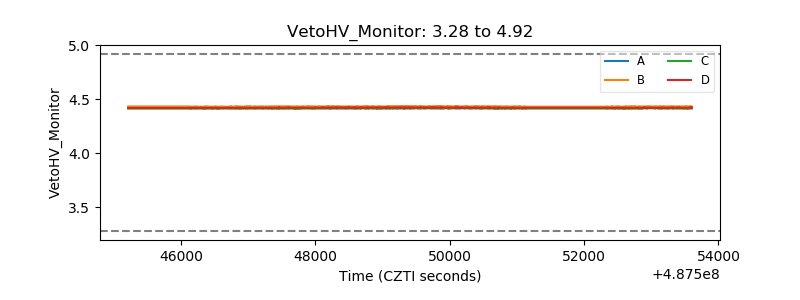 |
| Veto LLD | 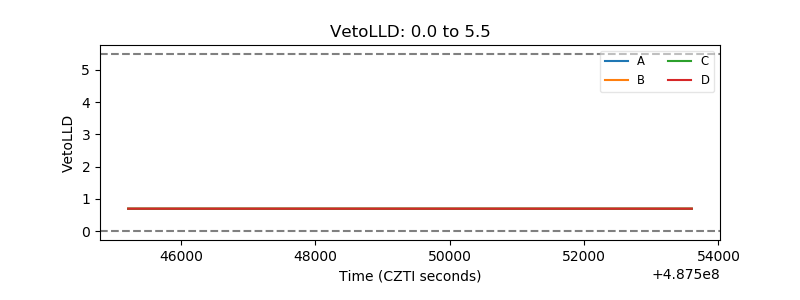 |
| Alpha Counter | 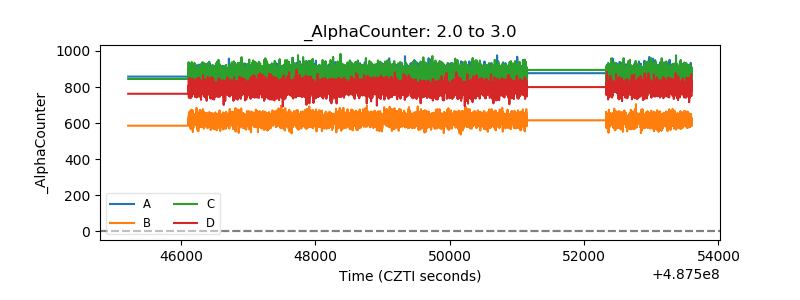 |
| _CPM_Rate | 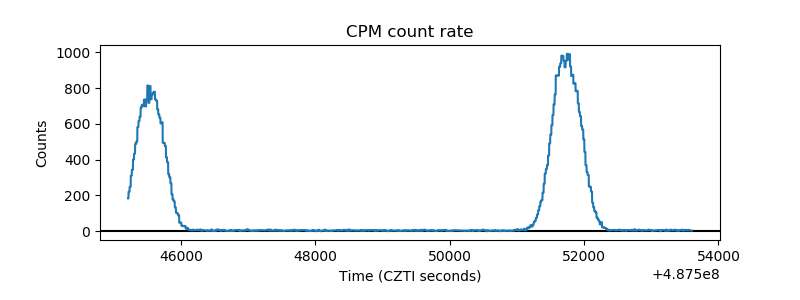 |
| CZT Counter | 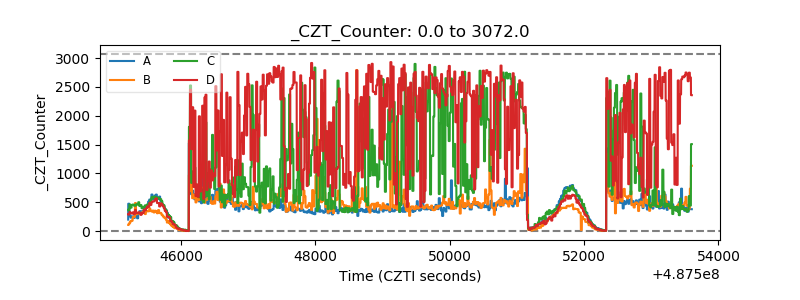 |
| +2.5 Volts monitor |  |
| +5 Volts monitor |  |
| _ROLL_ROT | 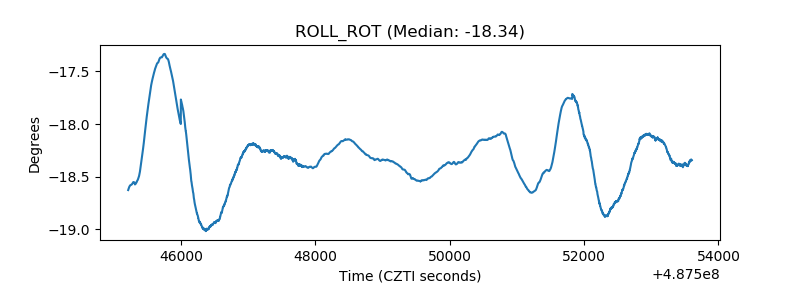 |
| _Roll_DEC | 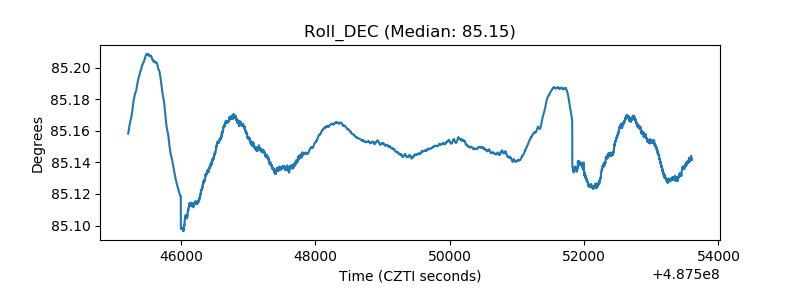 |
| _Roll_RA | 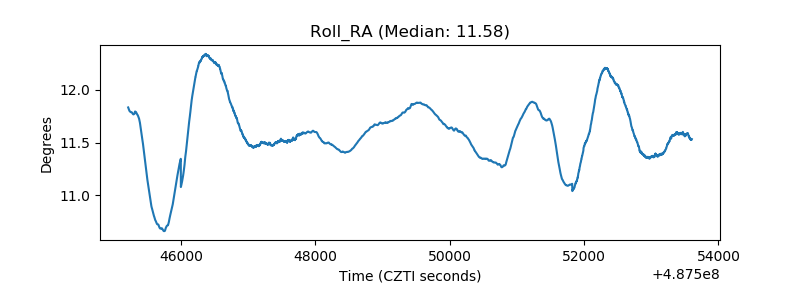 |
| Veto Counter | 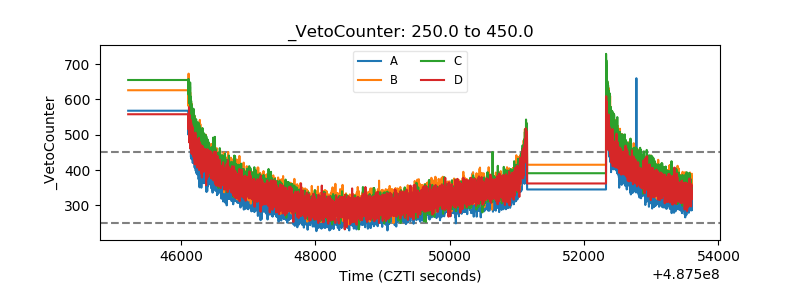 |