| Param | Original file | Final file |
|---|---|---|
| Filename | modeM0/AS1C09_011T06_9000006478_52529cztM0_level2.fits | modeM0/AS1C09_011T06_9000006478_52529cztM0_level2_quad_clean.evt |
| Size (bytes) | 656,654,400 | 103,026,240 |
| Size | 626.2 MB | 98.3 MB |
| Events in quadrant A | 3,667,948 | 759,102 |
| Events in quadrant B | 4,974,496 | 689,251 |
| Events in quadrant C | 4,651,581 | 715,861 |
| Events in quadrant D | 10,466,457 | 464,210 |
| Mode M0 | |||
|---|---|---|---|
| Quadrant | BADHDUFLAG | Total packets | Discarded packets |
| A | 0 | 16352 | 6 |
| B | 0 | 19868 | 5 |
| C | 0 | 18796 | 16 |
| D | 0 | 36035 | 25 |
| Mode M9 | |||
|---|---|---|---|
| Quadrant | BADHDUFLAG | Total packets | Discarded packets |
| A | 0 | 5 | 0 |
| B | 0 | 5 | 0 |
| C | 0 | 5 | 0 |
| D | 0 | 5 | 0 |
| Mode SS | |||
|---|---|---|---|
| Quadrant | BADHDUFLAG | Total packets | Discarded packets |
| A | 0 | 144 | 0 |
| B | 0 | 144 | 0 |
| C | 0 | 144 | 0 |
| D | 0 | 144 | 0 |
| Quadrant | Total seconds | Saturated seconds | Saturation percentage |
|---|---|---|---|
| A | 7048 | 176 | 2.497162% |
| B | 7049 | 712 | 10.100724% |
| C | 7046 | 170 | 2.412716% |
| D | 7046 | 2399 | 34.047687% |
Noise dominated data is calculated using 1-second bins in cleaned event files. If a bin has >2000 counts, and if more than 50% of those come from <1% of pixels, then it is considered to be noise-dominated and hence unusable.
| Quadrant | # 1 sec bins | Bins with >0 counts | Bins with >2000 counts | High rate bins dominated by noise | Noise dominated (total time) | Noise dominated (detector-on time) | Marked lightcurve |
|---|---|---|---|---|---|---|---|
| A | 7639 | 7051 | 88 | 88 | 1.15% | 1.25% | 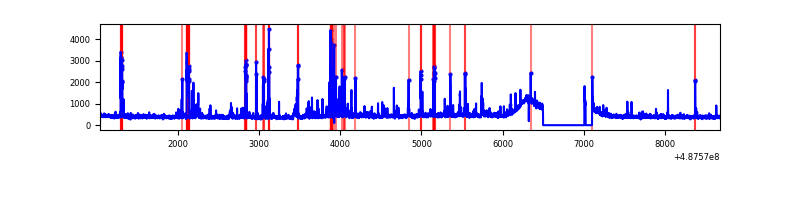 |
| B | 7640 | 7052 | 295 | 295 | 3.86% | 4.18% | 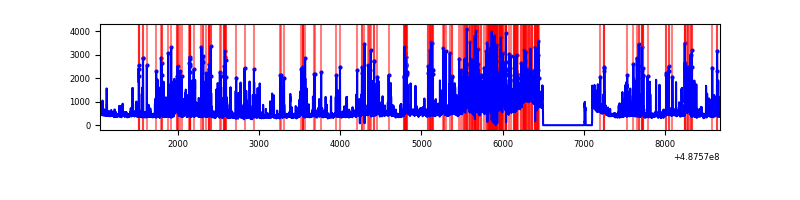 |
| C | 7640 | 7050 | 130 | 130 | 1.70% | 1.84% | 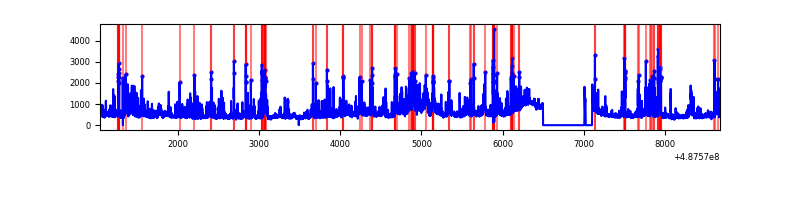 |
| D | 7640 | 7051 | 2207 | 2207 | 28.89% | 31.30% | 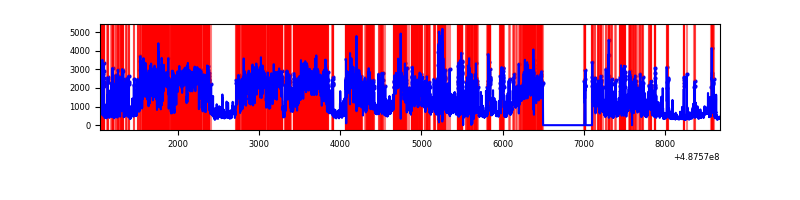 |
Top three noisy pixels from each quadrant. If the there are fewer than three noisy pixels in the level2.evt file, extra rows are filled as -1
| Pixel properties | Quadrant properties | ||||||
|---|---|---|---|---|---|---|---|
| Quadrant | DetID | PixID | Counts | Sigma | Mean | Median | Sigma |
| A | 5 | 243 | 364585 | 1850.4 | 766 | 747 | 196.6 |
| A | 13 | 248 | 84380 | 425.34 | 766 | 747 | 196.6 |
| A | 5 | 240 | 38522 | 192.12 | 766 | 747 | 196.6 |
| B | 12 | 32 | 1476403 | 9442.74 | 716 | 690 | 156.3 |
| B | 7 | 0 | 215947 | 1377.38 | 716 | 690 | 156.3 |
| B | 4 | 81 | 97647 | 620.4 | 716 | 690 | 156.3 |
| C | 15 | 248 | 454980 | 2188.07 | 733 | 726 | 207.6 |
| C | 15 | 224 | 364651 | 1752.97 | 733 | 726 | 207.6 |
| C | 13 | 3 | 321886 | 1546.98 | 733 | 726 | 207.6 |
| D | 6 | 42 | 4733040 | 24989.82 | 633 | 601 | 189.4 |
| D | 15 | 93 | 1077450 | 5686.34 | 633 | 601 | 189.4 |
| D | 8 | 176 | 942087 | 4971.55 | 633 | 601 | 189.4 |
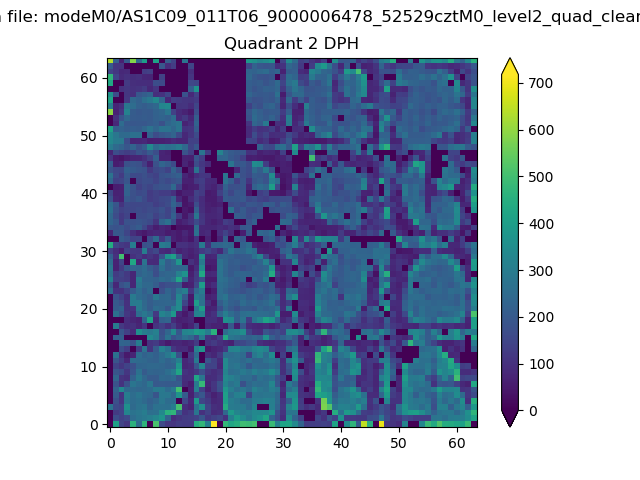
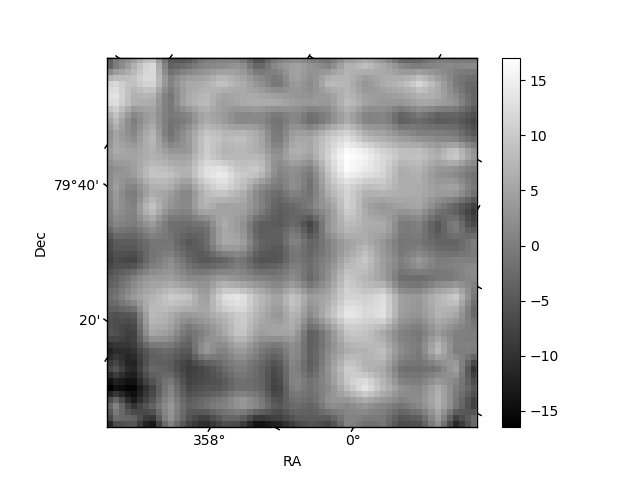
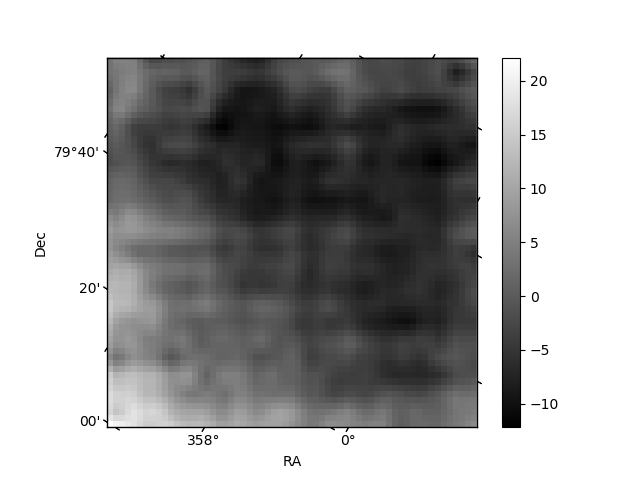
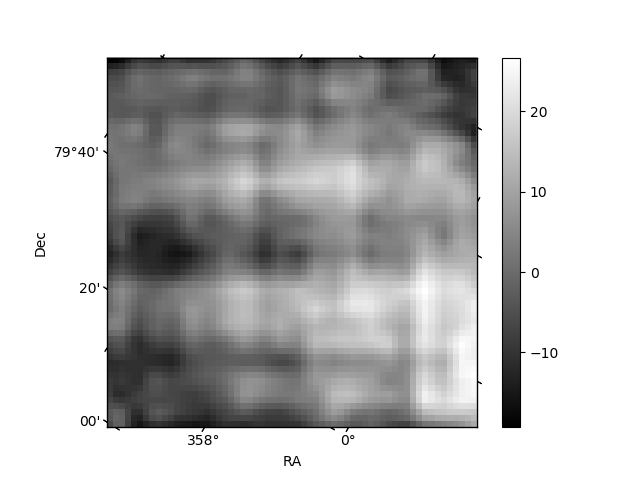
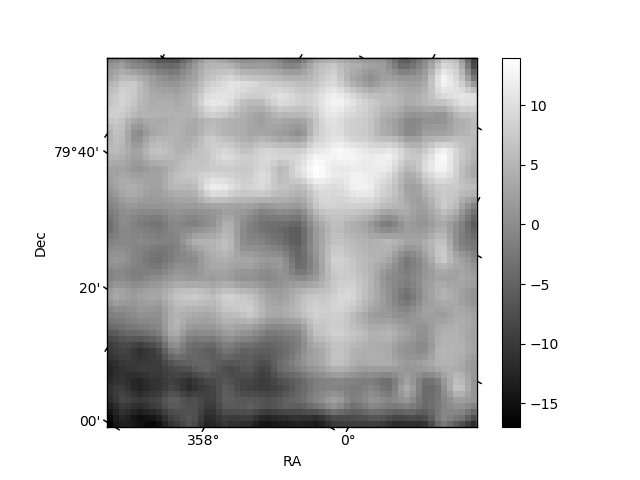
Histogram calculated using DETX and DETY for each event in the final _common_clean file
| Quadrant A | 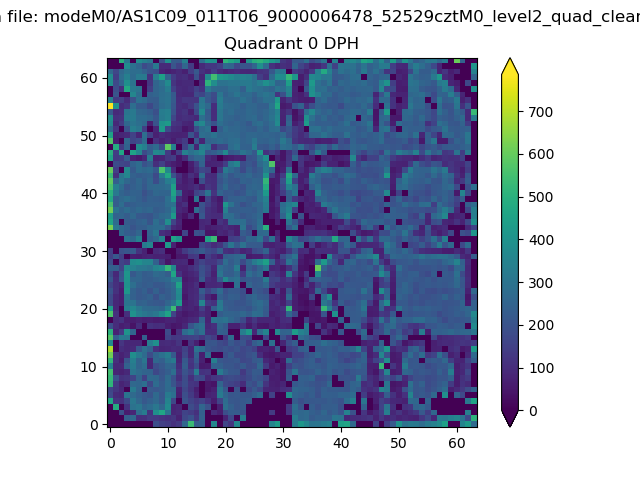 |
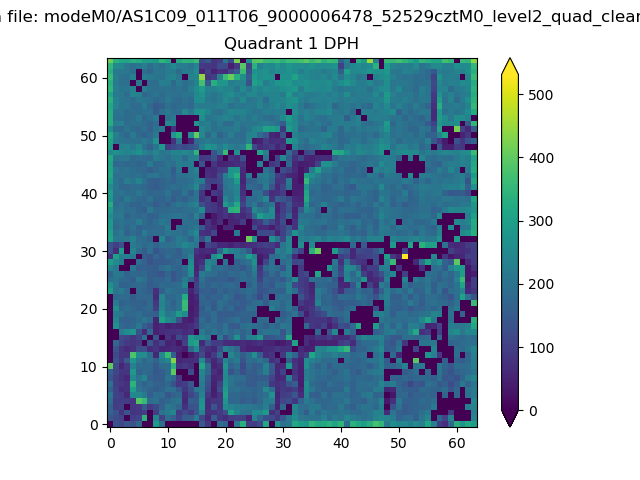 |
Quadrant B |
|---|---|---|---|
| Quadrant D | 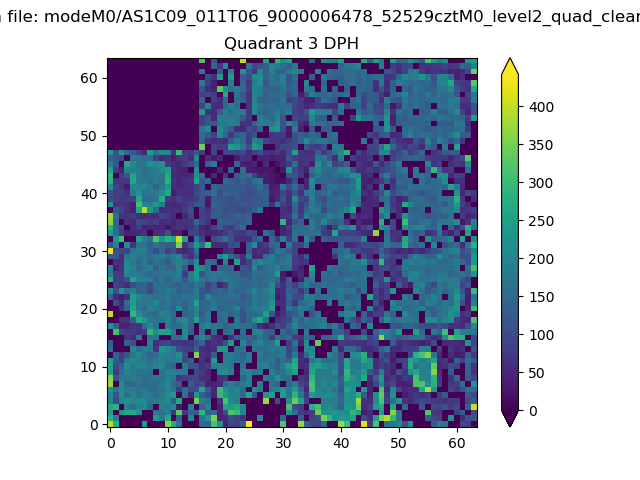 |
 |
Quadrant C |
| Plot type | Count rate plots | Images |
|---|---|---|
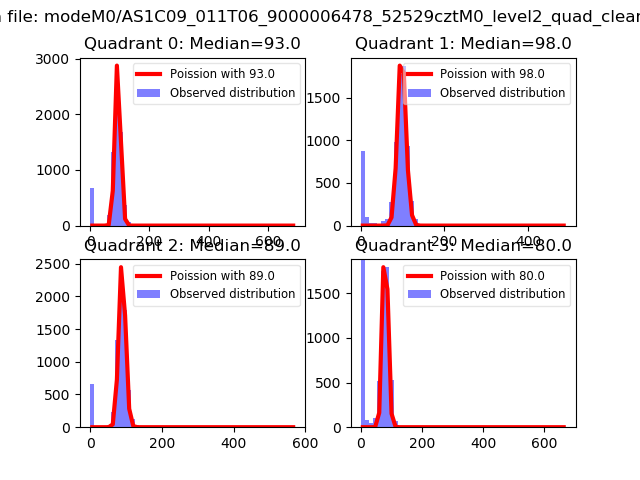
| Comparison with Poisson distribution Blue bars denote a histogram of data divided into 1 sec bins. Red curve is a Poisson curve with rate = median count rate of data. |
 |
 |
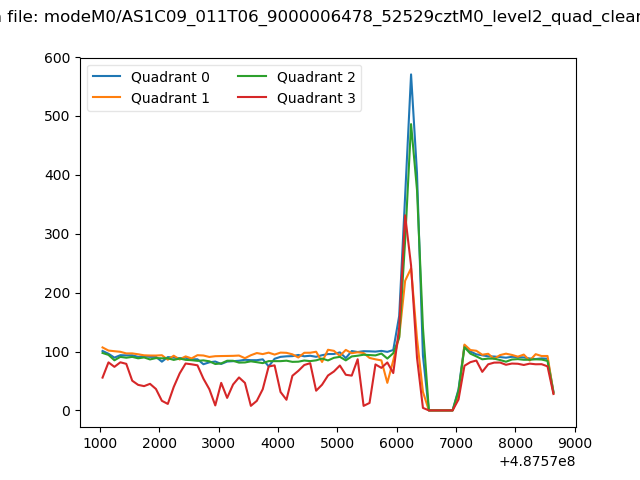
| Quadrant-wise count rates Data is divided into 100 sec bins |
 |
|
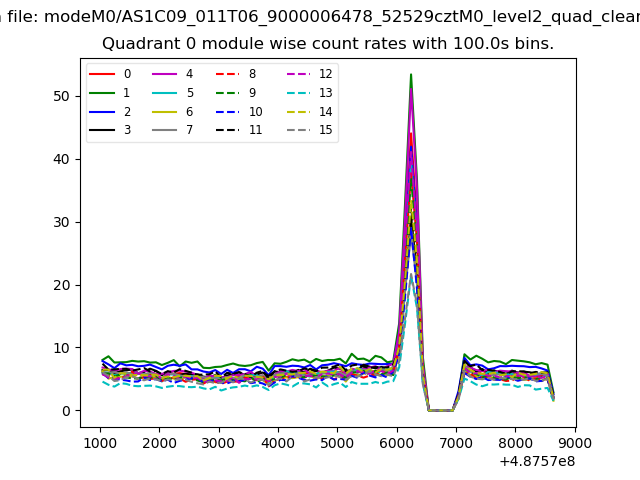
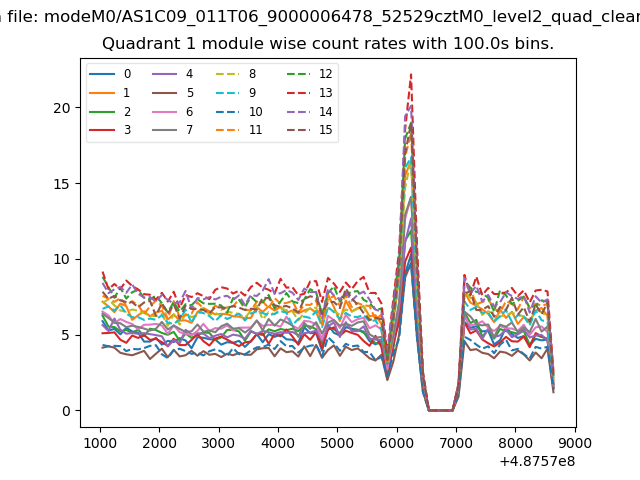
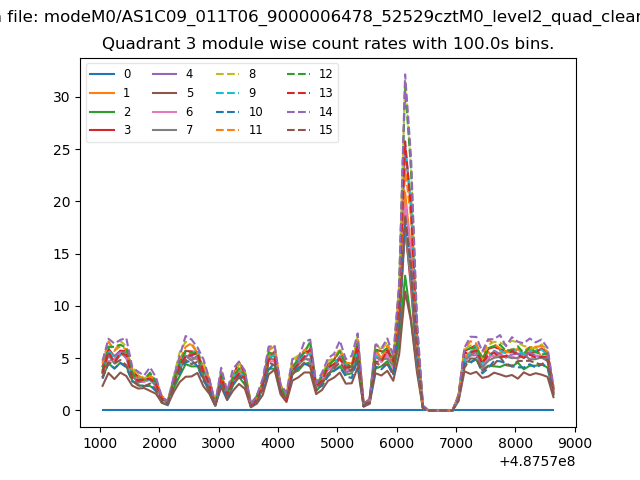
| Module-wise count rates for Quadrant A Data is divided into 100 sec bins |
 |
 |
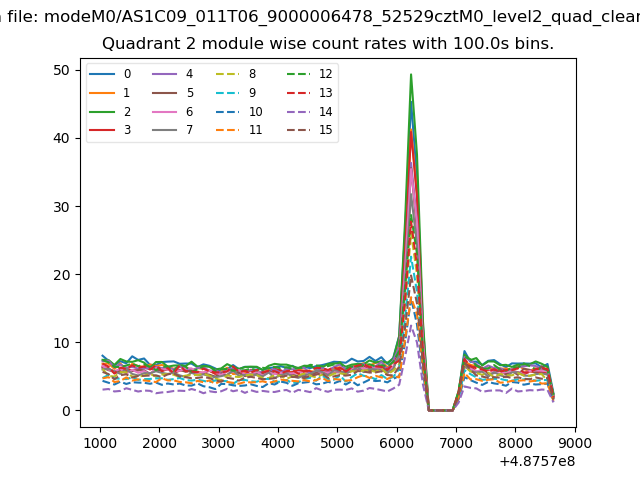
| Module-wise count rates for Quadrant B Data is divided into 100 sec bins |
 |
 |
| Module-wise count rates for Quadrant C Data is divided into 100 sec bins |
 |
 |
| Module-wise count rates for Quadrant D Data is divided into 100 sec bins |
 |
 |
| Parameter | Plot |
|---|---|
| CZT HV Monitor | 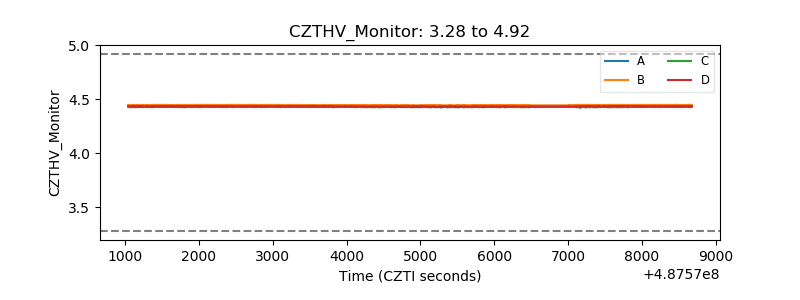 |
| D_VDD | 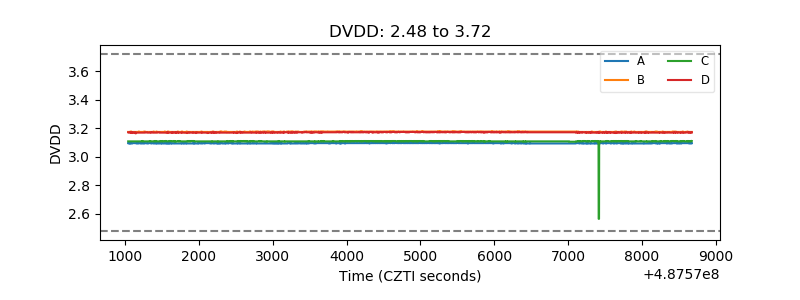 |
| Temperature 1 | 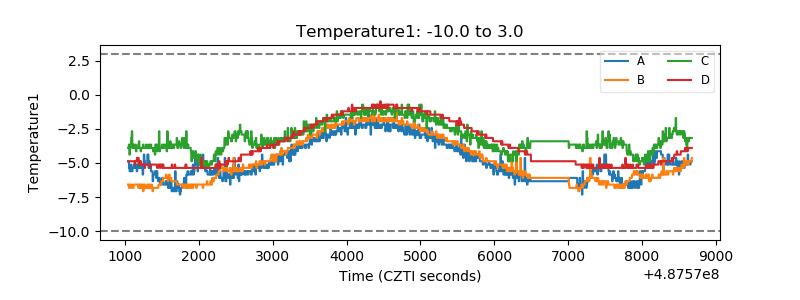 |
| Veto HV Monitor | 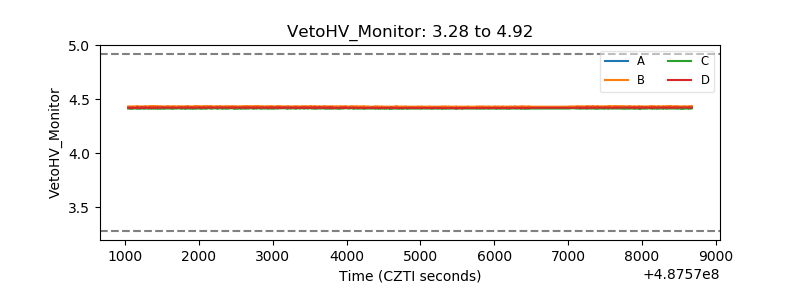 |
| Veto LLD | 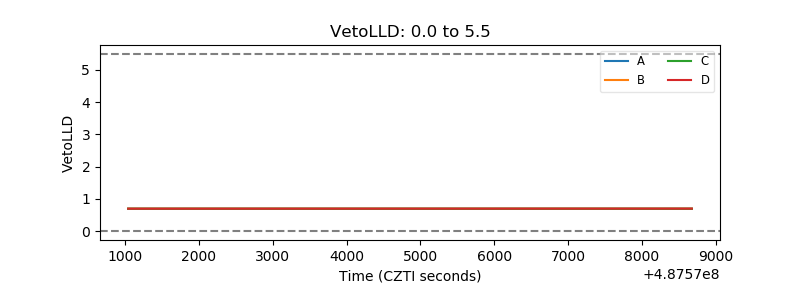 |
| Alpha Counter | 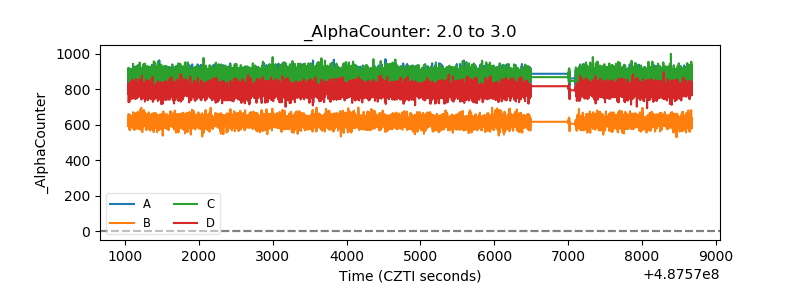 |
| _CPM_Rate | 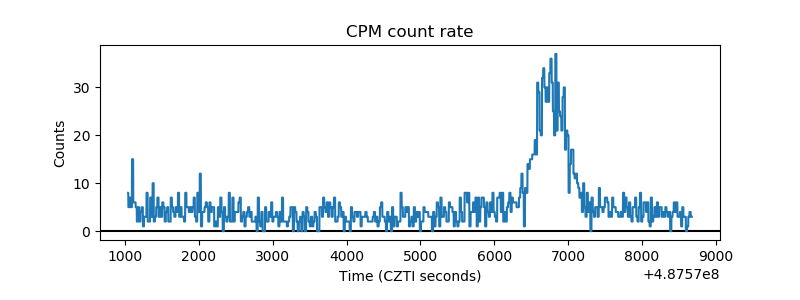 |
| CZT Counter | 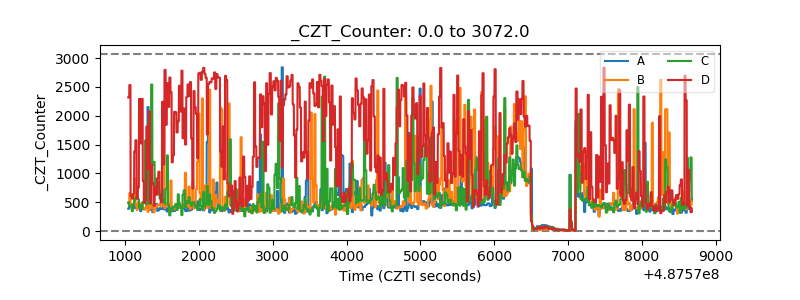 |
| +2.5 Volts monitor |  |
| +5 Volts monitor |  |
| _ROLL_ROT | 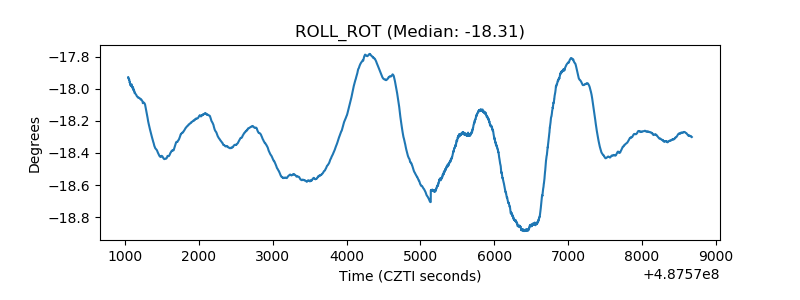 |
| _Roll_DEC |  |
| _Roll_RA | 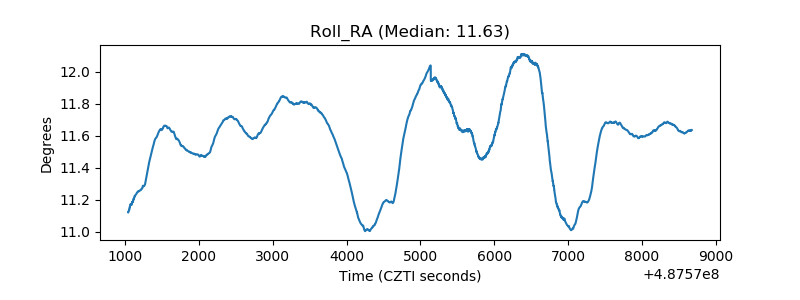 |
| Veto Counter | 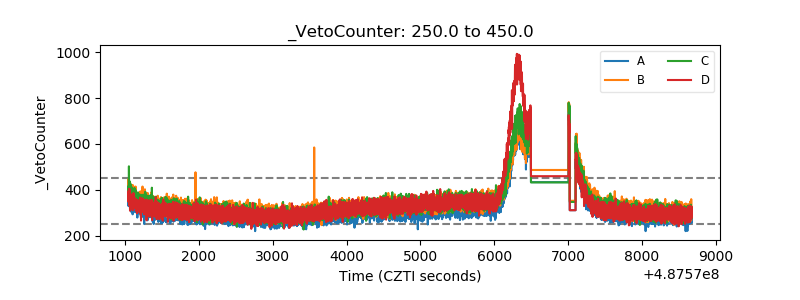 |