| Param | Original file | Final file |
|---|---|---|
| Filename | modeM0/AS1C09_011T06_9000006478_52530cztM0_level2.fits | modeM0/AS1C09_011T06_9000006478_52530cztM0_level2_quad_clean.evt |
| Size (bytes) | 687,991,680 | 108,371,520 |
| Size | 656.1 MB | 103.4 MB |
| Events in quadrant A | 3,570,374 | 759,963 |
| Events in quadrant B | 6,761,495 | 700,589 |
| Events in quadrant C | 6,272,557 | 679,176 |
| Events in quadrant D | 8,282,168 | 619,620 |
| Mode M0 | |||
|---|---|---|---|
| Quadrant | BADHDUFLAG | Total packets | Discarded packets |
| A | 0 | 16497 | 1 |
| B | 0 | 25306 | 0 |
| C | 0 | 23954 | 0 |
| D | 0 | 29922 | 0 |
| Mode SS | |||
|---|---|---|---|
| Quadrant | BADHDUFLAG | Total packets | Discarded packets |
| A | 0 | 150 | 0 |
| B | 0 | 150 | 0 |
| C | 0 | 150 | 0 |
| D | 0 | 150 | 0 |
| Quadrant | Total seconds | Saturated seconds | Saturation percentage |
|---|---|---|---|
| A | 7500 | 65 | 0.866667% |
| B | 7501 | 1051 | 14.011465% |
| C | 7501 | 445 | 5.932542% |
| D | 7501 | 918 | 12.238368% |
Noise dominated data is calculated using 1-second bins in cleaned event files. If a bin has >2000 counts, and if more than 50% of those come from <1% of pixels, then it is considered to be noise-dominated and hence unusable.
| Quadrant | # 1 sec bins | Bins with >0 counts | Bins with >2000 counts | High rate bins dominated by noise | Noise dominated (total time) | Noise dominated (detector-on time) | Marked lightcurve |
|---|---|---|---|---|---|---|---|
| A | 7500 | 7500 | 31 | 31 | 0.41% | 0.41% | 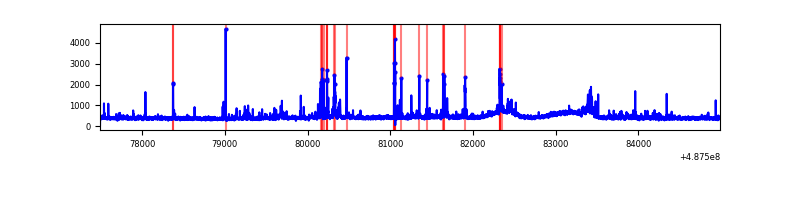 |
| B | 7501 | 7501 | 509 | 509 | 6.79% | 6.79% | 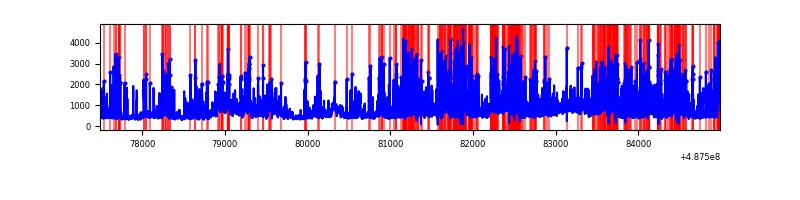 |
| C | 7501 | 7501 | 402 | 402 | 5.36% | 5.36% | 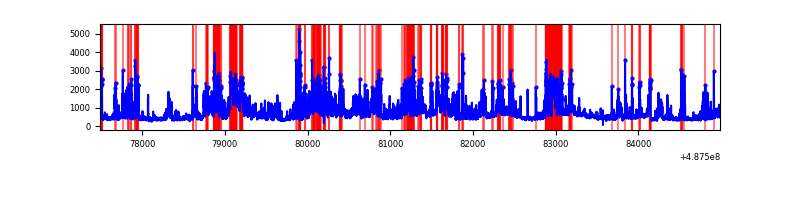 |
| D | 7501 | 7501 | 902 | 902 | 12.03% | 12.03% | 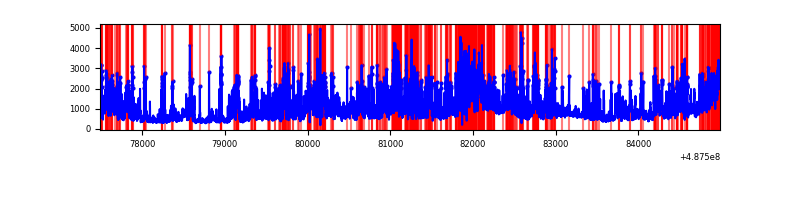 |
Top three noisy pixels from each quadrant. If the there are fewer than three noisy pixels in the level2.evt file, extra rows are filled as -1
| Pixel properties | Quadrant properties | ||||||
|---|---|---|---|---|---|---|---|
| Quadrant | DetID | PixID | Counts | Sigma | Mean | Median | Sigma |
| A | 5 | 243 | 102800 | 490.28 | 806 | 785 | 208.1 |
| A | 15 | 174 | 95592 | 455.64 | 806 | 785 | 208.1 |
| A | 3 | 14 | 49683 | 235.0 | 806 | 785 | 208.1 |
| B | 12 | 32 | 2385995 | 15036.06 | 740 | 714 | 158.6 |
| B | 7 | 0 | 472896 | 2976.49 | 740 | 714 | 158.6 |
| B | 10 | 254 | 441494 | 2778.54 | 740 | 714 | 158.6 |
| C | 15 | 224 | 1511268 | 7149.96 | 750 | 740 | 211.3 |
| C | 15 | 233 | 507650 | 2399.42 | 750 | 740 | 211.3 |
| C | 13 | 3 | 378766 | 1789.35 | 750 | 740 | 211.3 |
| D | 6 | 42 | 2039369 | 9633.91 | 734 | 699 | 211.6 |
| D | 15 | 93 | 1102941 | 5208.74 | 734 | 699 | 211.6 |
| D | 8 | 176 | 679389 | 3207.21 | 734 | 699 | 211.6 |
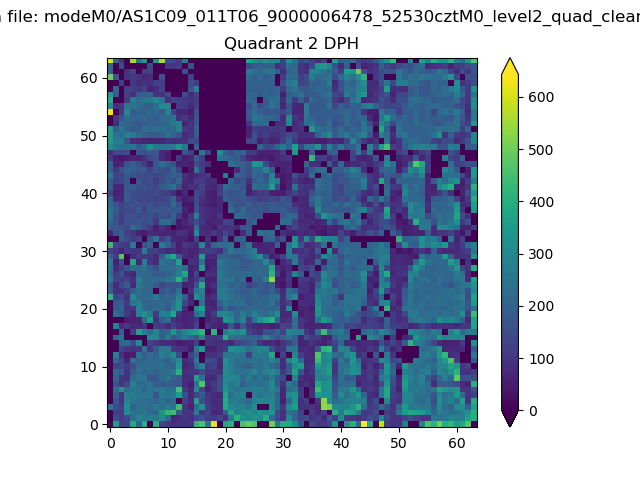
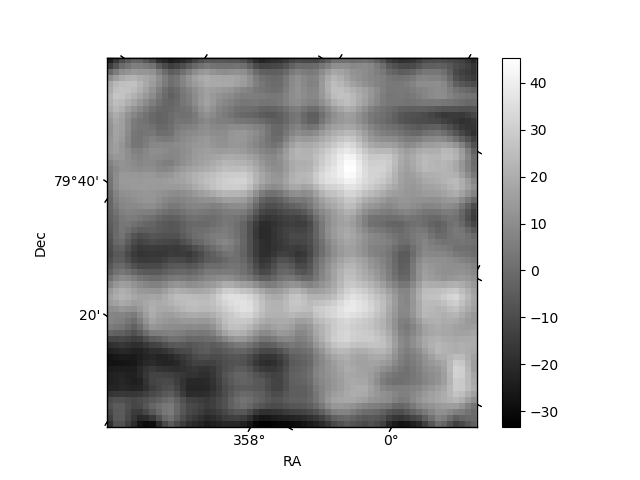
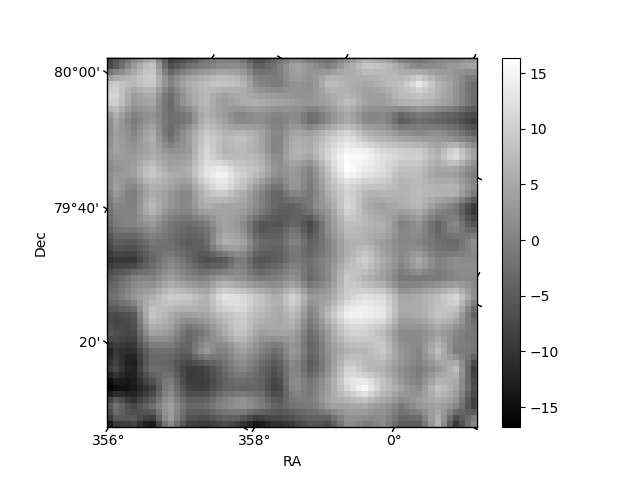
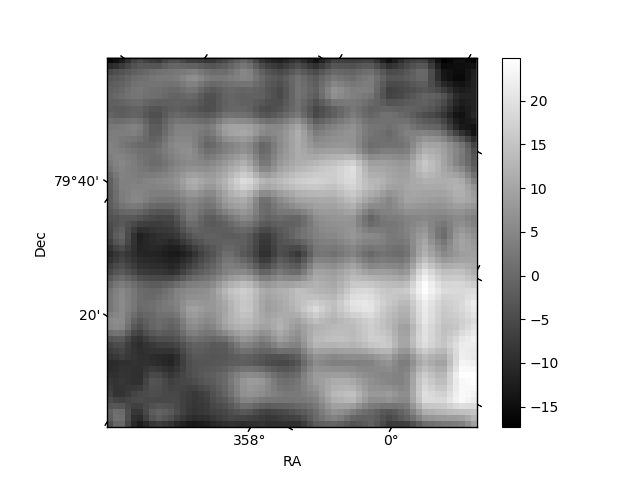
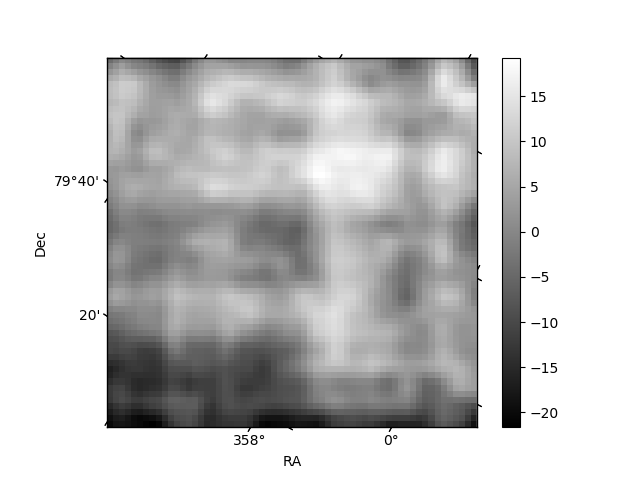
Histogram calculated using DETX and DETY for each event in the final _common_clean file
| Quadrant A | 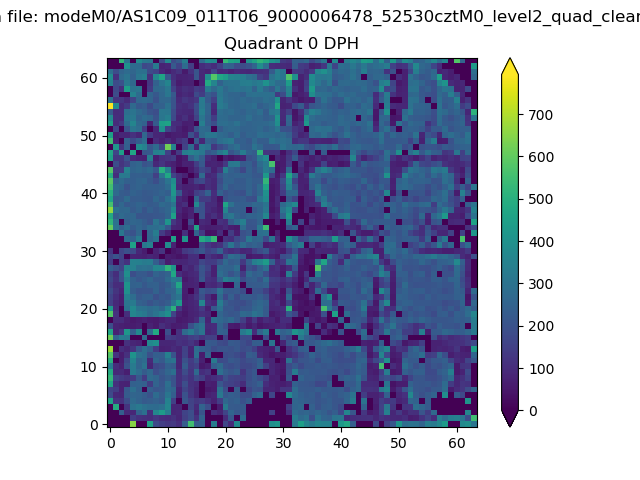 |
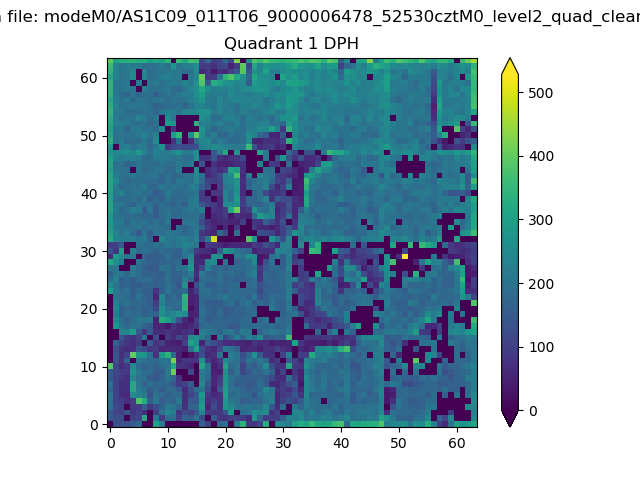 |
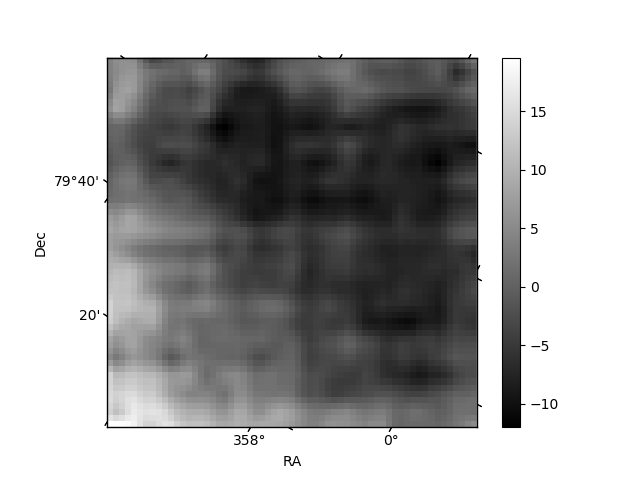
Quadrant B |
|---|---|---|---|
| Quadrant D | 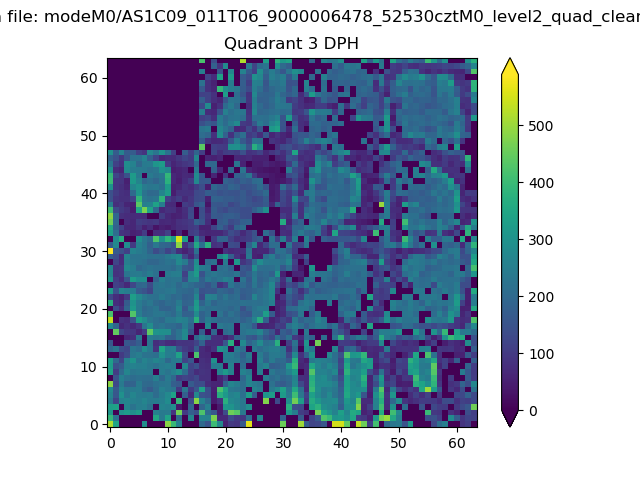 |
 |
Quadrant C |
| Plot type | Count rate plots | Images |
|---|---|---|
| Comparison with Poisson distribution Blue bars denote a histogram of data divided into 1 sec bins. Red curve is a Poisson curve with rate = median count rate of data. |
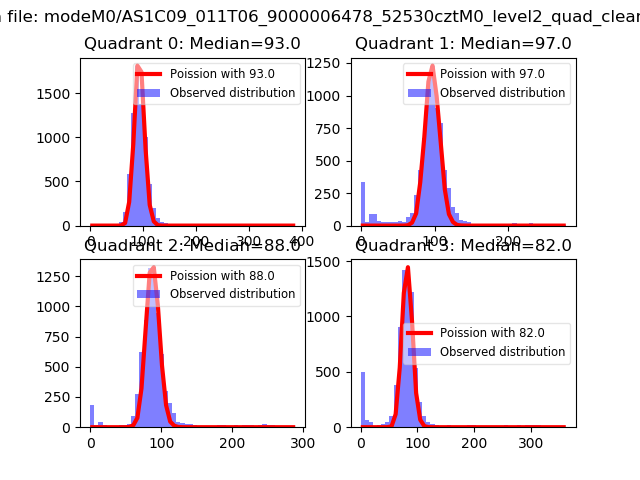 |
 |
| Quadrant-wise count rates Data is divided into 100 sec bins |
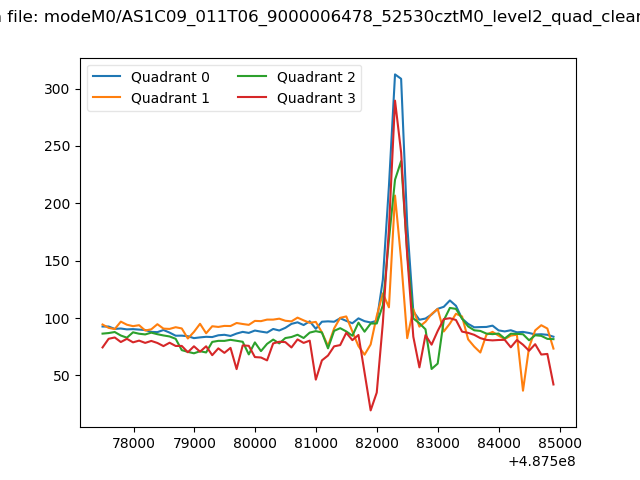 |
|
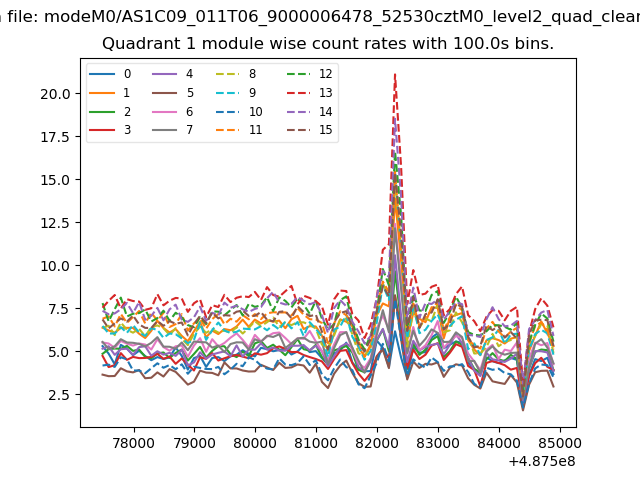
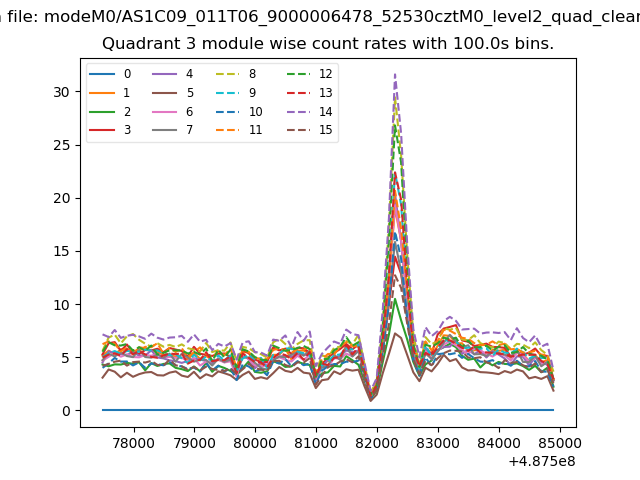
| Module-wise count rates for Quadrant A Data is divided into 100 sec bins |
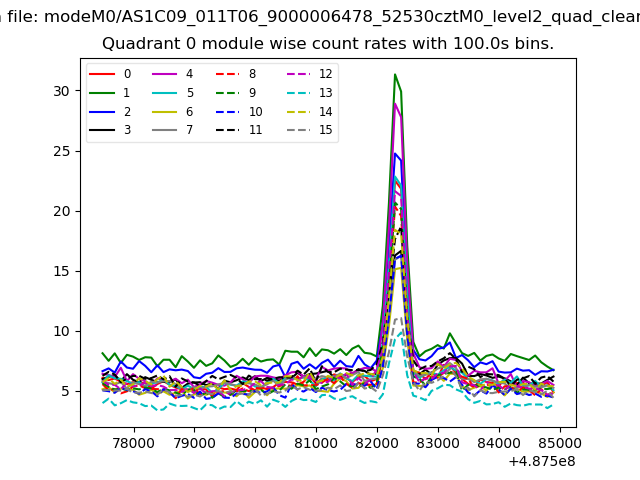 |
 |
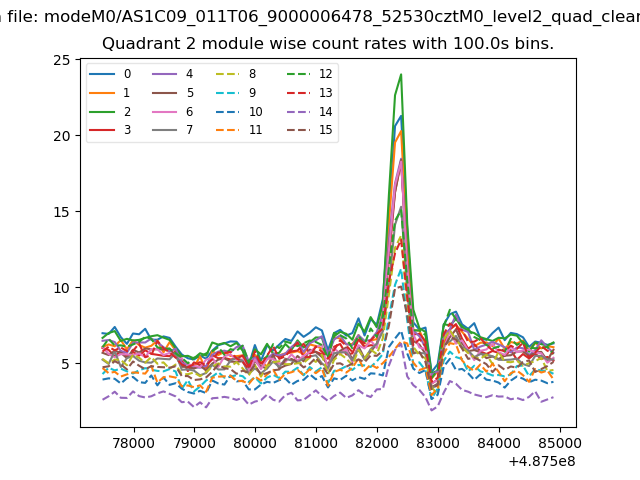
| Module-wise count rates for Quadrant B Data is divided into 100 sec bins |
 |
 |
| Module-wise count rates for Quadrant C Data is divided into 100 sec bins |
 |
 |
| Module-wise count rates for Quadrant D Data is divided into 100 sec bins |
 |
 |
| Parameter | Plot |
|---|---|
| CZT HV Monitor | 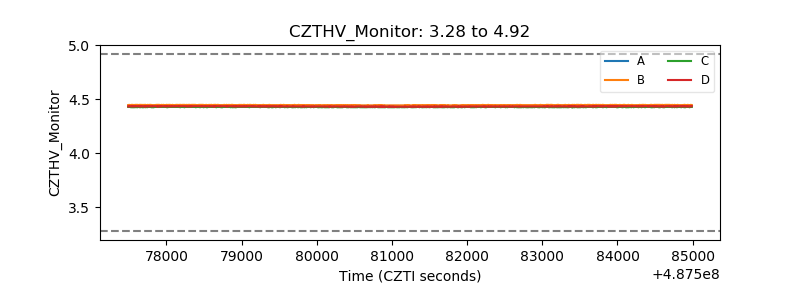 |
| D_VDD | 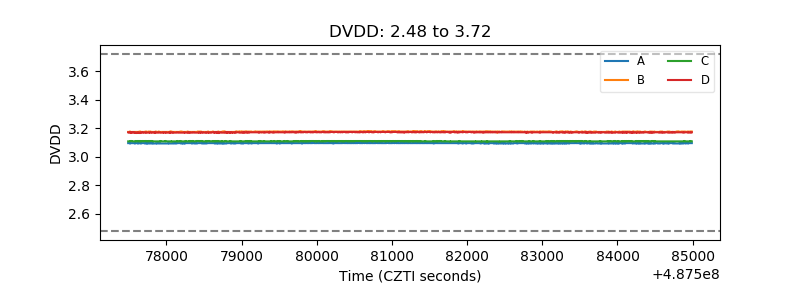 |
| Temperature 1 | 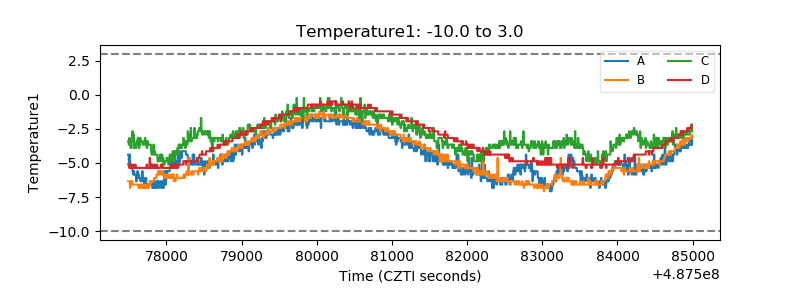 |
| Veto HV Monitor | 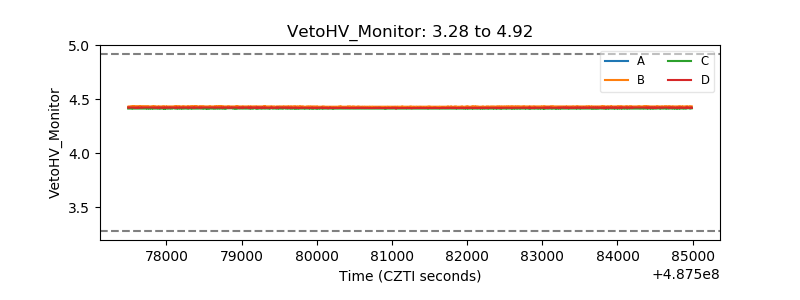 |
| Veto LLD | 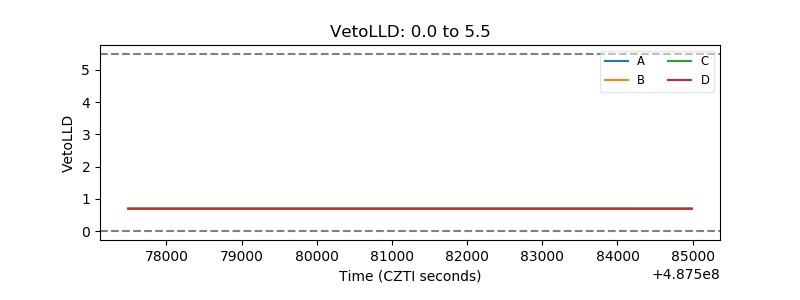 |
| Alpha Counter | 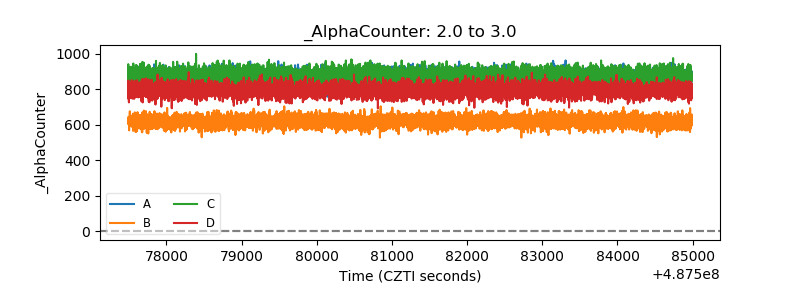 |
| _CPM_Rate | 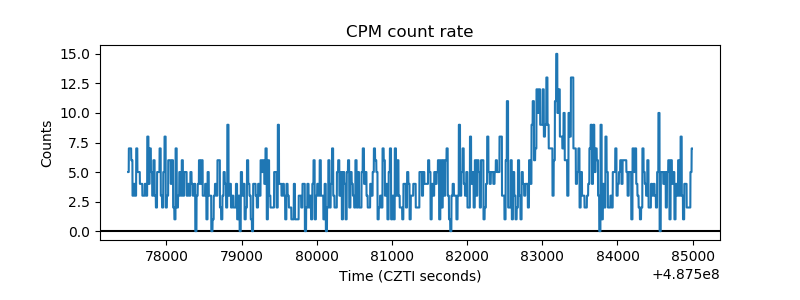 |
| CZT Counter | 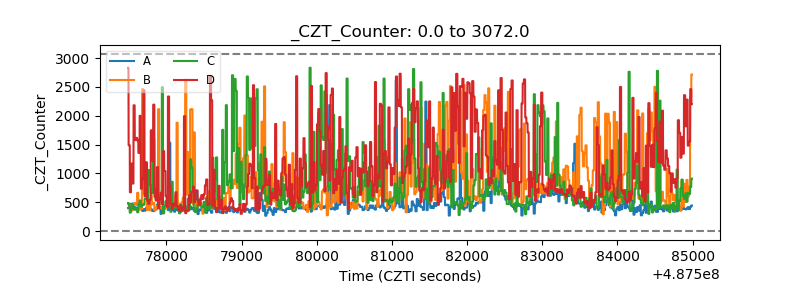 |
| +2.5 Volts monitor | 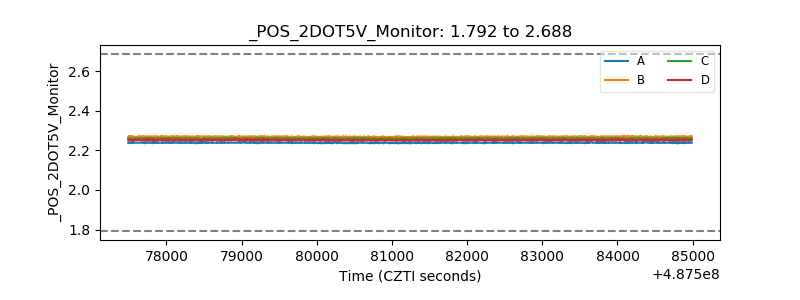 |
| +5 Volts monitor |  |
| _ROLL_ROT | 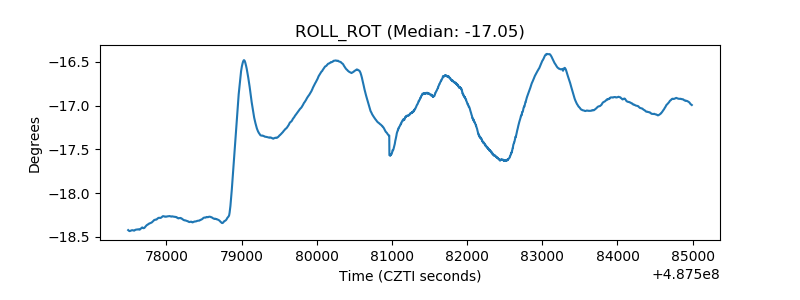 |
| _Roll_DEC | 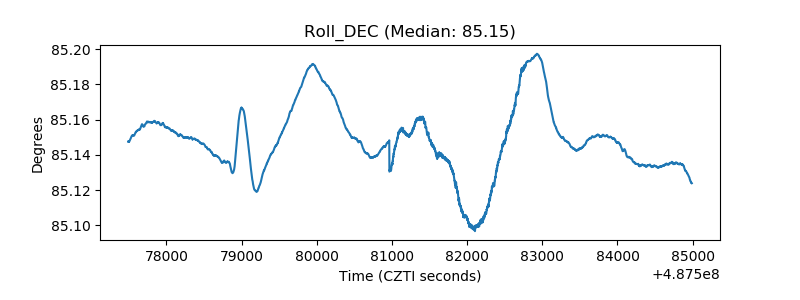 |
| _Roll_RA | 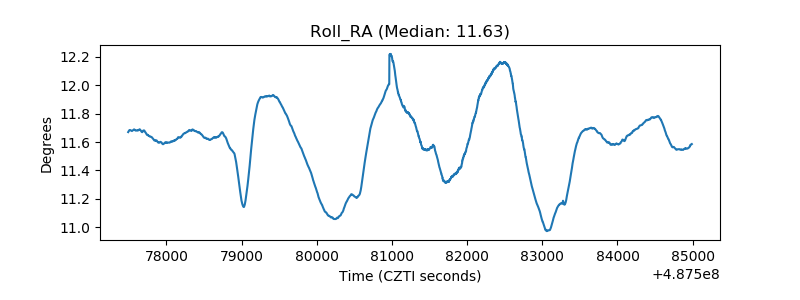 |
| Veto Counter | 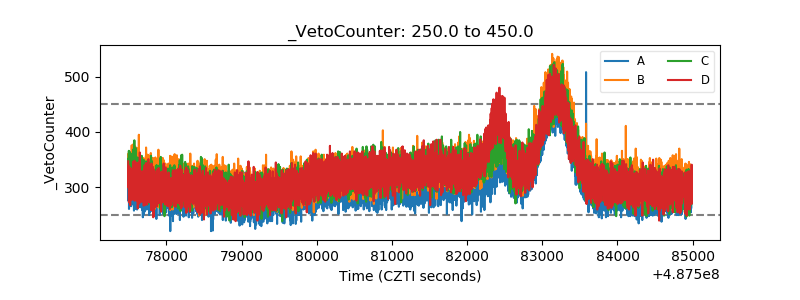 |