| Param | Original file | Final file |
|---|---|---|
| Filename | modeM0/AS1C09_011T06_9000006478_52545cztM0_level2.fits | modeM0/AS1C09_011T06_9000006478_52545cztM0_level2_quad_clean.evt |
| Size (bytes) | 786,686,400 | 93,107,520 |
| Size | 750.2 MB | 88.8 MB |
| Events in quadrant A | 3,387,887 | 677,963 |
| Events in quadrant B | 6,692,759 | 654,711 |
| Events in quadrant C | 5,780,763 | 611,177 |
| Events in quadrant D | 12,692,318 | 365,167 |
| Mode M0 | |||
|---|---|---|---|
| Quadrant | BADHDUFLAG | Total packets | Discarded packets |
| A | 0 | 15600 | 0 |
| B | 0 | 24980 | 0 |
| C | 0 | 22549 | 0 |
| D | 0 | 42826 | 0 |
| Mode SS | |||
|---|---|---|---|
| Quadrant | BADHDUFLAG | Total packets | Discarded packets |
| A | 0 | 146 | 0 |
| B | 0 | 146 | 0 |
| C | 0 | 146 | 0 |
| D | 0 | 146 | 0 |
| Quadrant | Total seconds | Saturated seconds | Saturation percentage |
|---|---|---|---|
| A | 7324 | 14 | 0.191152% |
| B | 7325 | 806 | 11.003413% |
| C | 7325 | 568 | 7.754266% |
| D | 7325 | 3194 | 43.604096% |
Noise dominated data is calculated using 1-second bins in cleaned event files. If a bin has >2000 counts, and if more than 50% of those come from <1% of pixels, then it is considered to be noise-dominated and hence unusable.
| Quadrant | # 1 sec bins | Bins with >0 counts | Bins with >2000 counts | High rate bins dominated by noise | Noise dominated (total time) | Noise dominated (detector-on time) | Marked lightcurve |
|---|---|---|---|---|---|---|---|
| A | 7324 | 7324 | 6 | 6 | 0.08% | 0.08% | 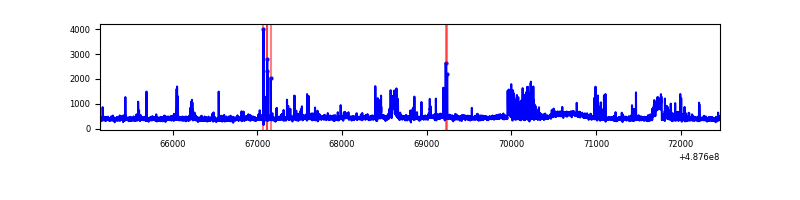 |
| B | 7325 | 7325 | 554 | 554 | 7.56% | 7.56% | 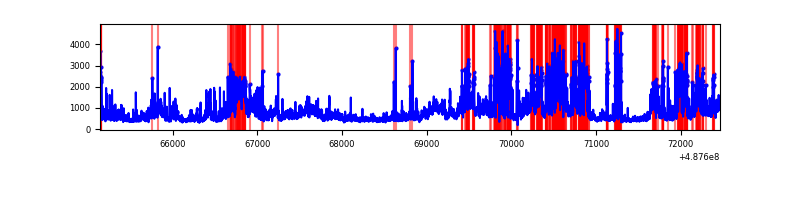 |
| C | 7325 | 7325 | 494 | 494 | 6.74% | 6.74% | 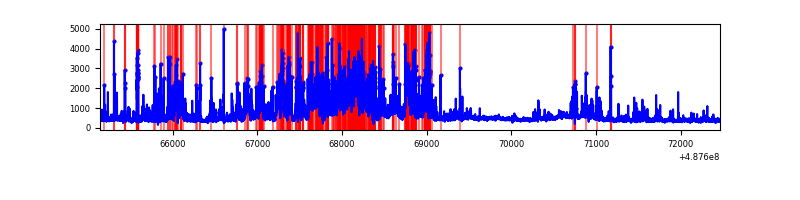 |
| D | 7325 | 7325 | 2900 | 2900 | 39.59% | 39.59% | 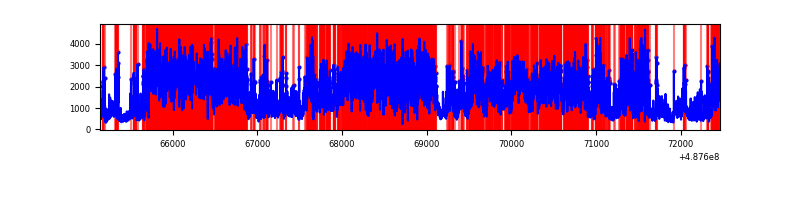 |
Top three noisy pixels from each quadrant. If the there are fewer than three noisy pixels in the level2.evt file, extra rows are filled as -1
| Pixel properties | Quadrant properties | ||||||
|---|---|---|---|---|---|---|---|
| Quadrant | DetID | PixID | Counts | Sigma | Mean | Median | Sigma |
| A | 8 | 249 | 123547 | 661.61 | 754 | 736 | 185.6 |
| A | 3 | 47 | 42580 | 225.42 | 754 | 736 | 185.6 |
| A | 6 | 82 | 38357 | 202.67 | 754 | 736 | 185.6 |
| B | 10 | 44 | 1757840 | 11714.14 | 709 | 685 | 150.0 |
| B | 10 | 254 | 765748 | 5100.32 | 709 | 685 | 150.0 |
| B | 7 | 0 | 567052 | 3775.71 | 709 | 685 | 150.0 |
| C | 15 | 248 | 1380374 | 7124.05 | 704 | 697 | 193.7 |
| C | 13 | 3 | 959656 | 4951.65 | 704 | 697 | 193.7 |
| C | 4 | 5 | 369711 | 1905.43 | 704 | 697 | 193.7 |
| D | 6 | 42 | 8075062 | 48331.14 | 586 | 557 | 167.1 |
| D | 15 | 93 | 569773 | 3407.12 | 586 | 557 | 167.1 |
| D | 8 | 176 | 469615 | 2807.61 | 586 | 557 | 167.1 |
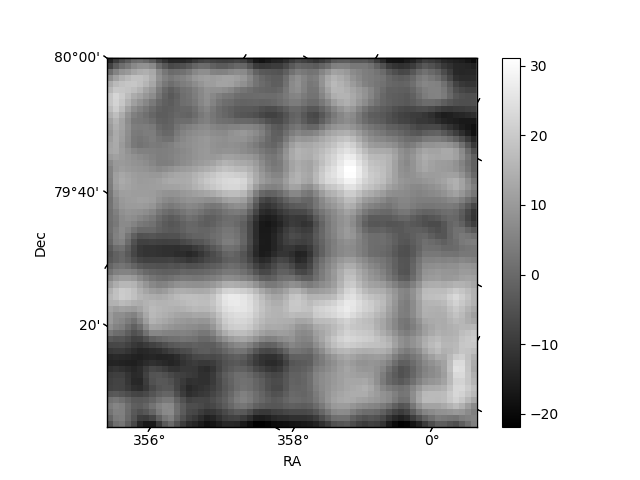
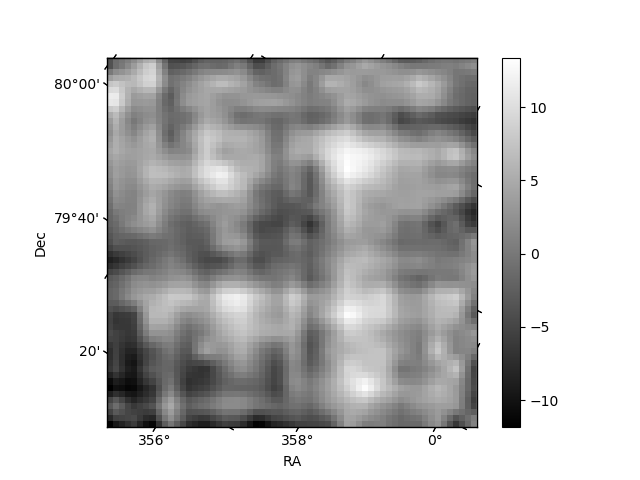
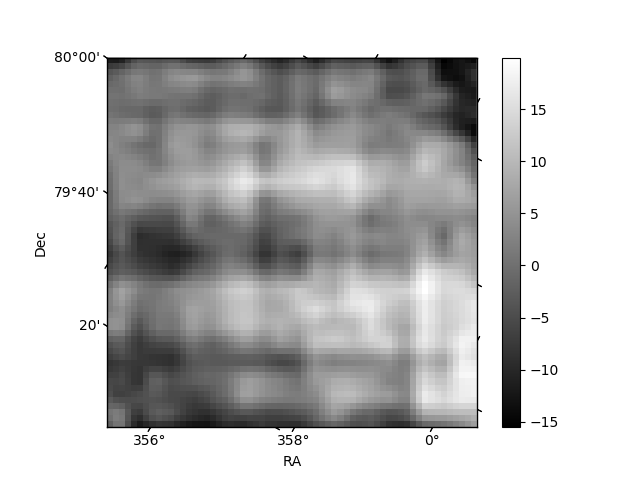
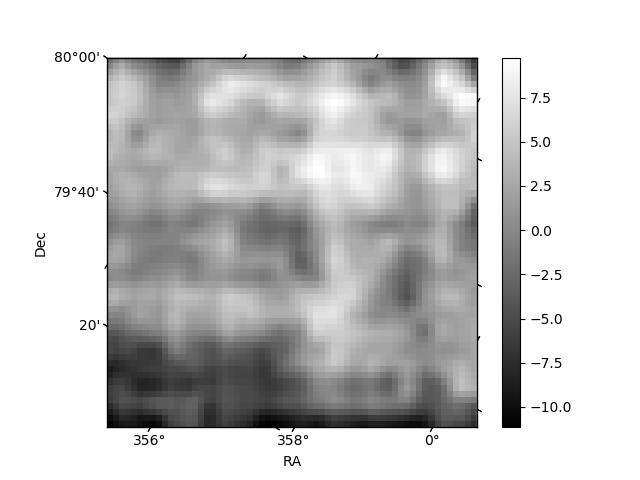
Histogram calculated using DETX and DETY for each event in the final _common_clean file
| Quadrant A | 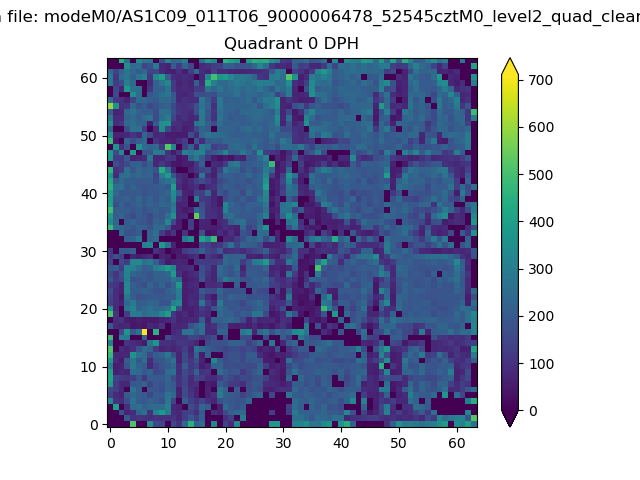 |
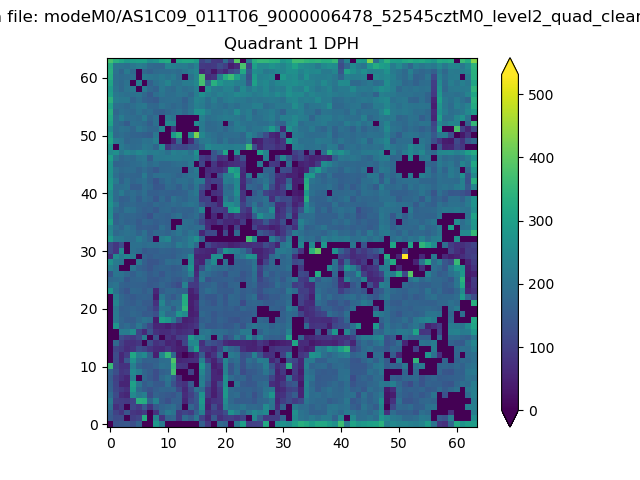 |
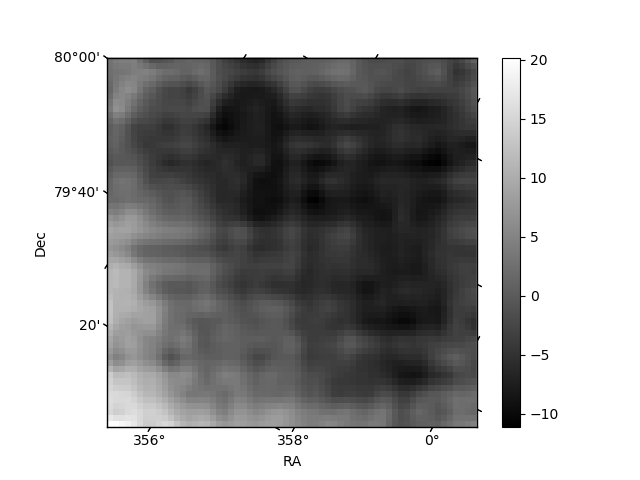
Quadrant B |
|---|---|---|---|
| Quadrant D | 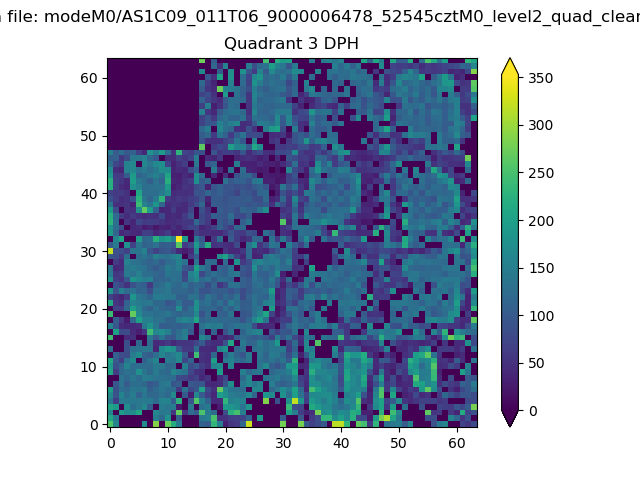 |
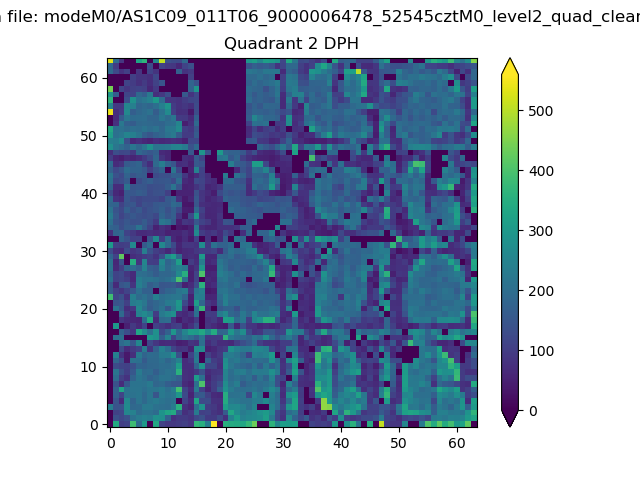 |
Quadrant C |
| Plot type | Count rate plots | Images |
|---|---|---|
| Comparison with Poisson distribution Blue bars denote a histogram of data divided into 1 sec bins. Red curve is a Poisson curve with rate = median count rate of data. |
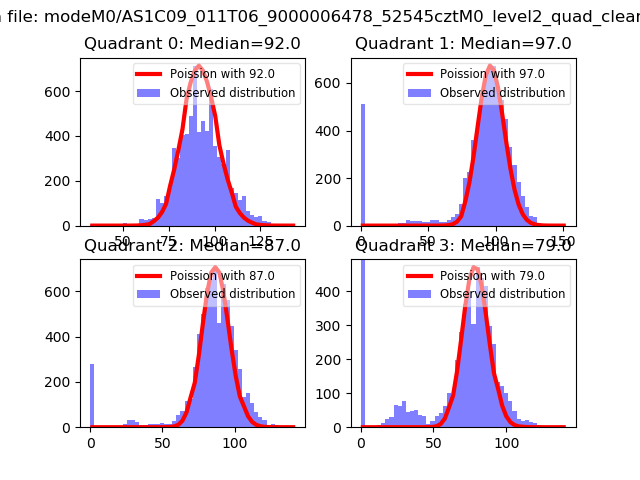 |
 |
| Quadrant-wise count rates Data is divided into 100 sec bins |
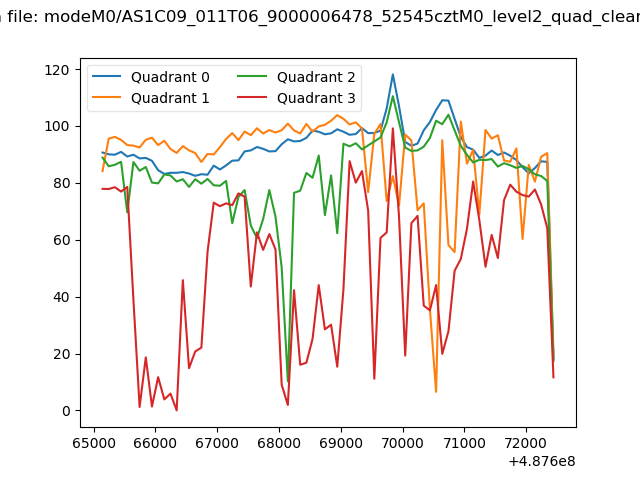 |
|
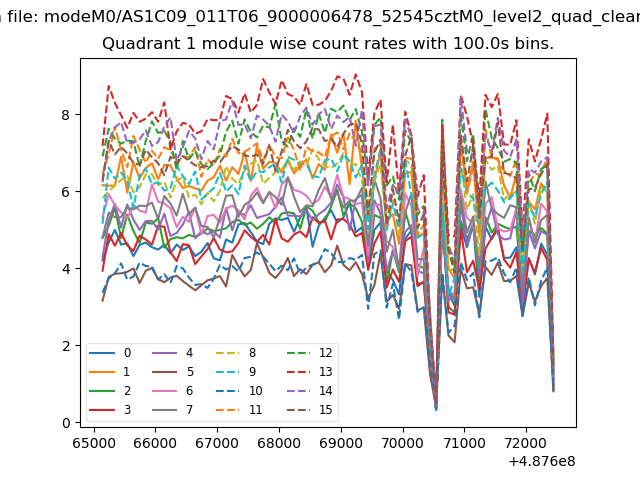
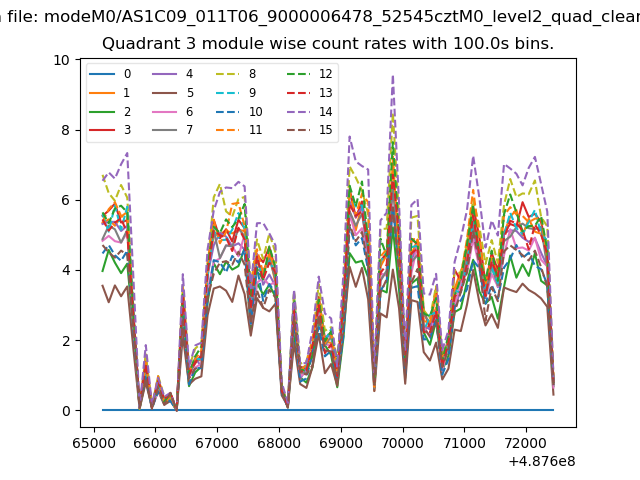
| Module-wise count rates for Quadrant A Data is divided into 100 sec bins |
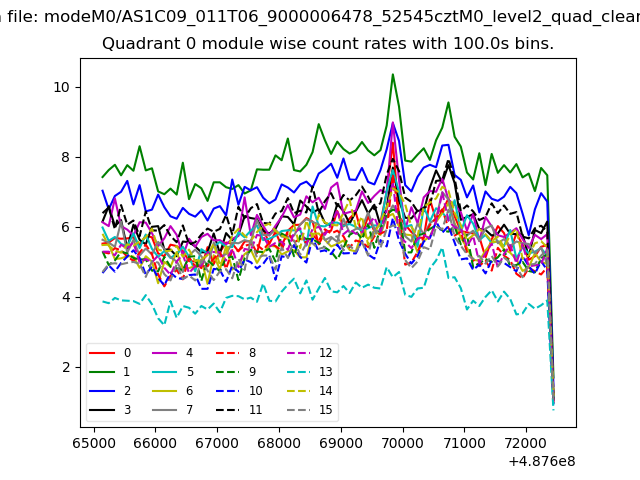 |
 |
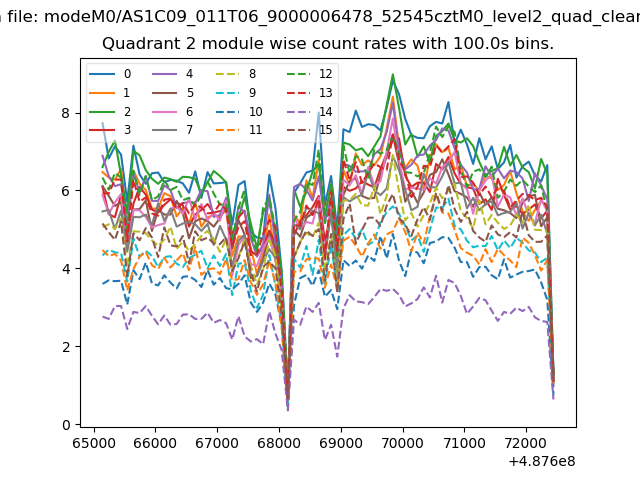
| Module-wise count rates for Quadrant B Data is divided into 100 sec bins |
 |
 |
| Module-wise count rates for Quadrant C Data is divided into 100 sec bins |
 |
 |
| Module-wise count rates for Quadrant D Data is divided into 100 sec bins |
 |
 |
| Parameter | Plot |
|---|---|
| CZT HV Monitor | 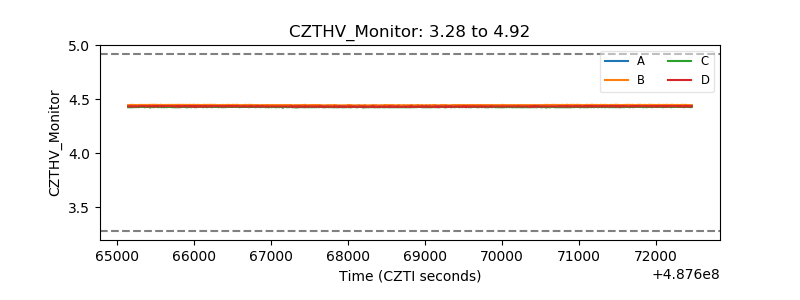 |
| D_VDD | 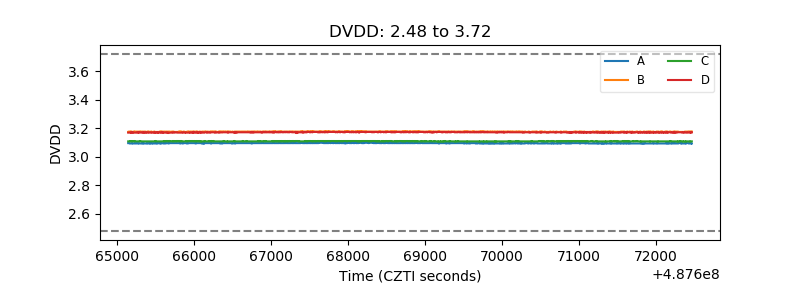 |
| Temperature 1 | 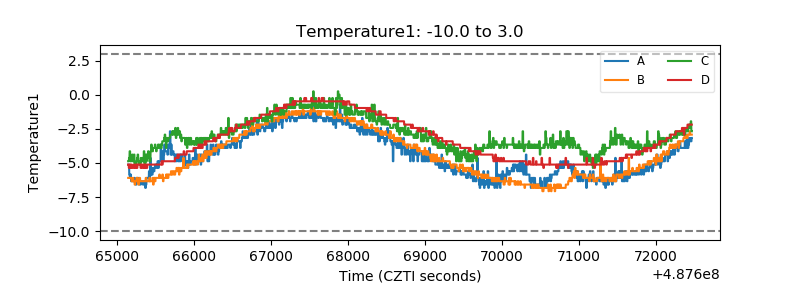 |
| Veto HV Monitor | 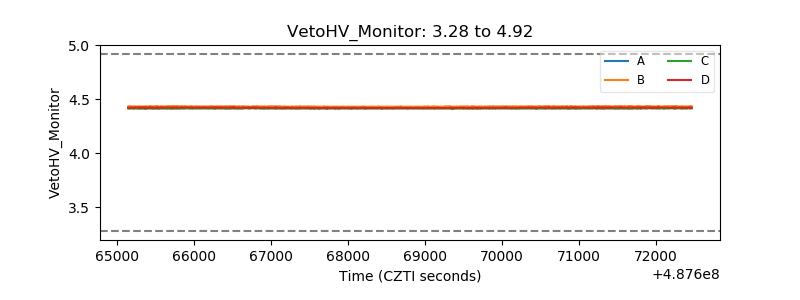 |
| Veto LLD | 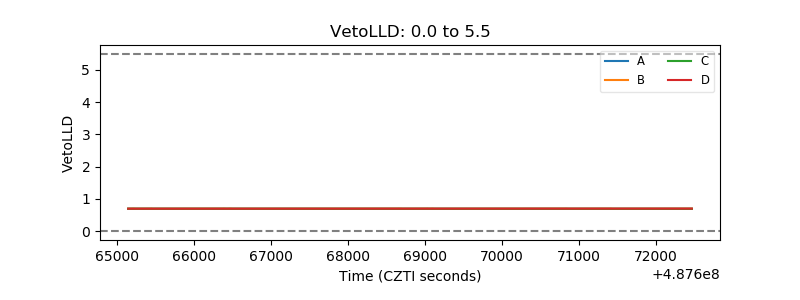 |
| Alpha Counter | 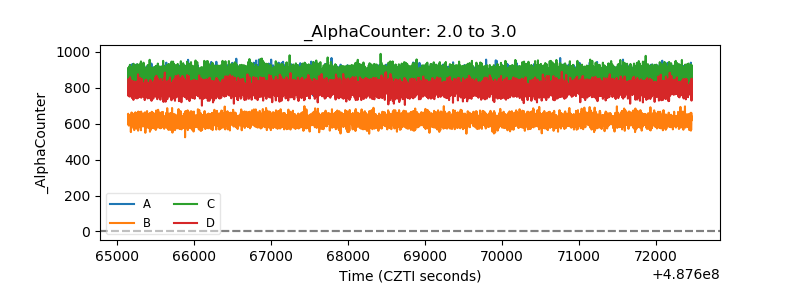 |
| _CPM_Rate | 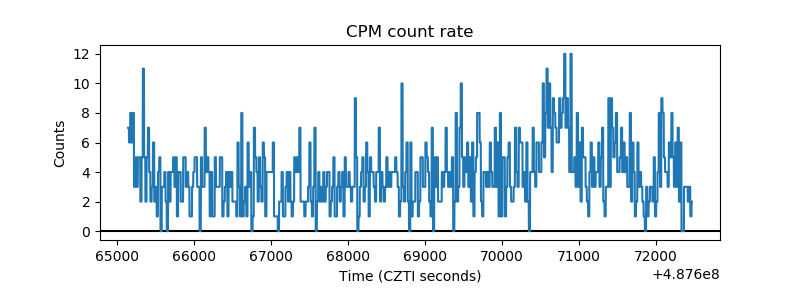 |
| CZT Counter | 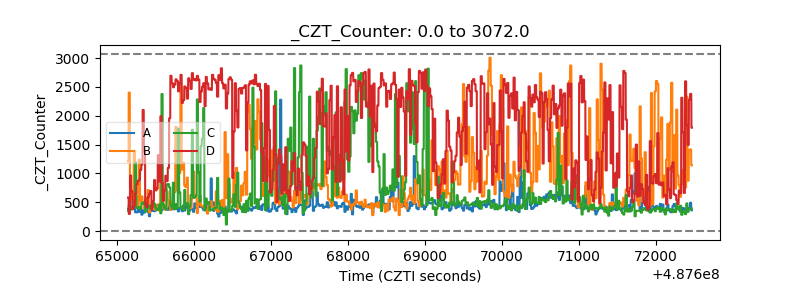 |
| +2.5 Volts monitor | 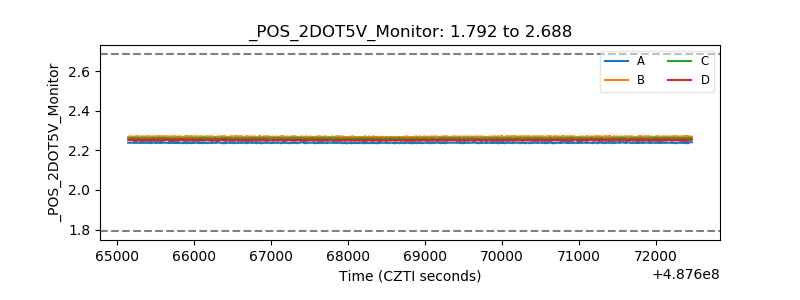 |
| +5 Volts monitor |  |
| _ROLL_ROT | 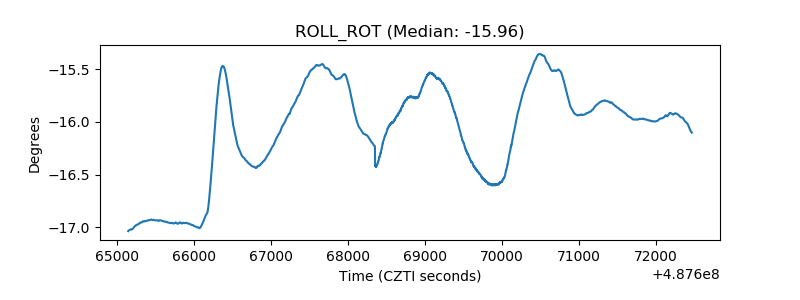 |
| _Roll_DEC | 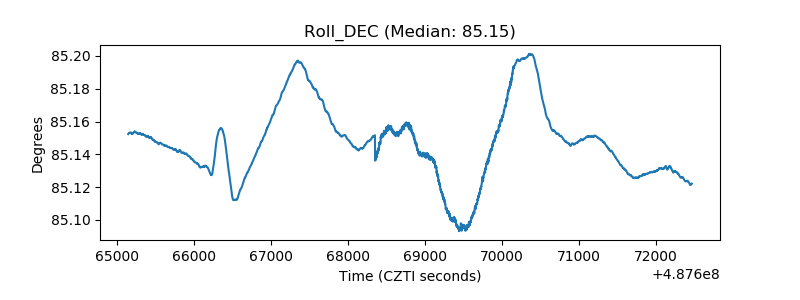 |
| _Roll_RA | 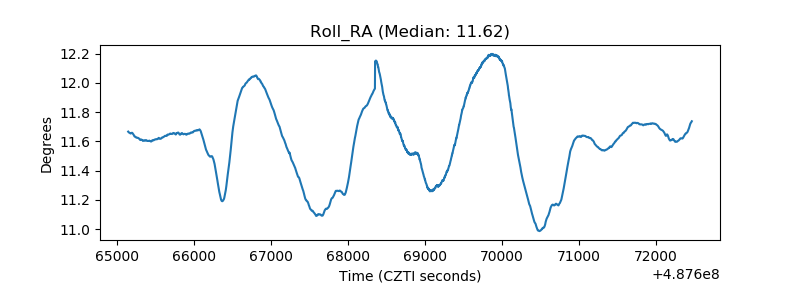 |
| Veto Counter | 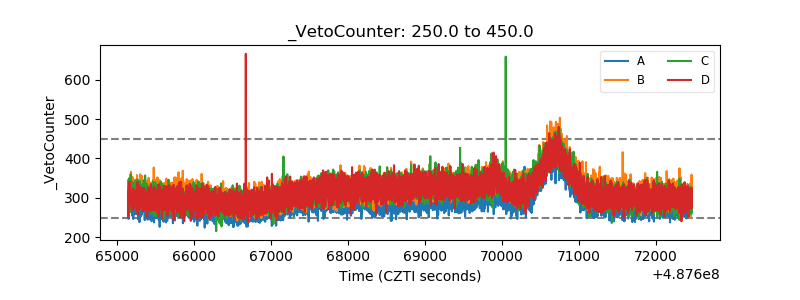 |