| Param | Original file | Final file |
|---|---|---|
| Filename | modeM0/AS1C09_011T06_9000006478_52596cztM0_level2.fits | modeM0/AS1C09_011T06_9000006478_52596cztM0_level2_quad_clean.evt |
| Size (bytes) | 990,216,000 | 67,867,200 |
| Size | 944.3 MB | 64.7 MB |
| Events in quadrant A | 3,544,340 | 609,147 |
| Events in quadrant B | 7,071,761 | 563,759 |
| Events in quadrant C | 12,246,185 | 221,844 |
| Events in quadrant D | 13,300,761 | 216,015 |
| Mode M0 | |||
|---|---|---|---|
| Quadrant | BADHDUFLAG | Total packets | Discarded packets |
| A | 0 | 15031 | 1 |
| B | 0 | 25412 | 1 |
| C | 0 | 40743 | 5 |
| D | 0 | 43869 | 1 |
| Mode M9 | |||
|---|---|---|---|
| Quadrant | BADHDUFLAG | Total packets | Discarded packets |
| A | 0 | 10 | 0 |
| B | 0 | 10 | 0 |
| C | 0 | 10 | 0 |
| D | 0 | 10 | 0 |
| Mode SS | |||
|---|---|---|---|
| Quadrant | BADHDUFLAG | Total packets | Discarded packets |
| A | 0 | 128 | 0 |
| B | 0 | 128 | 0 |
| C | 0 | 128 | 0 |
| D | 0 | 128 | 0 |
| Quadrant | Total seconds | Saturated seconds | Saturation percentage |
|---|---|---|---|
| A | 6361 | 194 | 3.049835% |
| B | 6362 | 1096 | 17.227287% |
| C | 6361 | 4196 | 65.964471% |
| D | 6361 | 4374 | 68.762773% |
Noise dominated data is calculated using 1-second bins in cleaned event files. If a bin has >2000 counts, and if more than 50% of those come from <1% of pixels, then it is considered to be noise-dominated and hence unusable.
| Quadrant | # 1 sec bins | Bins with >0 counts | Bins with >2000 counts | High rate bins dominated by noise | Noise dominated (total time) | Noise dominated (detector-on time) | Marked lightcurve |
|---|---|---|---|---|---|---|---|
| A | 7365 | 6360 | 140 | 140 | 1.90% | 2.20% | 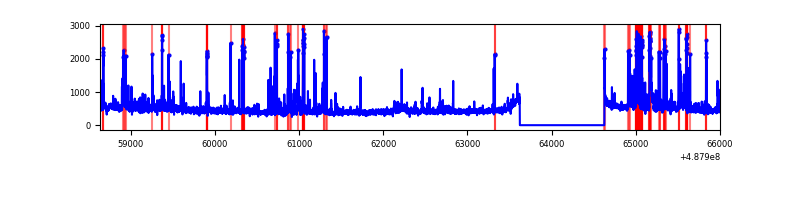 |
| B | 7366 | 6361 | 845 | 845 | 11.47% | 13.28% | 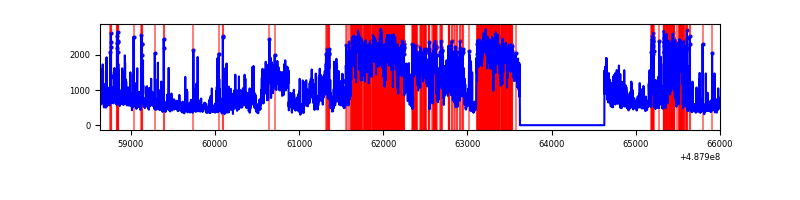 |
| C | 7365 | 6360 | 3613 | 3613 | 49.06% | 56.81% | 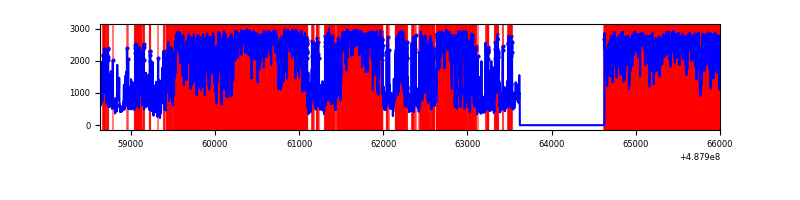 |
| D | 7365 | 6360 | 4196 | 4196 | 56.97% | 65.97% | 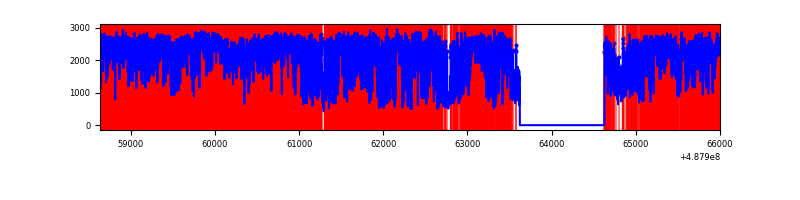 |
Top three noisy pixels from each quadrant. If the there are fewer than three noisy pixels in the level2.evt file, extra rows are filled as -1
| Pixel properties | Quadrant properties | ||||||
|---|---|---|---|---|---|---|---|
| Quadrant | DetID | PixID | Counts | Sigma | Mean | Median | Sigma |
| A | 4 | 249 | 308618 | 1821.65 | 668 | 651 | 169.1 |
| A | 5 | 243 | 193245 | 1139.21 | 668 | 651 | 169.1 |
| A | 3 | 114 | 76525 | 448.8 | 668 | 651 | 169.1 |
| B | 10 | 254 | 3067886 | 22674.66 | 639 | 618 | 135.3 |
| B | 10 | 128 | 401203 | 2961.31 | 639 | 618 | 135.3 |
| B | 15 | 219 | 394191 | 2909.47 | 639 | 618 | 135.3 |
| C | 15 | 248 | 10638076 | 111741.41 | 338 | 335 | 95.2 |
| C | 15 | 233 | 79221 | 828.64 | 338 | 335 | 95.2 |
| C | 13 | 3 | 45472 | 474.13 | 338 | 335 | 95.2 |
| D | 12 | 1 | 3233403 | 26760.02 | 419 | 401 | 120.8 |
| D | 15 | 125 | 2771298 | 22935.11 | 419 | 401 | 120.8 |
| D | 8 | 176 | 2664711 | 22052.88 | 419 | 401 | 120.8 |
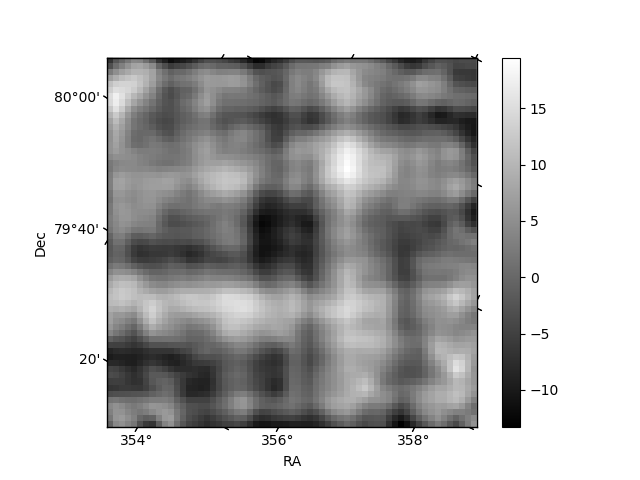
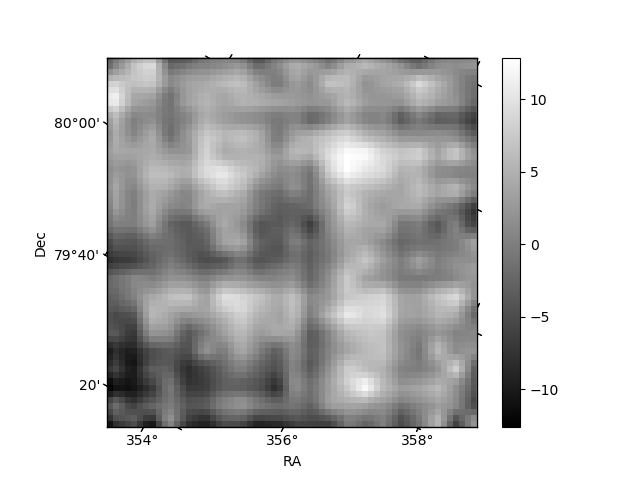
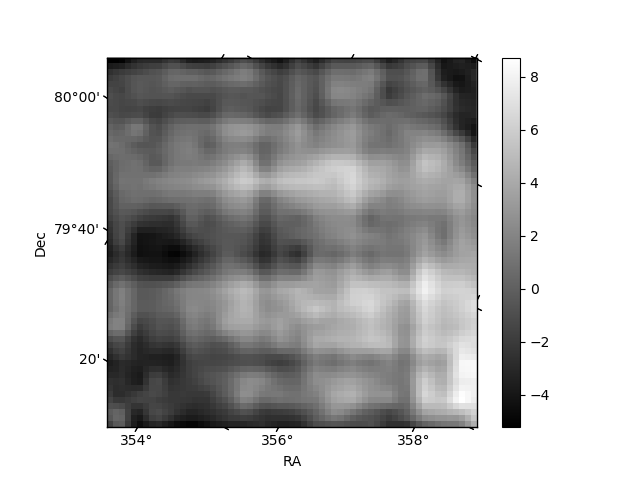
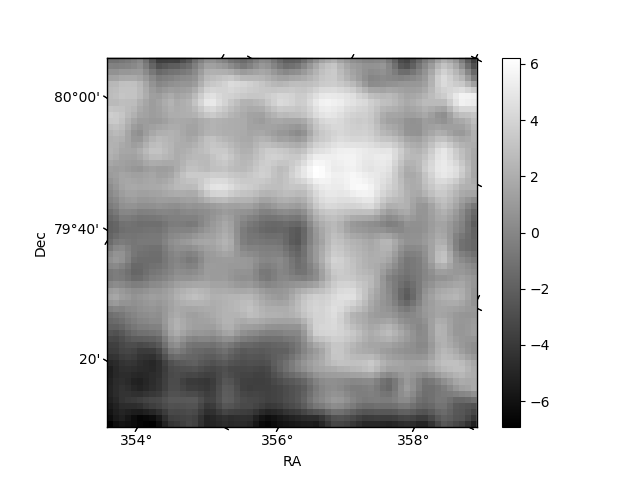
Histogram calculated using DETX and DETY for each event in the final _common_clean file
| Quadrant A | 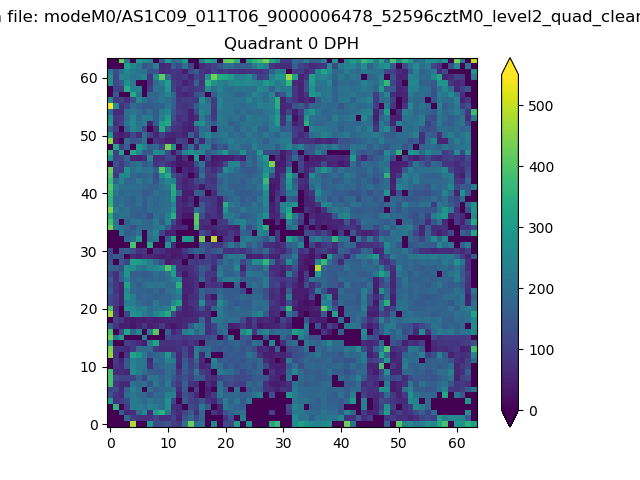 |
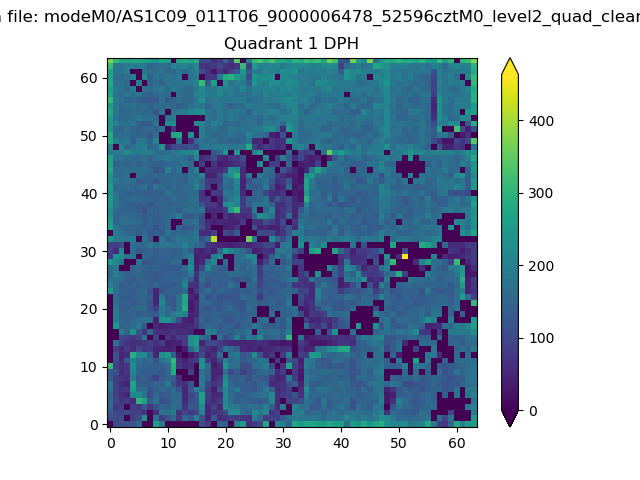 |
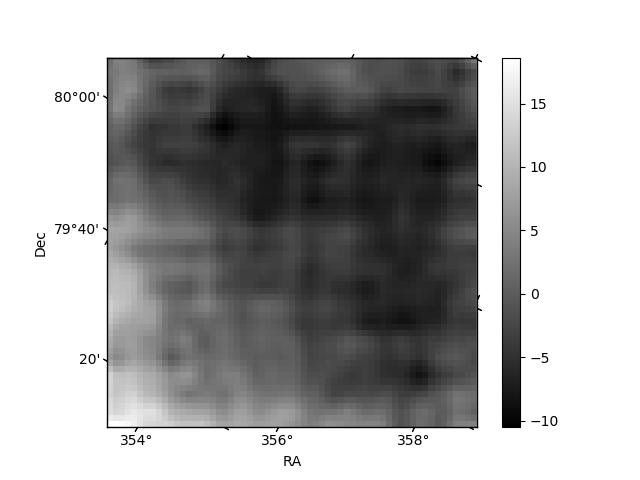
Quadrant B |
|---|---|---|---|
| Quadrant D | 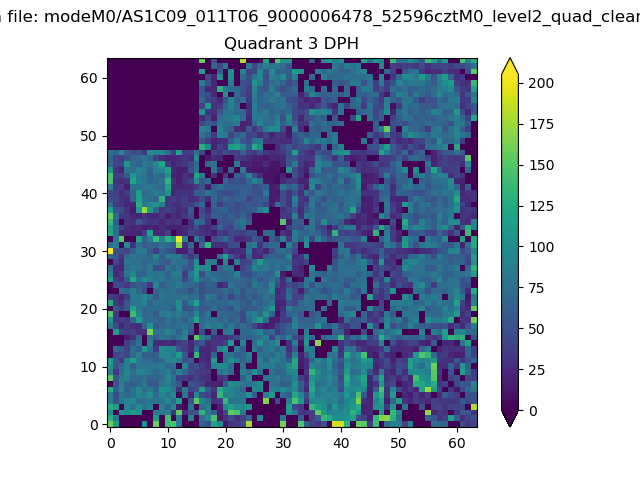 |
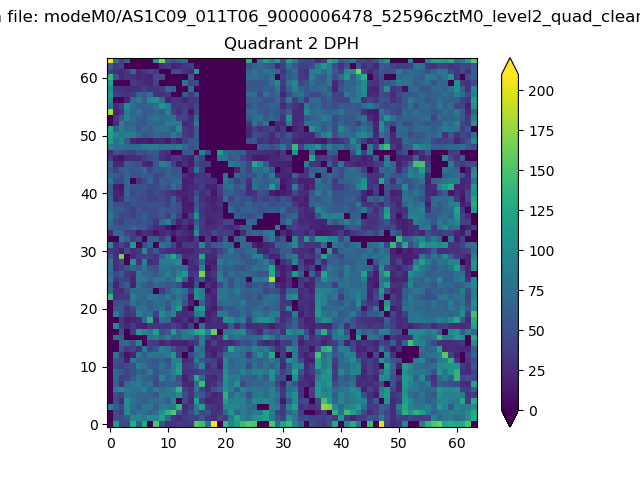 |
Quadrant C |
| Plot type | Count rate plots | Images |
|---|---|---|
| Comparison with Poisson distribution Blue bars denote a histogram of data divided into 1 sec bins. Red curve is a Poisson curve with rate = median count rate of data. |
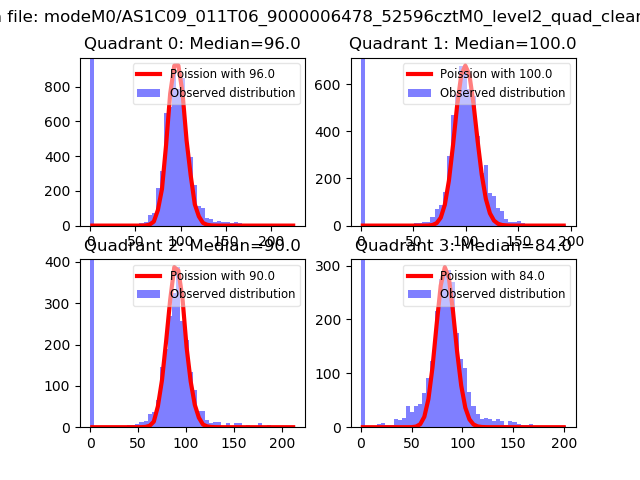 |
 |
| Quadrant-wise count rates Data is divided into 100 sec bins |
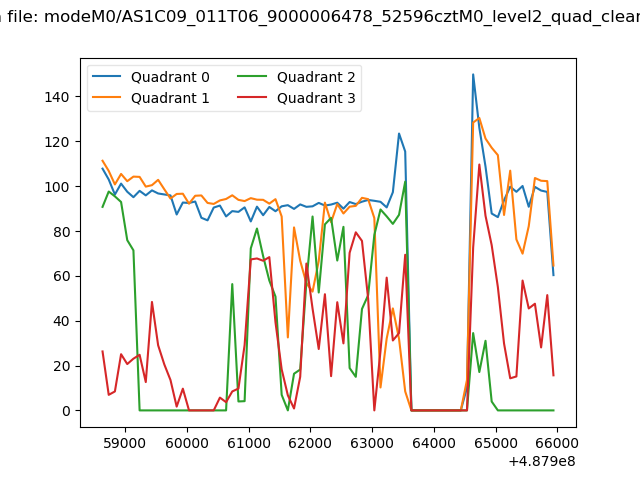 |
|
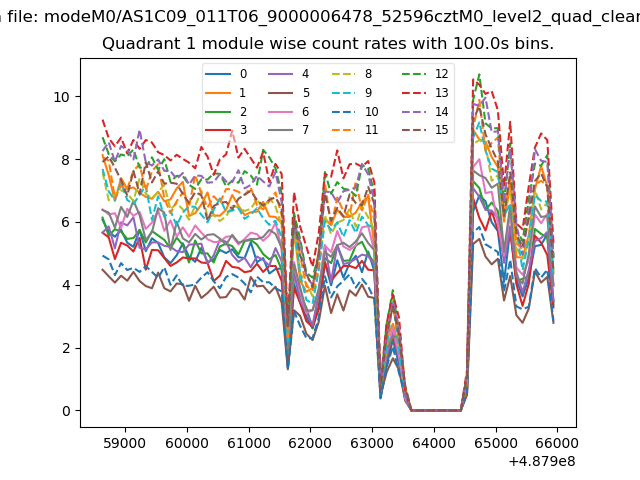
| Module-wise count rates for Quadrant A Data is divided into 100 sec bins |
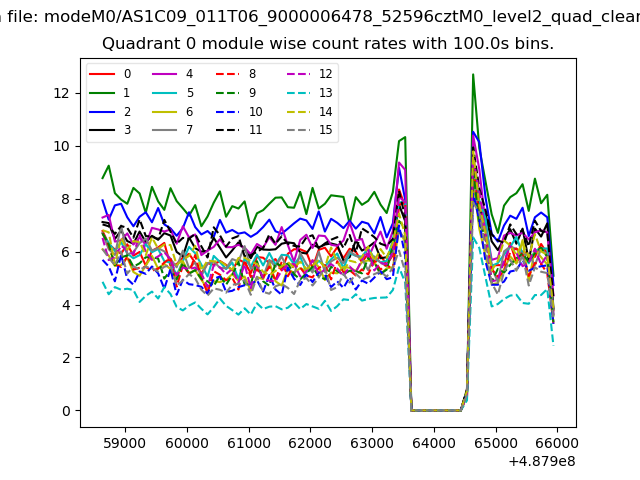 |
 |
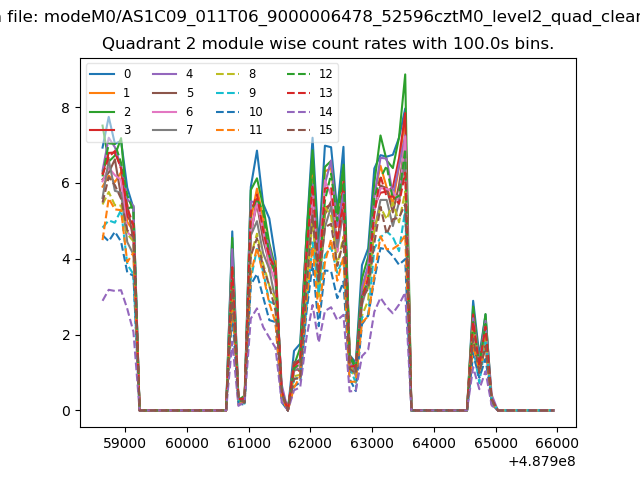
| Module-wise count rates for Quadrant B Data is divided into 100 sec bins |
 |
 |
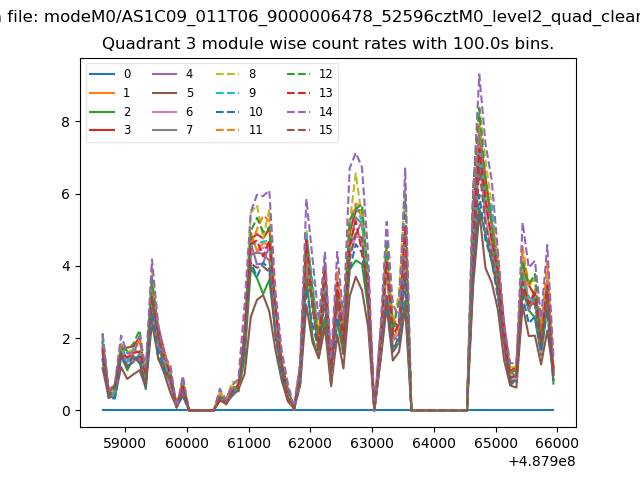
| Module-wise count rates for Quadrant C Data is divided into 100 sec bins |
 |
 |
| Module-wise count rates for Quadrant D Data is divided into 100 sec bins |
 |
 |
| Parameter | Plot |
|---|---|
| CZT HV Monitor | 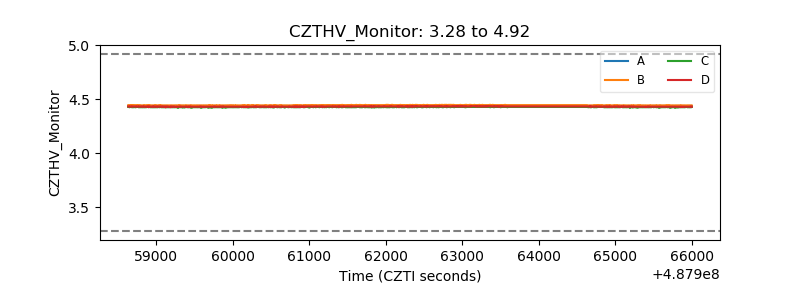 |
| D_VDD | 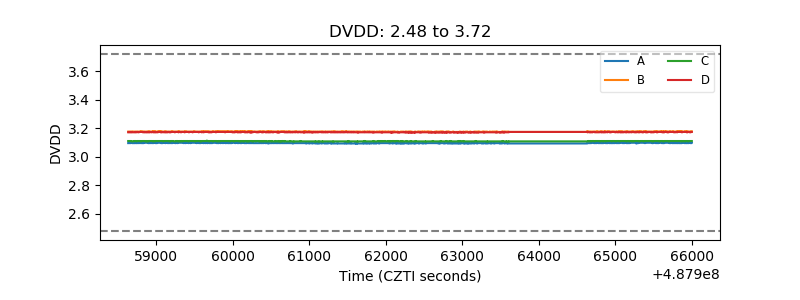 |
| Temperature 1 | 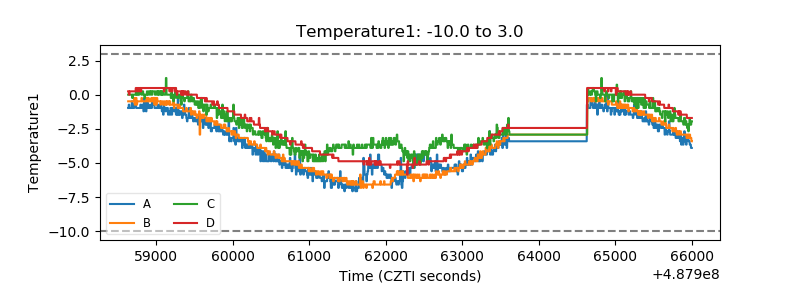 |
| Veto HV Monitor | 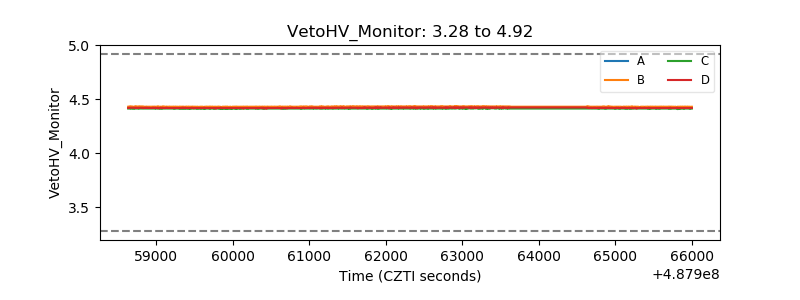 |
| Veto LLD | 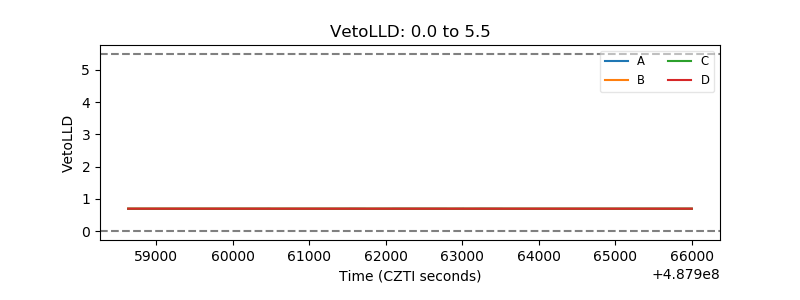 |
| Alpha Counter | 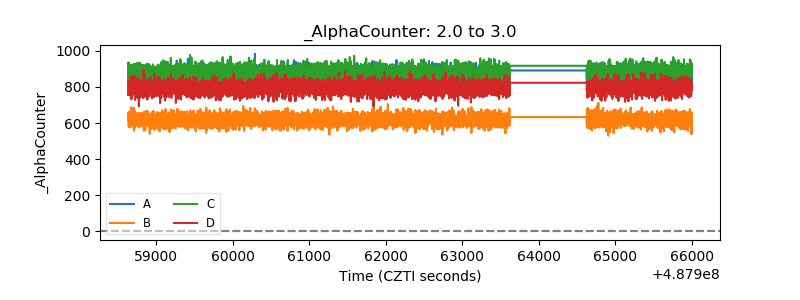 |
| _CPM_Rate | 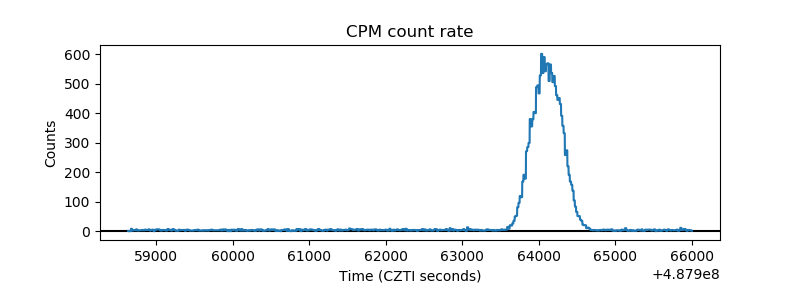 |
| CZT Counter | 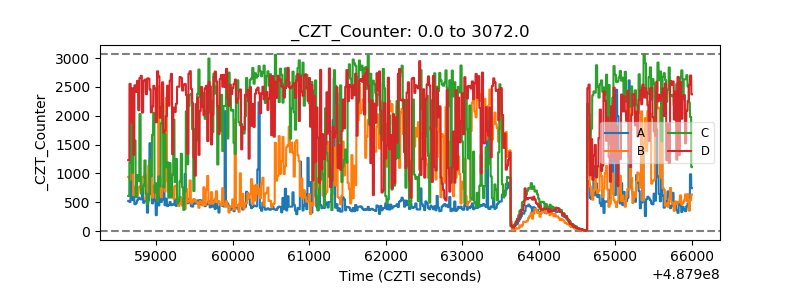 |
| +2.5 Volts monitor |  |
| +5 Volts monitor |  |
| _ROLL_ROT | 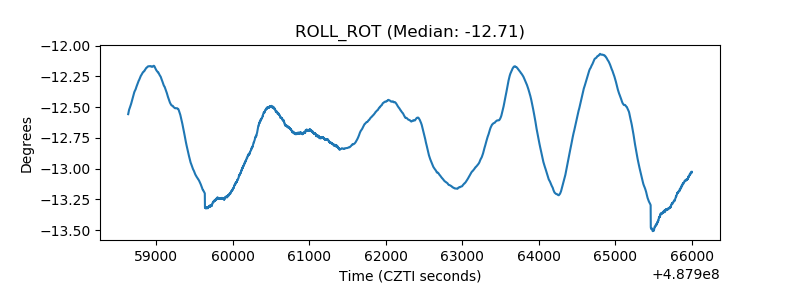 |
| _Roll_DEC | 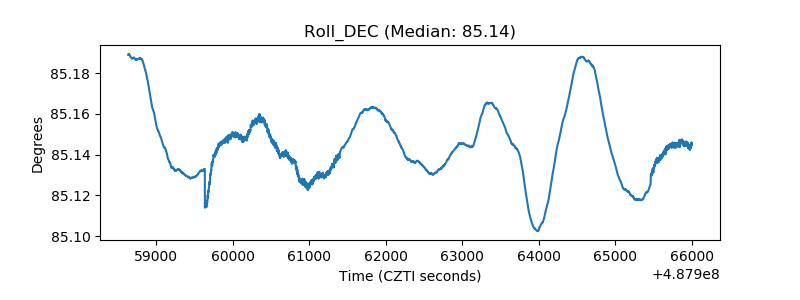 |
| _Roll_RA | 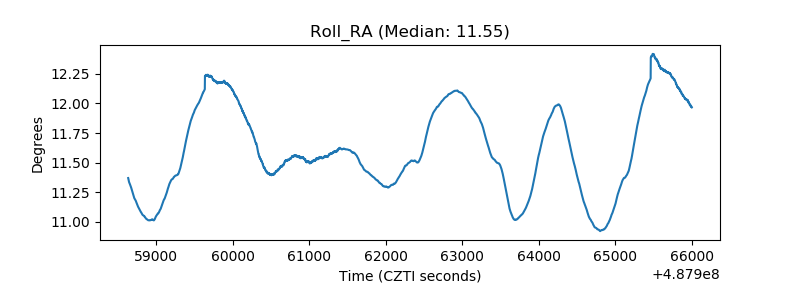 |
| Veto Counter | 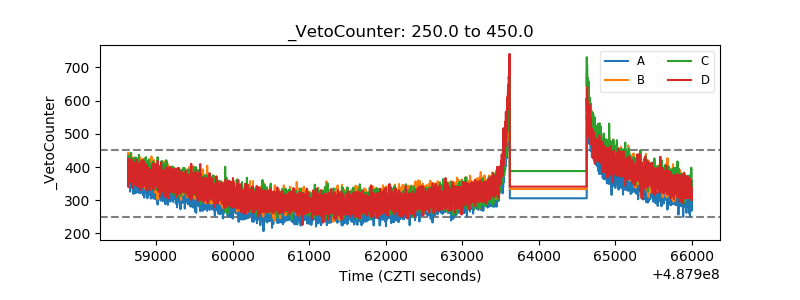 |