| Param | Original file | Final file |
|---|---|---|
| Filename | modeM0/AS1C09_011T06_9000006478_52598cztM0_level2.fits | modeM0/AS1C09_011T06_9000006478_52598cztM0_level2_quad_clean.evt |
| Size (bytes) | 995,489,280 | 72,990,720 |
| Size | 949.4 MB | 69.6 MB |
| Events in quadrant A | 4,530,060 | 599,917 |
| Events in quadrant B | 9,969,476 | 459,306 |
| Events in quadrant C | 9,471,280 | 438,654 |
| Events in quadrant D | 12,388,095 | 267,755 |
| Mode M0 | |||
|---|---|---|---|
| Quadrant | BADHDUFLAG | Total packets | Discarded packets |
| A | 0 | 17914 | 2 |
| B | 0 | 34077 | 8 |
| C | 0 | 32544 | 2 |
| D | 0 | 41170 | 2 |
| Mode M9 | |||
|---|---|---|---|
| Quadrant | BADHDUFLAG | Total packets | Discarded packets |
| A | 0 | 12 | 0 |
| B | 0 | 13 | 0 |
| C | 0 | 13 | 0 |
| D | 0 | 13 | 0 |
| Mode SS | |||
|---|---|---|---|
| Quadrant | BADHDUFLAG | Total packets | Discarded packets |
| A | 0 | 128 | 0 |
| B | 0 | 128 | 0 |
| C | 0 | 128 | 0 |
| D | 0 | 128 | 0 |
| Quadrant | Total seconds | Saturated seconds | Saturation percentage |
|---|---|---|---|
| A | 6366 | 436 | 6.848885% |
| B | 6365 | 2515 | 39.512962% |
| C | 6365 | 1977 | 31.060487% |
| D | 6365 | 3587 | 56.355067% |
Noise dominated data is calculated using 1-second bins in cleaned event files. If a bin has >2000 counts, and if more than 50% of those come from <1% of pixels, then it is considered to be noise-dominated and hence unusable.
| Quadrant | # 1 sec bins | Bins with >0 counts | Bins with >2000 counts | High rate bins dominated by noise | Noise dominated (total time) | Noise dominated (detector-on time) | Marked lightcurve |
|---|---|---|---|---|---|---|---|
| A | 7536 | 6367 | 381 | 381 | 5.06% | 5.98% | 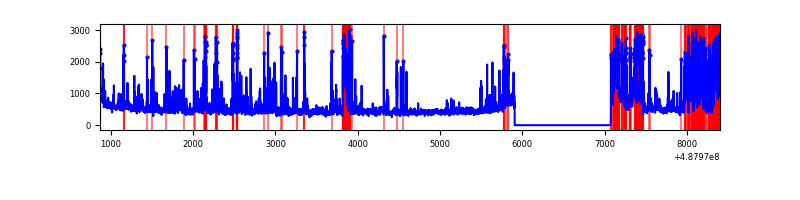 |
| B | 7535 | 6366 | 2406 | 2406 | 31.93% | 37.79% | 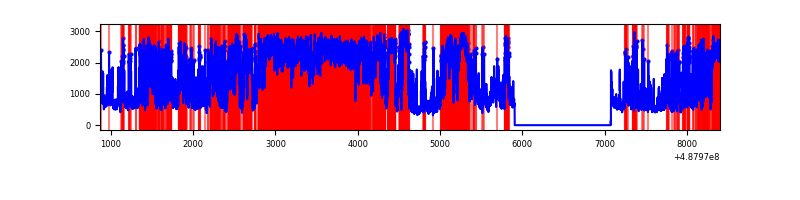 |
| C | 7535 | 6366 | 1980 | 1980 | 26.28% | 31.10% | 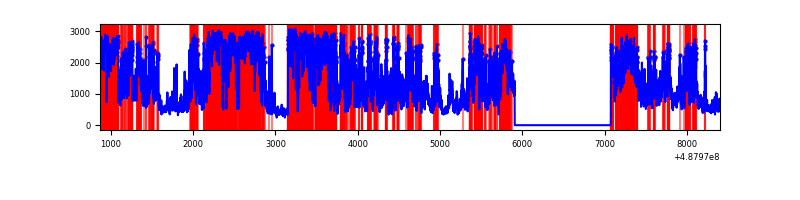 |
| D | 7535 | 6366 | 3674 | 3674 | 48.76% | 57.71% | 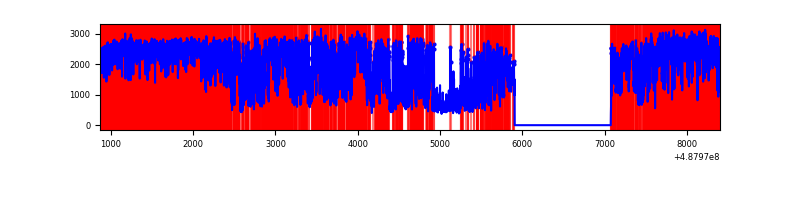 |
Top three noisy pixels from each quadrant. If the there are fewer than three noisy pixels in the level2.evt file, extra rows are filled as -1
| Pixel properties | Quadrant properties | ||||||
|---|---|---|---|---|---|---|---|
| Quadrant | DetID | PixID | Counts | Sigma | Mean | Median | Sigma |
| A | 4 | 249 | 783432 | 4733.81 | 656 | 640 | 165.4 |
| A | 3 | 114 | 334819 | 2020.89 | 656 | 640 | 165.4 |
| A | 3 | 14 | 138390 | 833.02 | 656 | 640 | 165.4 |
| B | 10 | 254 | 2873261 | 23109.33 | 584 | 564 | 124.3 |
| B | 10 | 128 | 2595759 | 20876.97 | 584 | 564 | 124.3 |
| B | 10 | 44 | 1256463 | 10103.04 | 584 | 564 | 124.3 |
| C | 15 | 248 | 6776825 | 41779.04 | 579 | 574 | 162.2 |
| C | 12 | 254 | 168706 | 1036.62 | 579 | 574 | 162.2 |
| C | 15 | 233 | 96357 | 590.55 | 579 | 574 | 162.2 |
| D | 12 | 16 | 3790644 | 27856.39 | 463 | 440 | 136.1 |
| D | 12 | 1 | 1749310 | 12853.45 | 463 | 440 | 136.1 |
| D | 15 | 125 | 1639484 | 12046.28 | 463 | 440 | 136.1 |
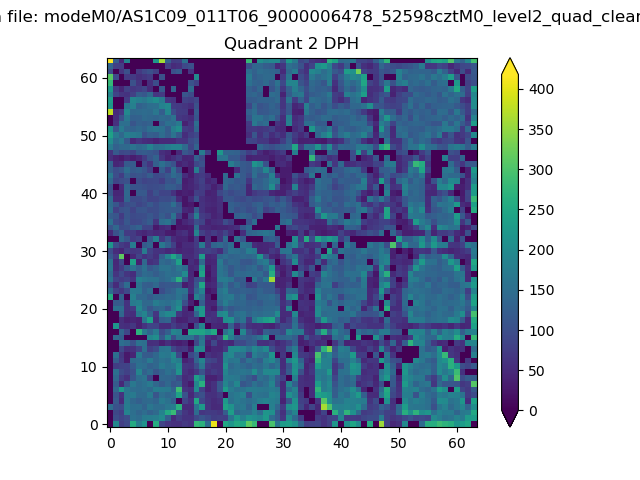
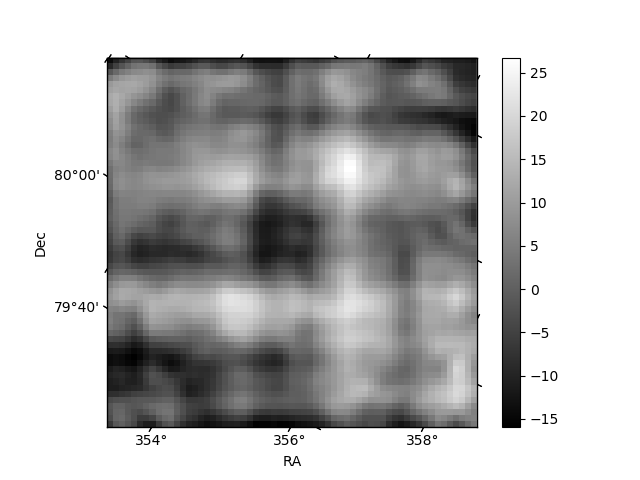
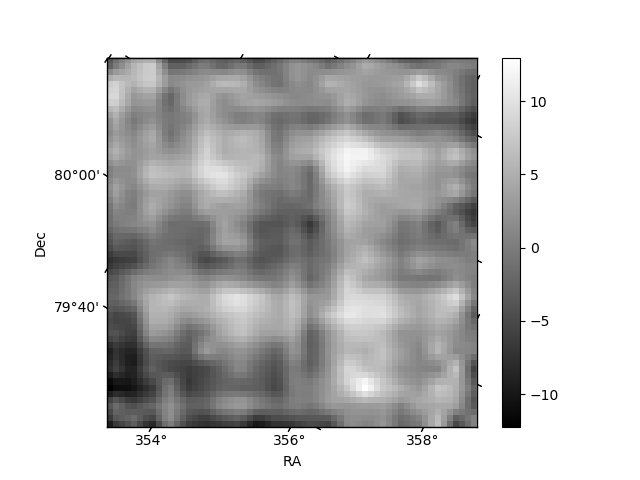
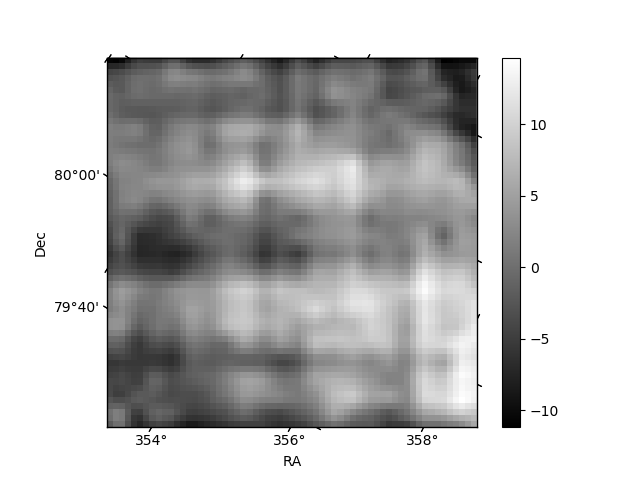
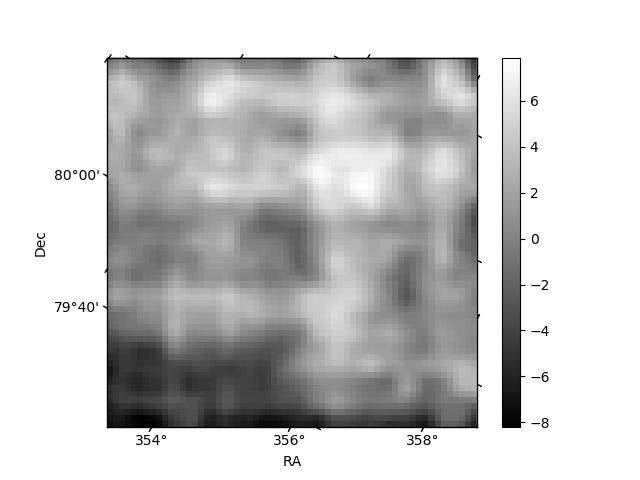
Histogram calculated using DETX and DETY for each event in the final _common_clean file
| Quadrant A | 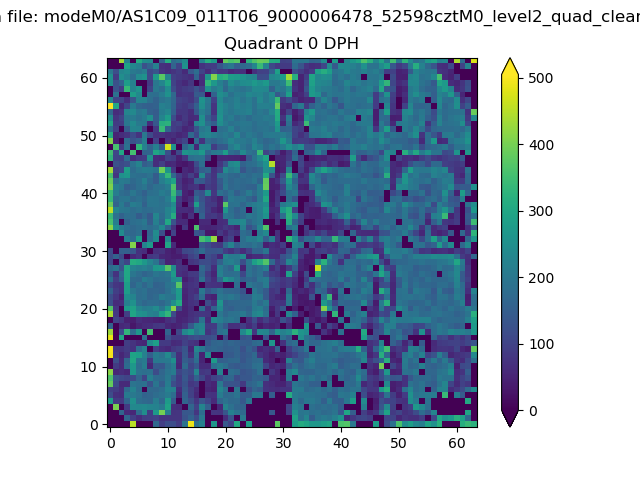 |
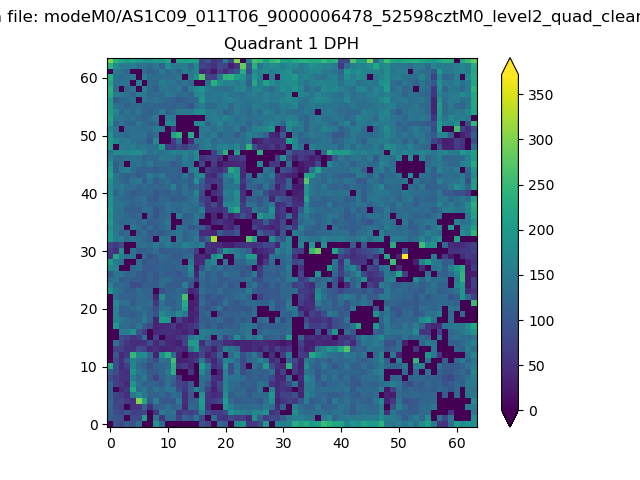 |
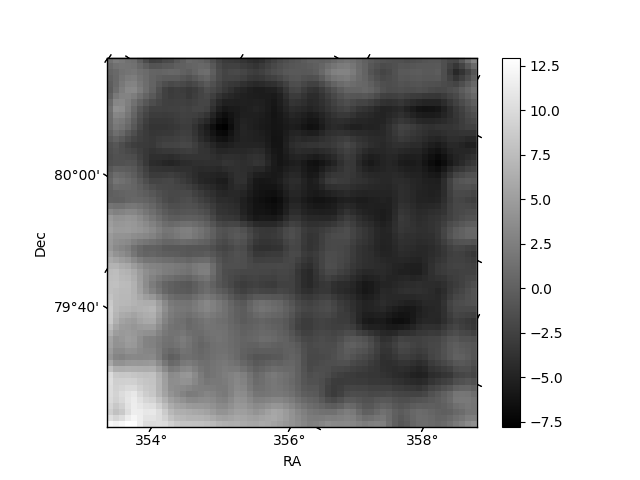
Quadrant B |
|---|---|---|---|
| Quadrant D | 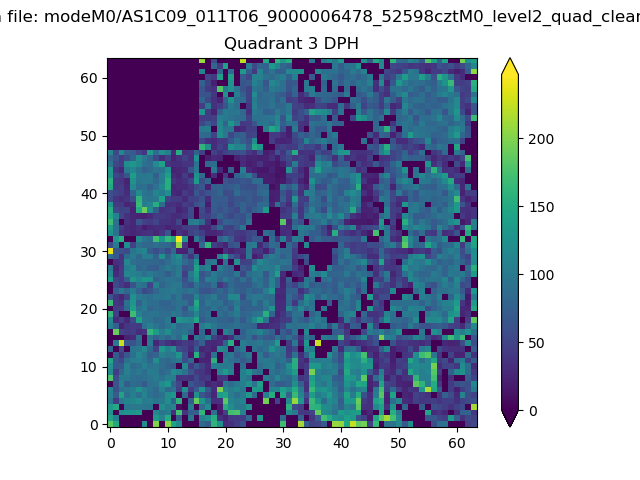 |
 |
Quadrant C |
| Plot type | Count rate plots | Images |
|---|---|---|
| Comparison with Poisson distribution Blue bars denote a histogram of data divided into 1 sec bins. Red curve is a Poisson curve with rate = median count rate of data. |
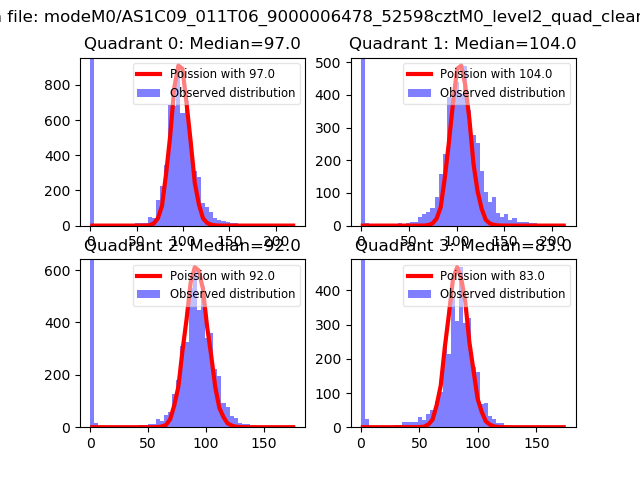 |
 |
| Quadrant-wise count rates Data is divided into 100 sec bins |
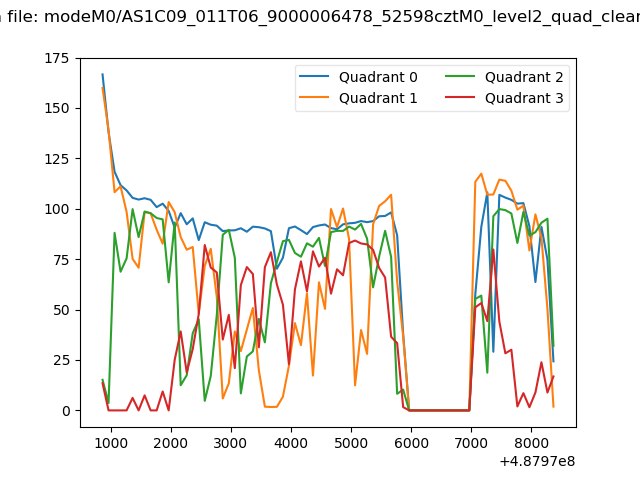 |
|
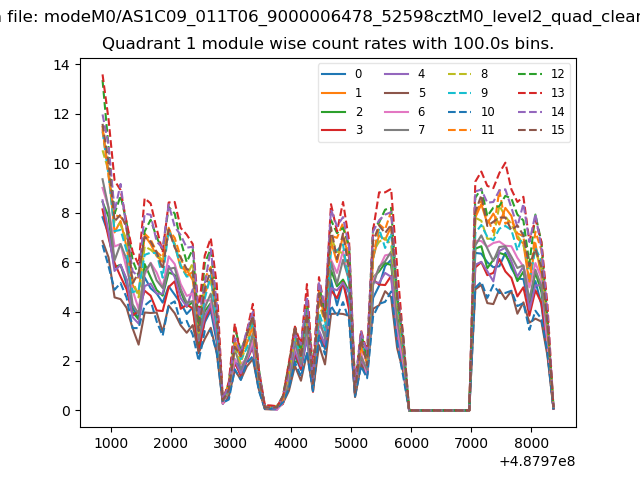
| Module-wise count rates for Quadrant A Data is divided into 100 sec bins |
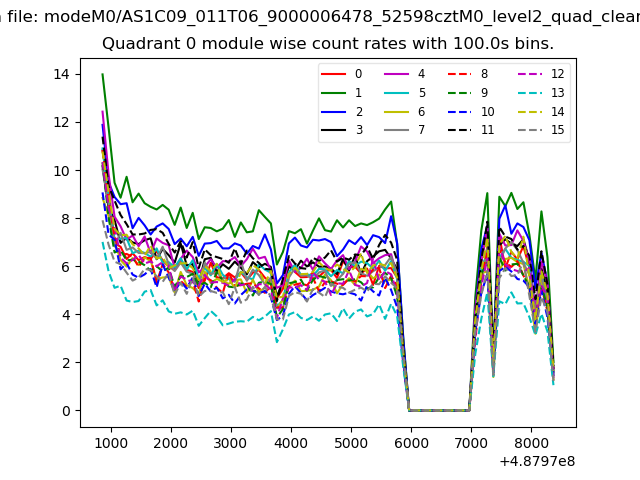 |
 |
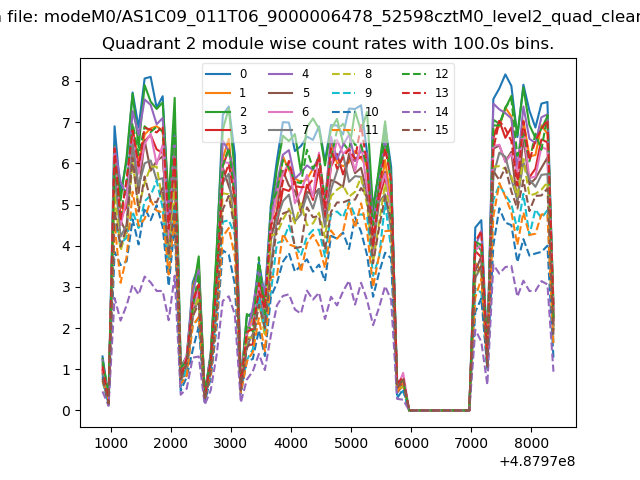
| Module-wise count rates for Quadrant B Data is divided into 100 sec bins |
 |
 |
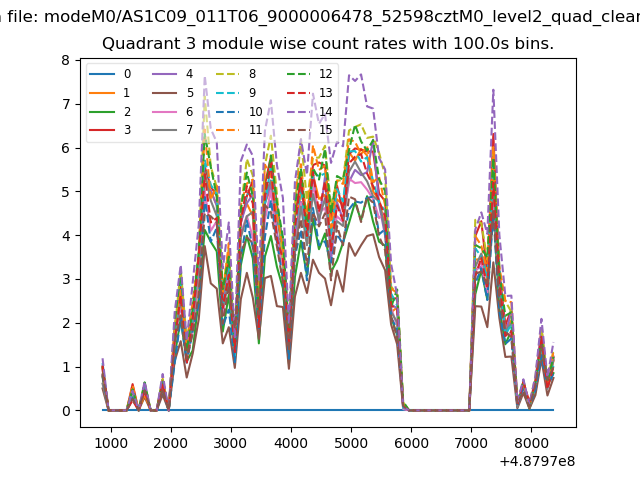
| Module-wise count rates for Quadrant C Data is divided into 100 sec bins |
 |
 |
| Module-wise count rates for Quadrant D Data is divided into 100 sec bins |
 |
 |
| Parameter | Plot |
|---|---|
| CZT HV Monitor | 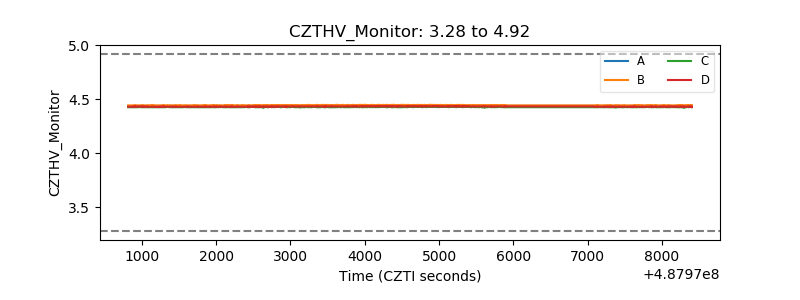 |
| D_VDD | 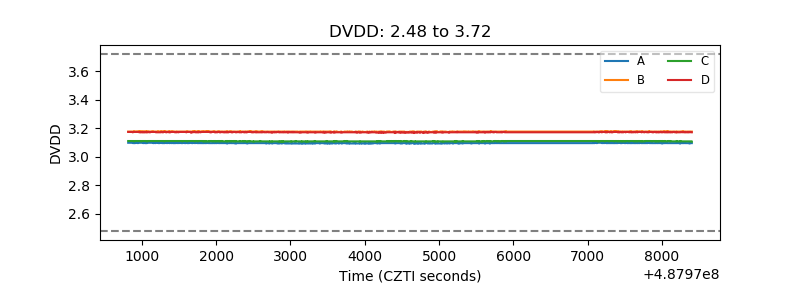 |
| Temperature 1 | 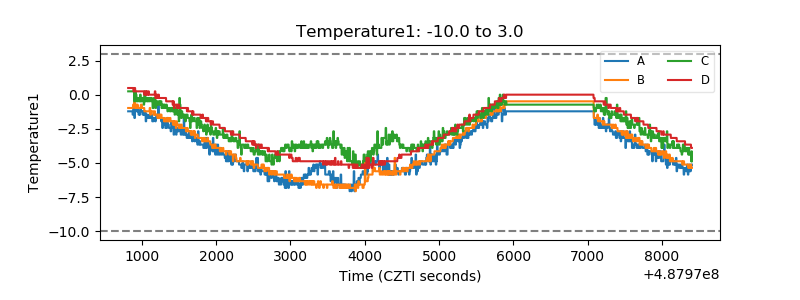 |
| Veto HV Monitor |  |
| Veto LLD | 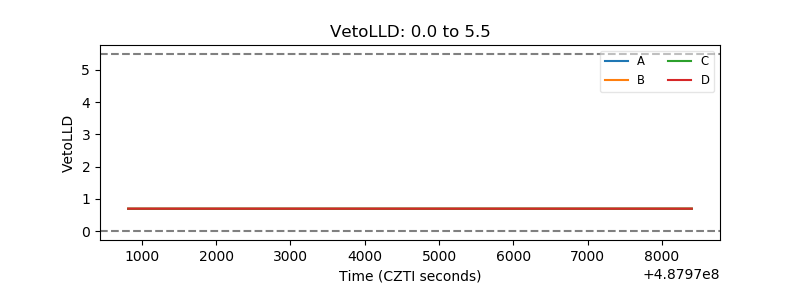 |
| Alpha Counter | 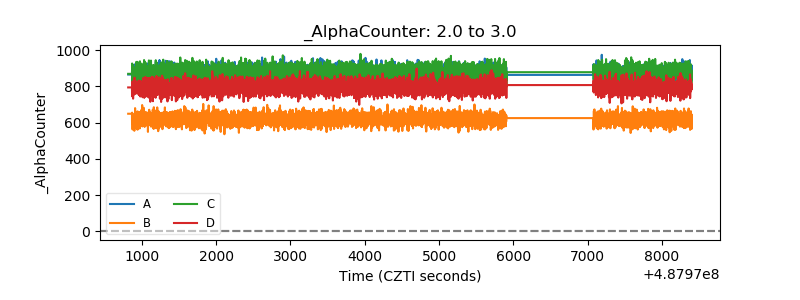 |
| _CPM_Rate | 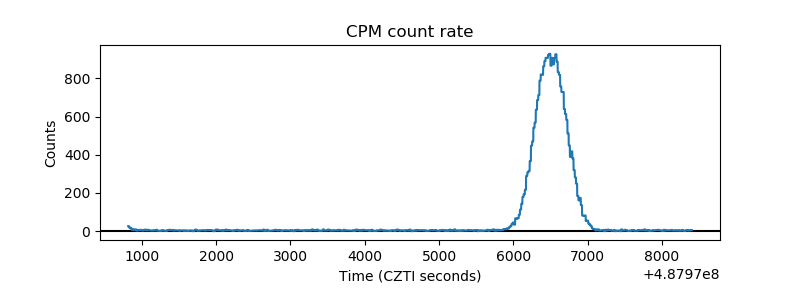 |
| CZT Counter | 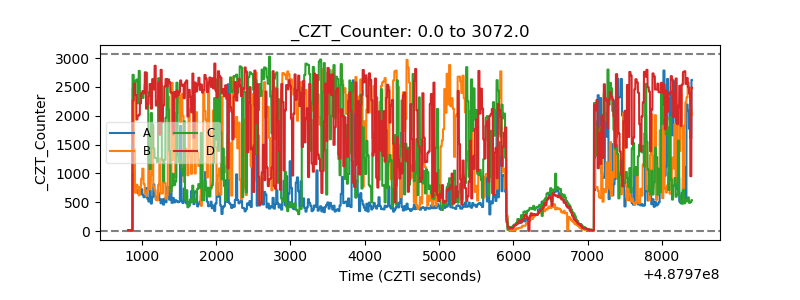 |
| +2.5 Volts monitor |  |
| +5 Volts monitor |  |
| _ROLL_ROT | 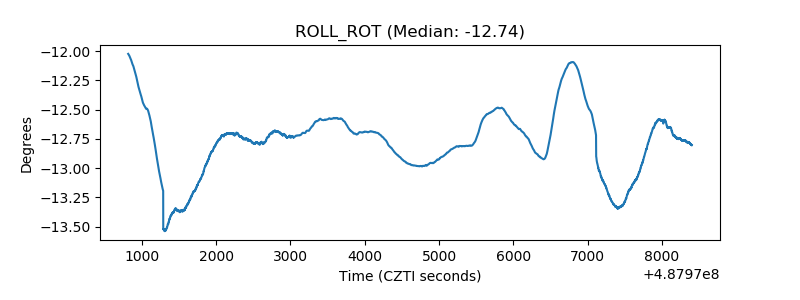 |
| _Roll_DEC | 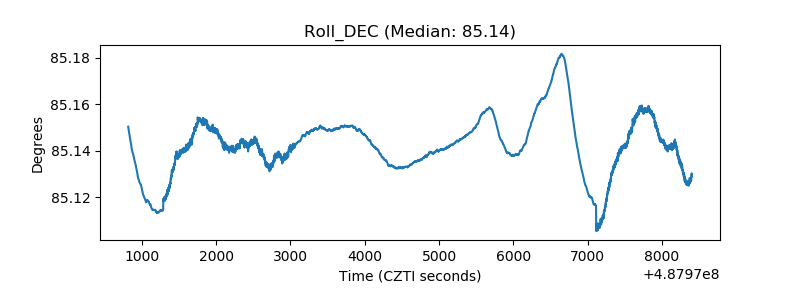 |
| _Roll_RA | 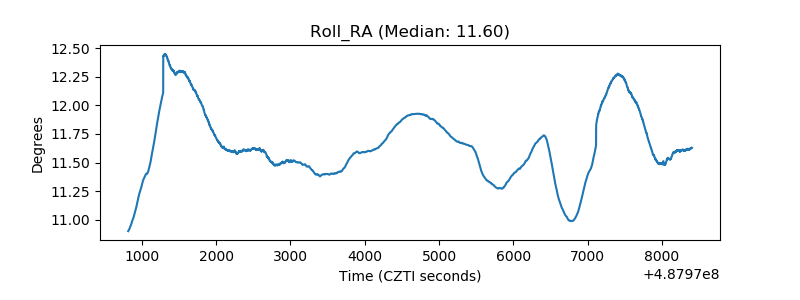 |
| Veto Counter | 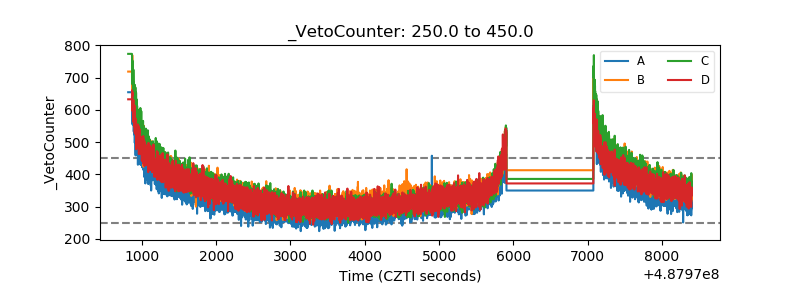 |