| Param | Original file | Final file |
|---|---|---|
| Filename | modeM0/AS1C09_011T06_9000006478_52601cztM0_level2.fits | modeM0/AS1C09_011T06_9000006478_52601cztM0_level2_quad_clean.evt |
| Size (bytes) | 900,734,400 | 78,848,640 |
| Size | 859.0 MB | 75.2 MB |
| Events in quadrant A | 3,489,405 | 609,922 |
| Events in quadrant B | 6,148,570 | 640,489 |
| Events in quadrant C | 9,472,328 | 438,008 |
| Events in quadrant D | 13,721,344 | 237,358 |
| Mode M0 | |||
|---|---|---|---|
| Quadrant | BADHDUFLAG | Total packets | Discarded packets |
| A | 0 | 15457 | 1 |
| B | 0 | 22778 | 1 |
| C | 0 | 32712 | 1 |
| D | 0 | 45350 | 1 |
| Mode M9 | |||
|---|---|---|---|
| Quadrant | BADHDUFLAG | Total packets | Discarded packets |
| A | 0 | 8 | 0 |
| B | 0 | 8 | 0 |
| C | 0 | 8 | 0 |
| D | 0 | 8 | 0 |
| Mode SS | |||
|---|---|---|---|
| Quadrant | BADHDUFLAG | Total packets | Discarded packets |
| A | 0 | 136 | 0 |
| B | 0 | 136 | 0 |
| C | 0 | 136 | 0 |
| D | 0 | 136 | 0 |
| Quadrant | Total seconds | Saturated seconds | Saturation percentage |
|---|---|---|---|
| A | 6608 | 176 | 2.663438% |
| B | 6609 | 432 | 6.536541% |
| C | 6609 | 1957 | 29.611136% |
| D | 6609 | 4173 | 63.141171% |
Noise dominated data is calculated using 1-second bins in cleaned event files. If a bin has >2000 counts, and if more than 50% of those come from <1% of pixels, then it is considered to be noise-dominated and hence unusable.
| Quadrant | # 1 sec bins | Bins with >0 counts | Bins with >2000 counts | High rate bins dominated by noise | Noise dominated (total time) | Noise dominated (detector-on time) | Marked lightcurve |
|---|---|---|---|---|---|---|---|
| A | 7493 | 6609 | 128 | 128 | 1.71% | 1.94% | 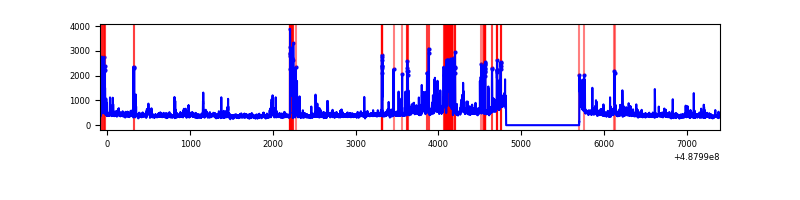 |
| B | 7494 | 6610 | 435 | 435 | 5.80% | 6.58% | 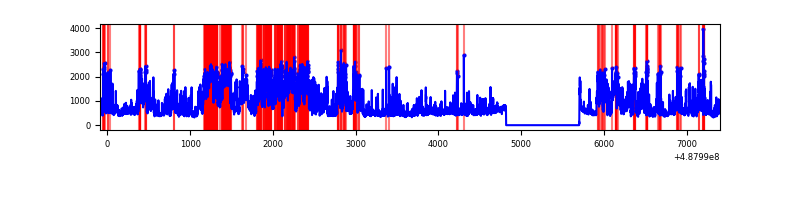 |
| C | 7494 | 6610 | 2064 | 2064 | 27.54% | 31.23% | 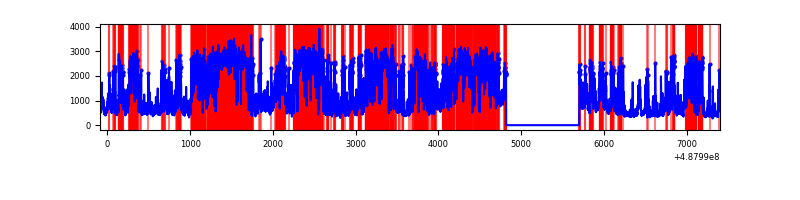 |
| D | 7494 | 6610 | 3983 | 3983 | 53.15% | 60.26% | 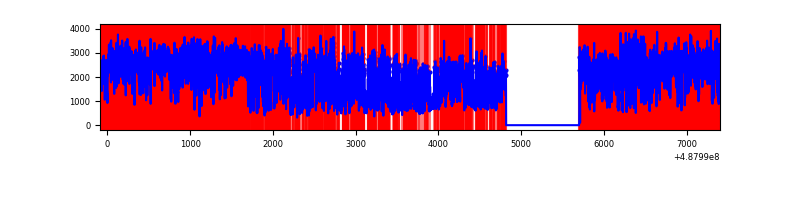 |
Top three noisy pixels from each quadrant. If the there are fewer than three noisy pixels in the level2.evt file, extra rows are filled as -1
| Pixel properties | Quadrant properties | ||||||
|---|---|---|---|---|---|---|---|
| Quadrant | DetID | PixID | Counts | Sigma | Mean | Median | Sigma |
| A | 4 | 249 | 328149 | 1984.6 | 660 | 645 | 165.0 |
| A | 3 | 28 | 126205 | 760.87 | 660 | 645 | 165.0 |
| A | 7 | 190 | 89788 | 540.19 | 660 | 645 | 165.0 |
| B | 10 | 254 | 2265416 | 16310.55 | 656 | 635 | 138.9 |
| B | 4 | 81 | 293284 | 2107.61 | 656 | 635 | 138.9 |
| B | 10 | 128 | 247698 | 1779.3 | 656 | 635 | 138.9 |
| C | 15 | 248 | 6281240 | 38629.08 | 569 | 561 | 162.6 |
| C | 1 | 44 | 482346 | 2963.2 | 569 | 561 | 162.6 |
| C | 12 | 252 | 137672 | 843.3 | 569 | 561 | 162.6 |
| D | 12 | 16 | 7157459 | 57454.42 | 428 | 406 | 124.6 |
| D | 8 | 176 | 2044398 | 16408.48 | 428 | 406 | 124.6 |
| D | 11 | 245 | 594440 | 4768.71 | 428 | 406 | 124.6 |
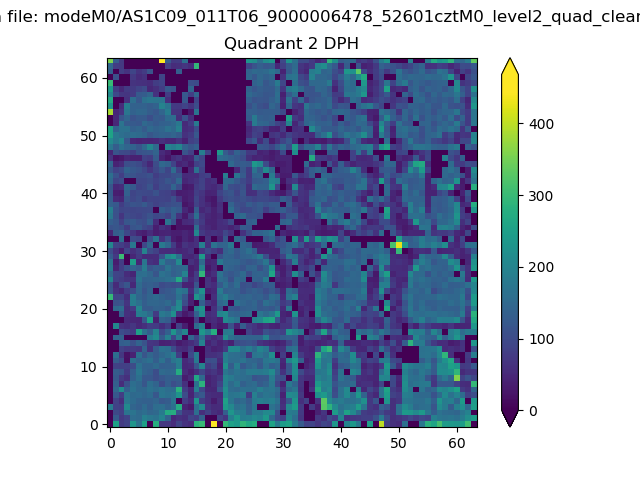
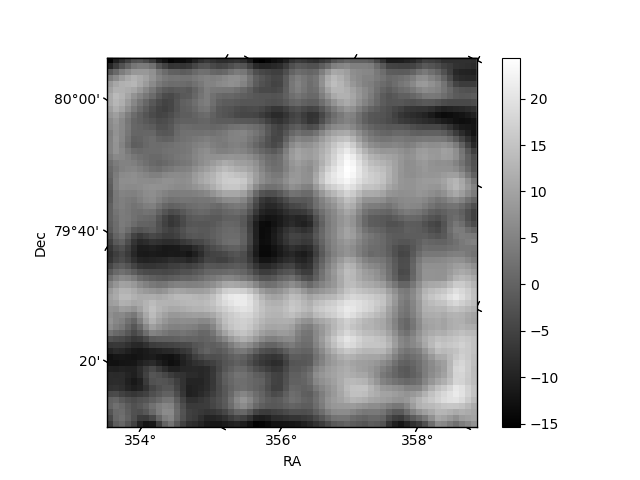
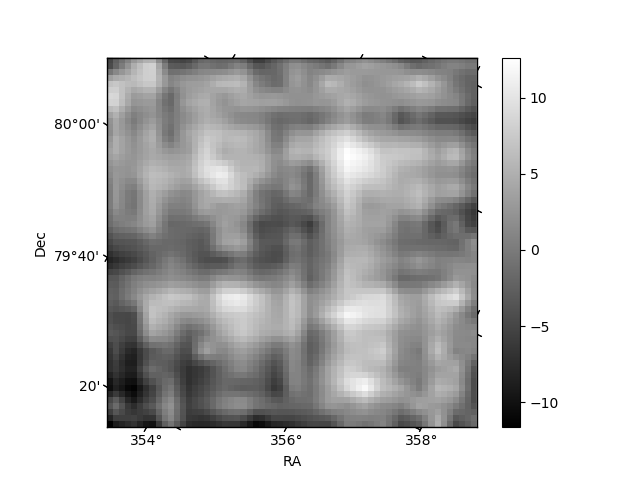
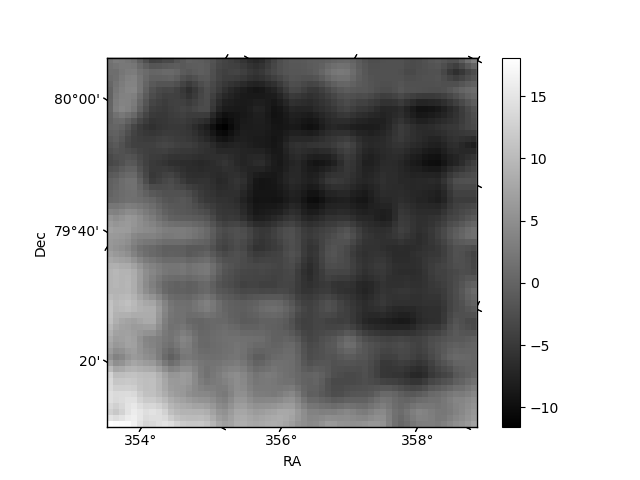
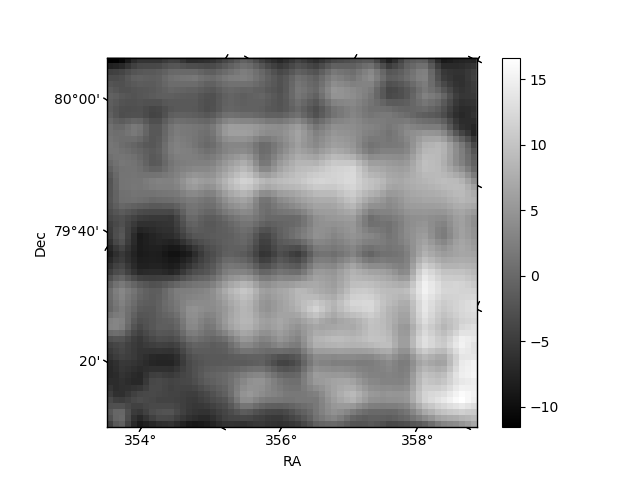
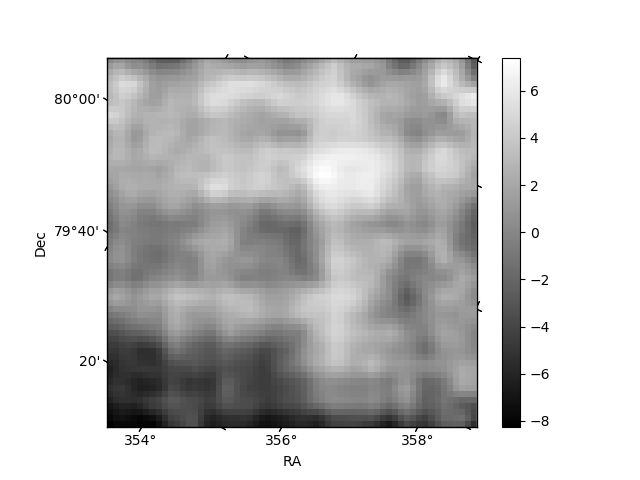
Histogram calculated using DETX and DETY for each event in the final _common_clean file
| Quadrant A | 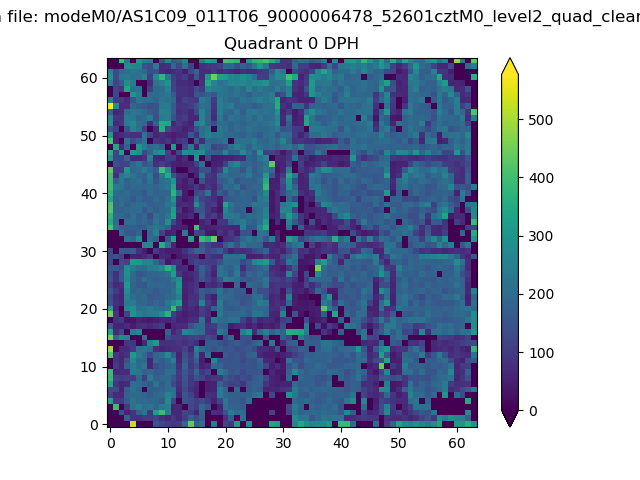 |
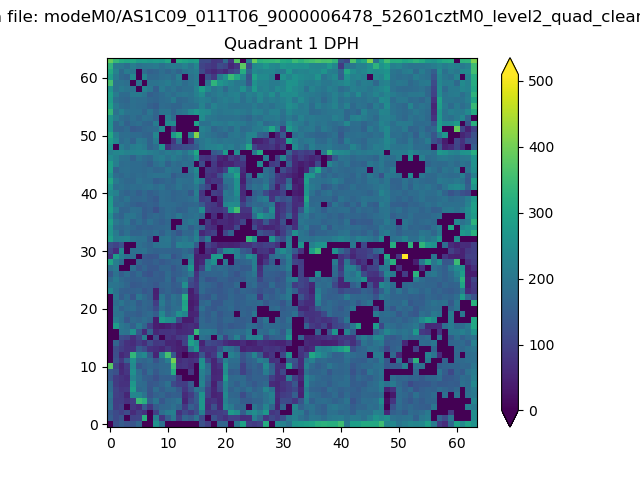 |
Quadrant B |
|---|---|---|---|
| Quadrant D | 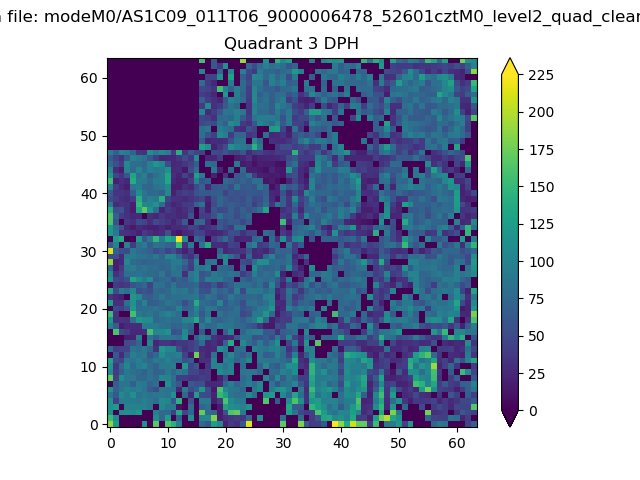 |
 |
Quadrant C |
| Plot type | Count rate plots | Images |
|---|---|---|
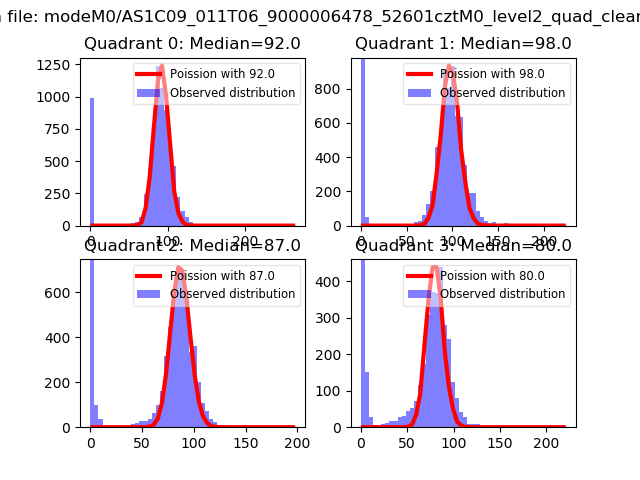
| Comparison with Poisson distribution Blue bars denote a histogram of data divided into 1 sec bins. Red curve is a Poisson curve with rate = median count rate of data. |
 |
 |
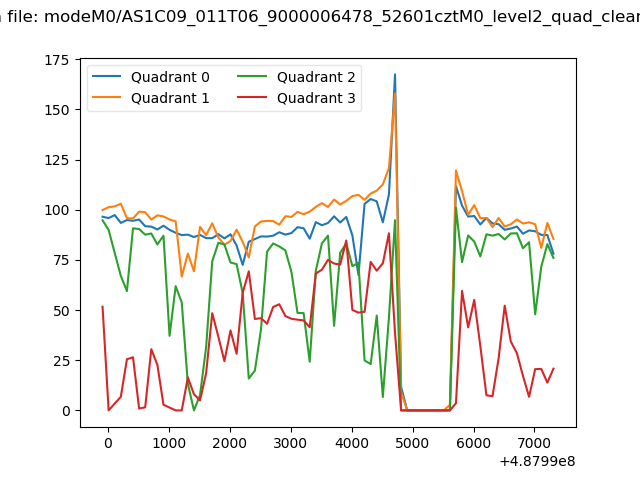
| Quadrant-wise count rates Data is divided into 100 sec bins |
 |
|
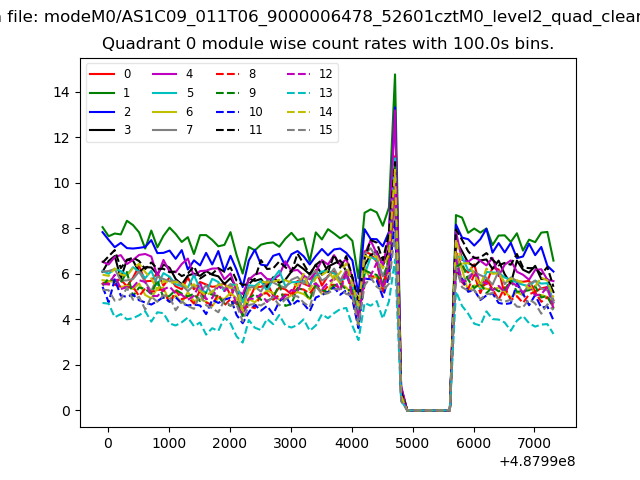
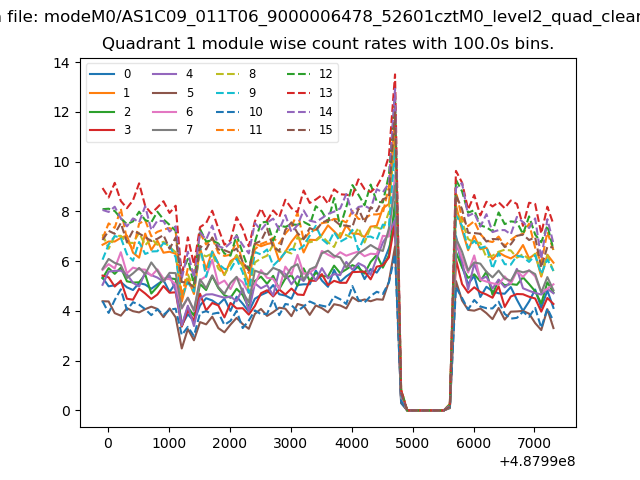
| Module-wise count rates for Quadrant A Data is divided into 100 sec bins |
 |
 |
| Module-wise count rates for Quadrant B Data is divided into 100 sec bins |
 |
 |
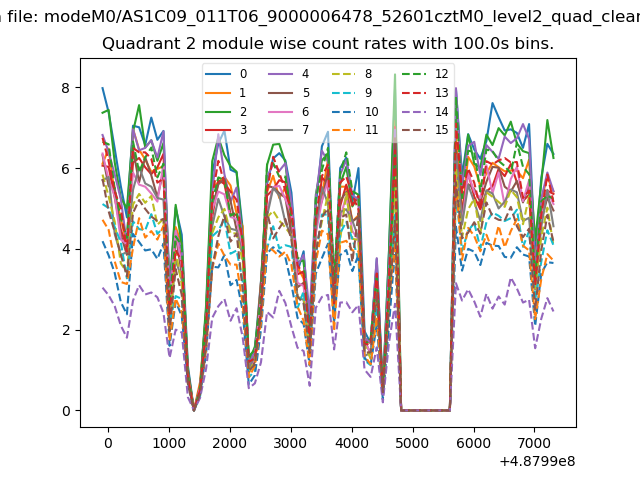
| Module-wise count rates for Quadrant C Data is divided into 100 sec bins |
 |
 |
| Module-wise count rates for Quadrant D Data is divided into 100 sec bins |
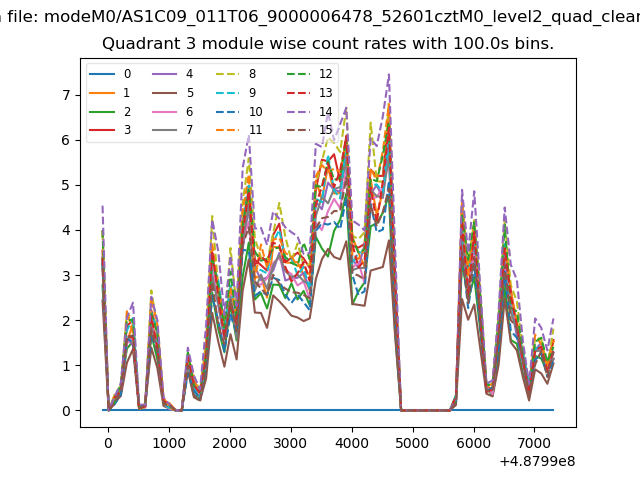 |
 |
| Parameter | Plot |
|---|---|
| CZT HV Monitor | 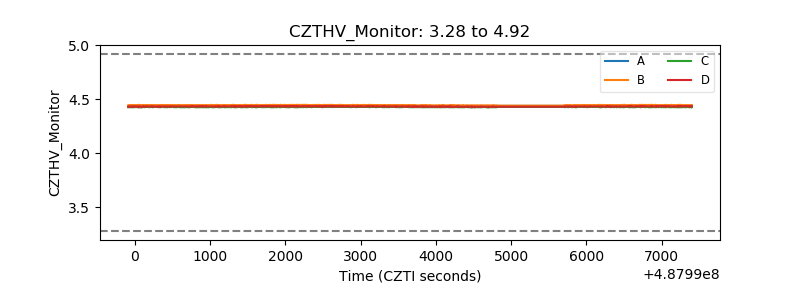 |
| D_VDD | 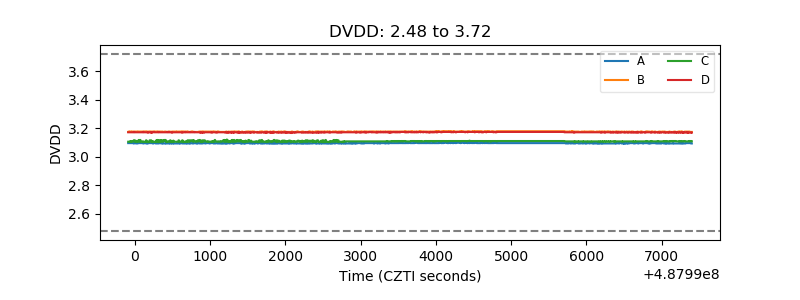 |
| Temperature 1 | 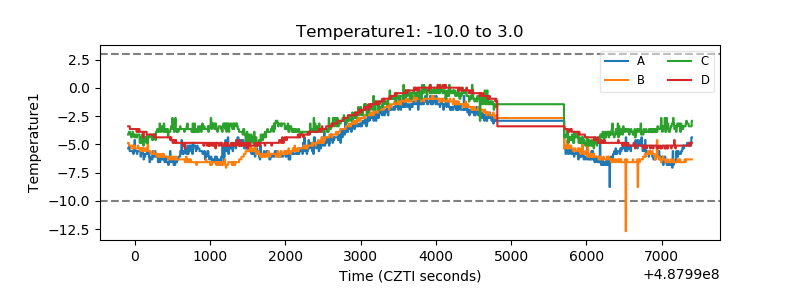 |
| Veto HV Monitor | 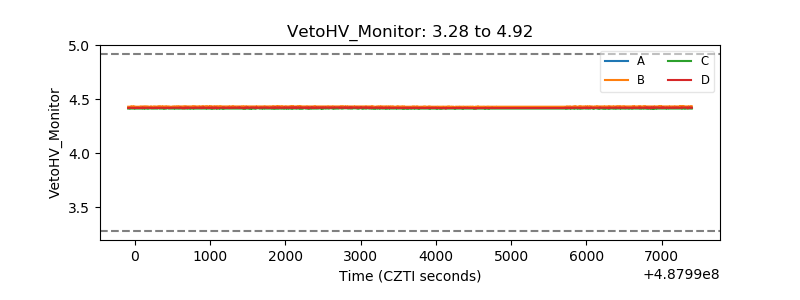 |
| Veto LLD | 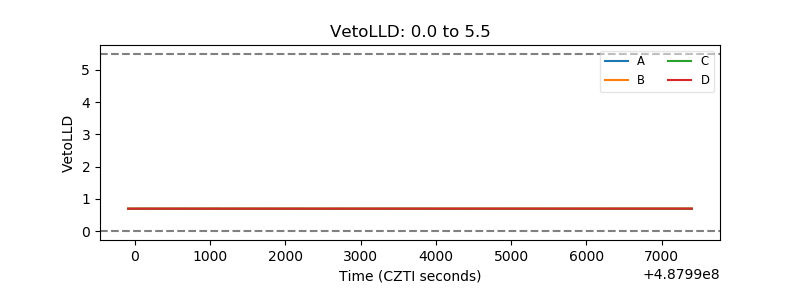 |
| Alpha Counter | 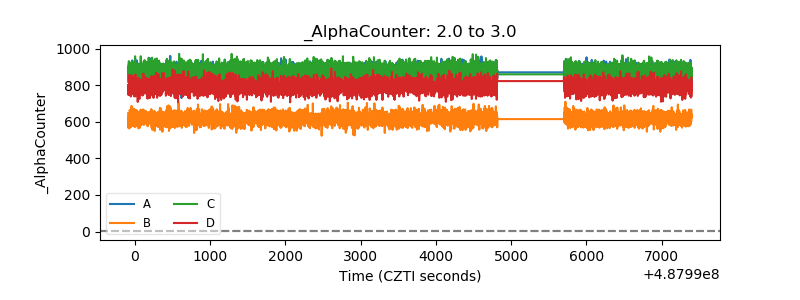 |
| _CPM_Rate | 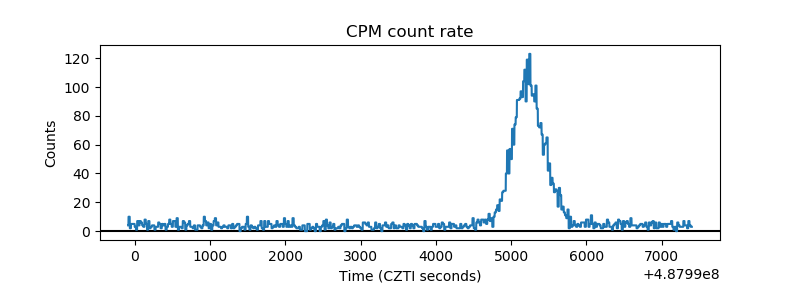 |
| CZT Counter | 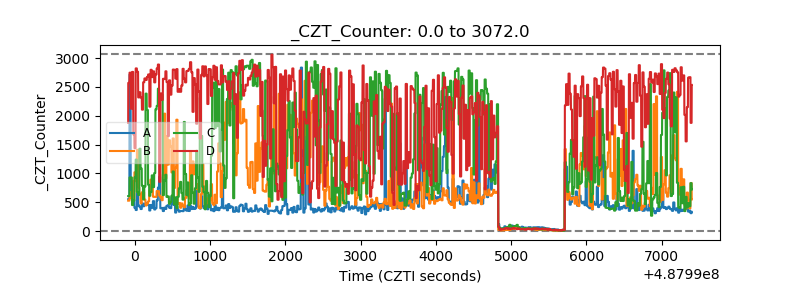 |
| +2.5 Volts monitor |  |
| +5 Volts monitor | 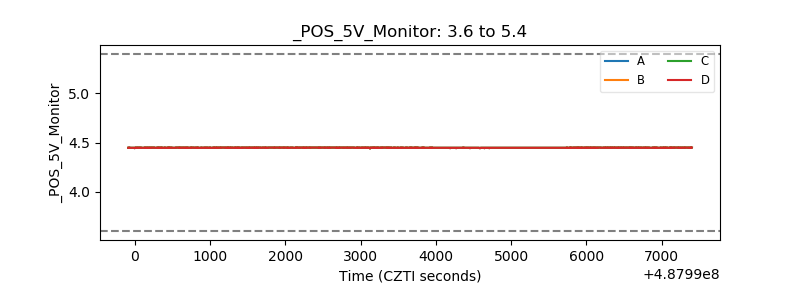 |
| _ROLL_ROT | 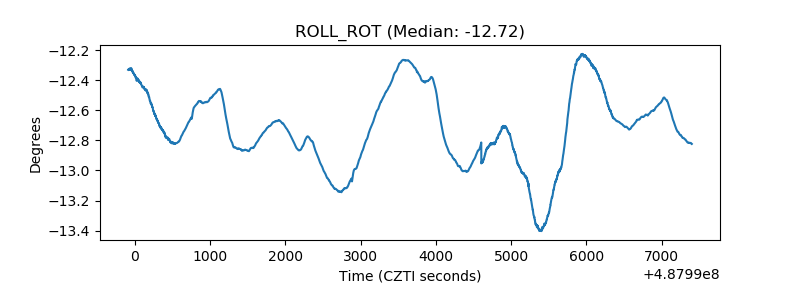 |
| _Roll_DEC | 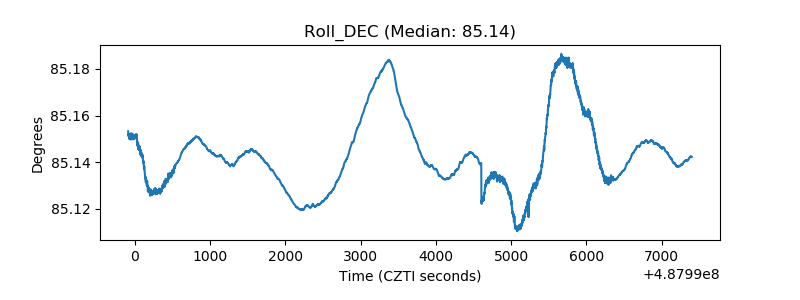 |
| _Roll_RA | 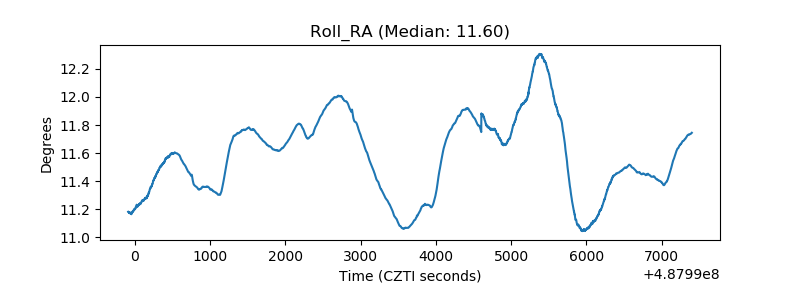 |
| Veto Counter | 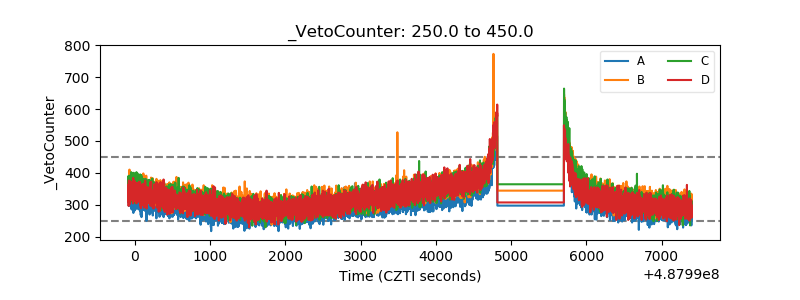 |