| Param | Original file | Final file |
|---|---|---|
| Filename | modeM0/AS1C09_011T06_9000006478_52615cztM0_level2.fits | modeM0/AS1C09_011T06_9000006478_52615cztM0_level2_quad_clean.evt |
| Size (bytes) | 988,246,080 | 79,444,800 |
| Size | 942.5 MB | 75.8 MB |
| Events in quadrant A | 3,646,512 | 645,734 |
| Events in quadrant B | 8,960,830 | 590,183 |
| Events in quadrant C | 15,933,627 | 163,595 |
| Events in quadrant D | 7,508,153 | 525,301 |
| Mode M0 | |||
|---|---|---|---|
| Quadrant | BADHDUFLAG | Total packets | Discarded packets |
| A | 0 | 16025 | 2 |
| B | 0 | 31467 | 2 |
| C | 0 | 52038 | 2 |
| D | 0 | 27180 | 2 |
| Mode M9 | |||
|---|---|---|---|
| Quadrant | BADHDUFLAG | Total packets | Discarded packets |
| A | 0 | 20 | 0 |
| B | 0 | 21 | 0 |
| C | 0 | 21 | 0 |
| D | 0 | 21 | 0 |
| Mode SS | |||
|---|---|---|---|
| Quadrant | BADHDUFLAG | Total packets | Discarded packets |
| A | 0 | 138 | 0 |
| B | 0 | 138 | 0 |
| C | 0 | 138 | 0 |
| D | 0 | 138 | 0 |
| Quadrant | Total seconds | Saturated seconds | Saturation percentage |
|---|---|---|---|
| A | 6898 | 139 | 2.015077% |
| B | 6898 | 1420 | 20.585677% |
| C | 6898 | 5339 | 77.399246% |
| D | 6898 | 944 | 13.685126% |
Noise dominated data is calculated using 1-second bins in cleaned event files. If a bin has >2000 counts, and if more than 50% of those come from <1% of pixels, then it is considered to be noise-dominated and hence unusable.
| Quadrant | # 1 sec bins | Bins with >0 counts | Bins with >2000 counts | High rate bins dominated by noise | Noise dominated (total time) | Noise dominated (detector-on time) | Marked lightcurve |
|---|---|---|---|---|---|---|---|
| A | 7948 | 6899 | 105 | 105 | 1.32% | 1.52% | 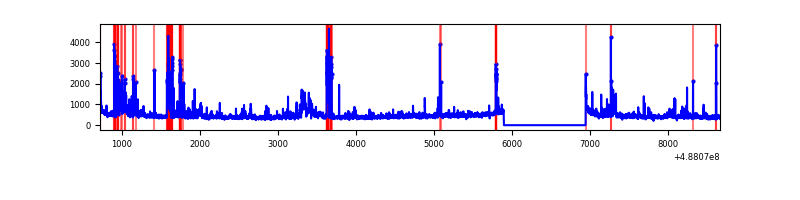 |
| B | 7948 | 6899 | 1052 | 1052 | 13.24% | 15.25% | 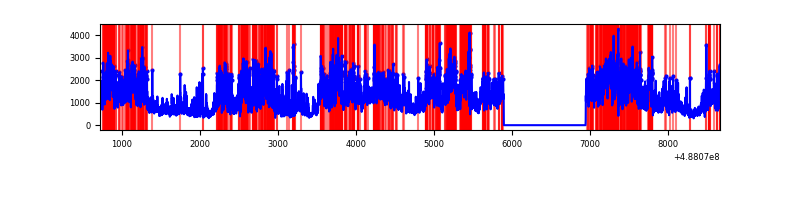 |
| C | 7947 | 6898 | 4847 | 4847 | 60.99% | 70.27% | 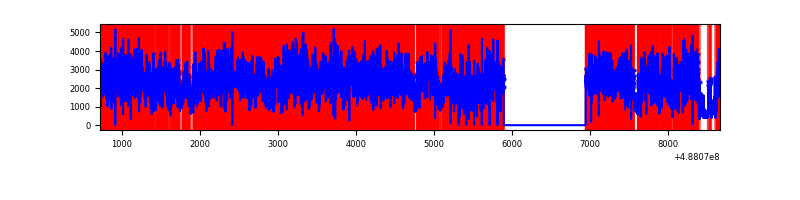 |
| D | 7948 | 6899 | 892 | 892 | 11.22% | 12.93% | 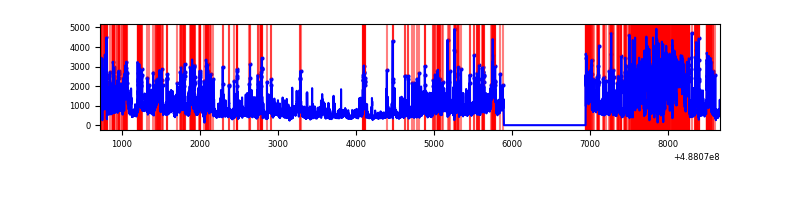 |
Top three noisy pixels from each quadrant. If the there are fewer than three noisy pixels in the level2.evt file, extra rows are filled as -1
| Pixel properties | Quadrant properties | ||||||
|---|---|---|---|---|---|---|---|
| Quadrant | DetID | PixID | Counts | Sigma | Mean | Median | Sigma |
| A | 4 | 249 | 277335 | 1597.32 | 696 | 681 | 173.2 |
| A | 14 | 254 | 131305 | 754.18 | 696 | 681 | 173.2 |
| A | 3 | 95 | 92847 | 532.14 | 696 | 681 | 173.2 |
| B | 10 | 128 | 3598424 | 25804.25 | 661 | 639 | 139.4 |
| B | 10 | 254 | 1533828 | 10996.43 | 661 | 639 | 139.4 |
| B | 8 | 234 | 299102 | 2140.65 | 661 | 639 | 139.4 |
| C | 15 | 248 | 13905154 | 131841.55 | 371 | 367 | 105.5 |
| C | 13 | 3 | 112624 | 1064.39 | 371 | 367 | 105.5 |
| C | 12 | 254 | 75505 | 712.44 | 371 | 367 | 105.5 |
| D | 8 | 176 | 2243047 | 11969.62 | 639 | 608 | 187.3 |
| D | 2 | 62 | 898448 | 4792.46 | 639 | 608 | 187.3 |
| D | 2 | 37 | 389940 | 2078.16 | 639 | 608 | 187.3 |
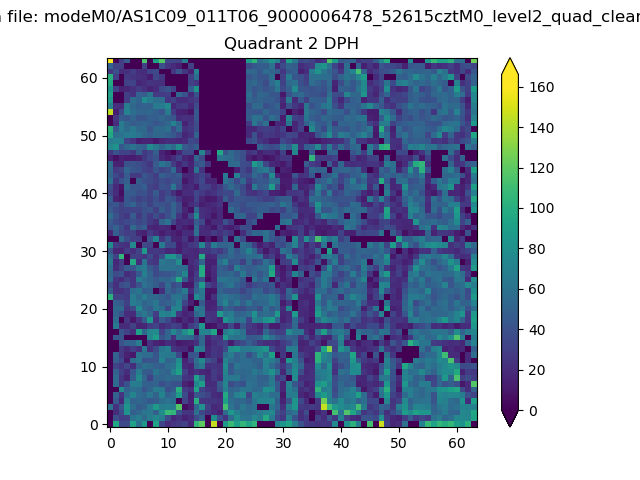
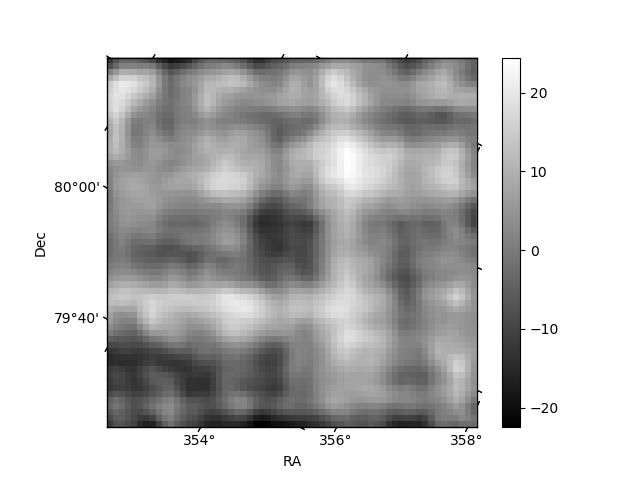
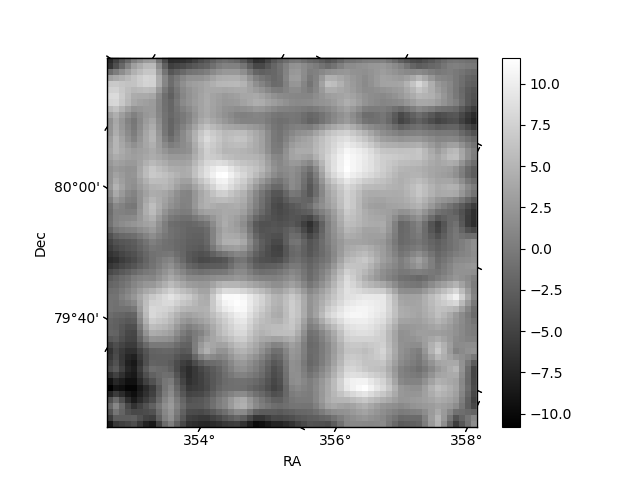
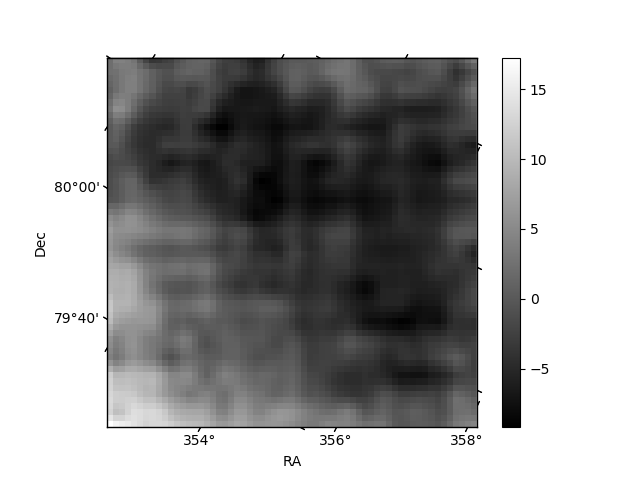
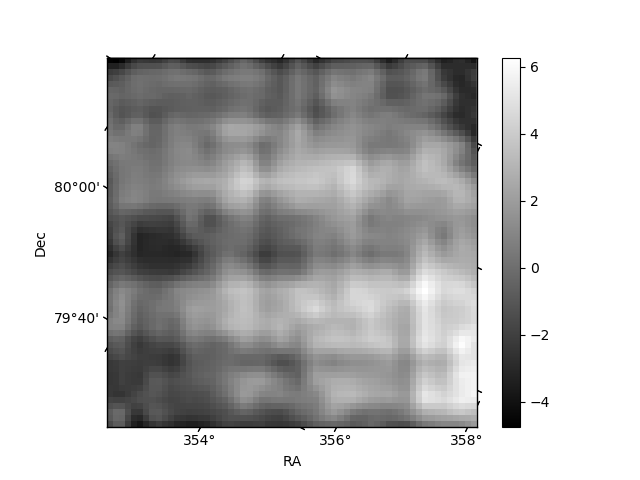
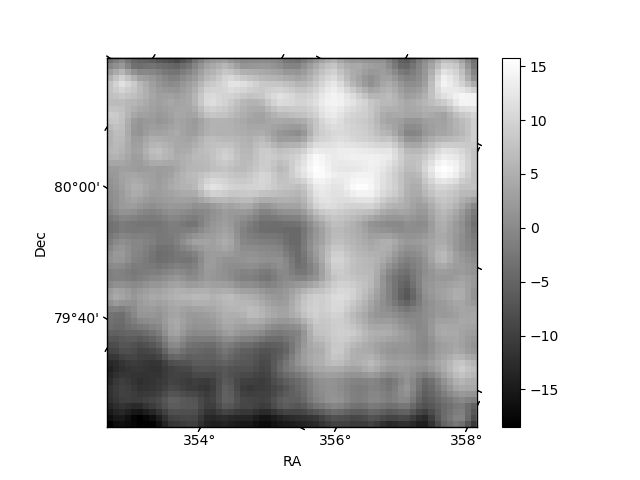
Histogram calculated using DETX and DETY for each event in the final _common_clean file
| Quadrant A | 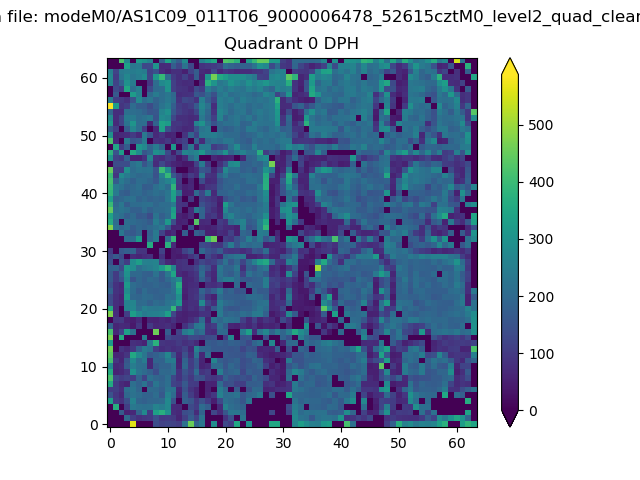 |
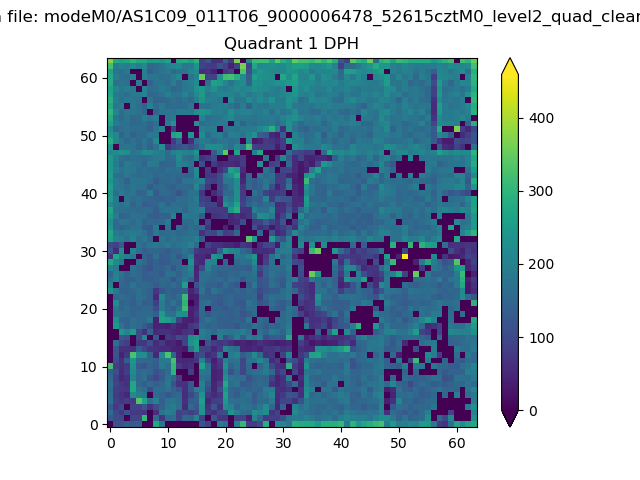 |
Quadrant B |
|---|---|---|---|
| Quadrant D | 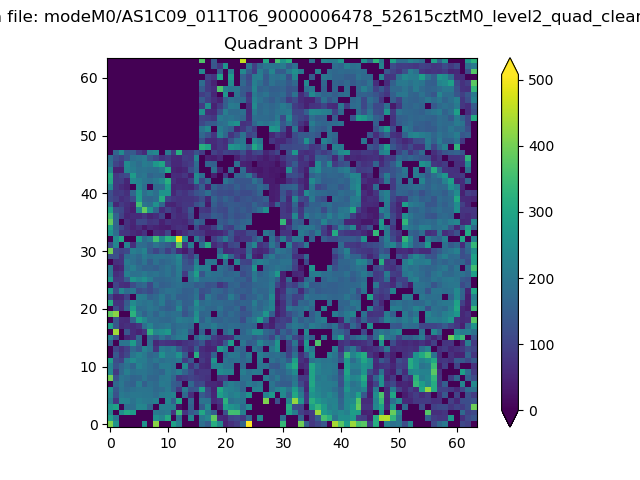 |
 |
Quadrant C |
| Plot type | Count rate plots | Images |
|---|---|---|
| Comparison with Poisson distribution Blue bars denote a histogram of data divided into 1 sec bins. Red curve is a Poisson curve with rate = median count rate of data. |
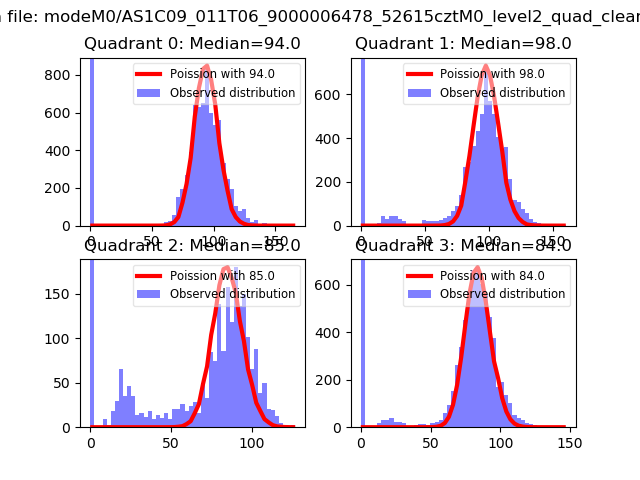 |
 |
| Quadrant-wise count rates Data is divided into 100 sec bins |
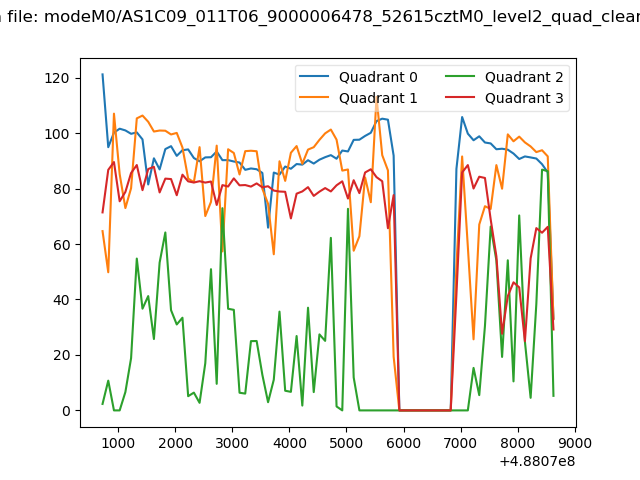 |
|
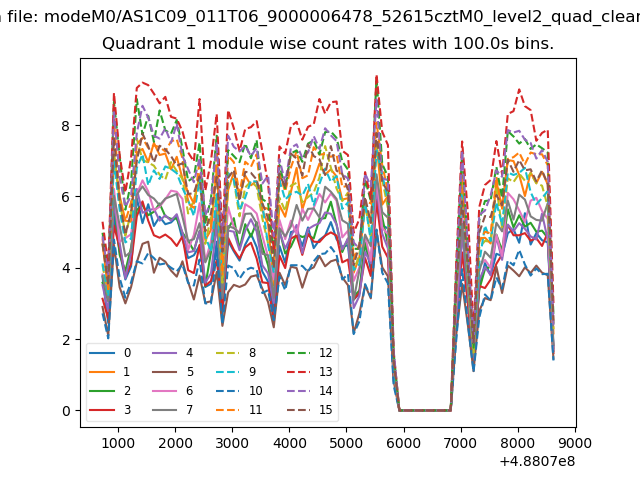
| Module-wise count rates for Quadrant A Data is divided into 100 sec bins |
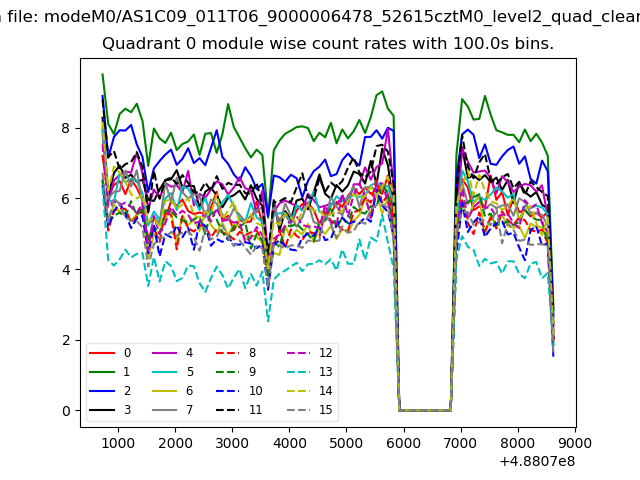 |
 |
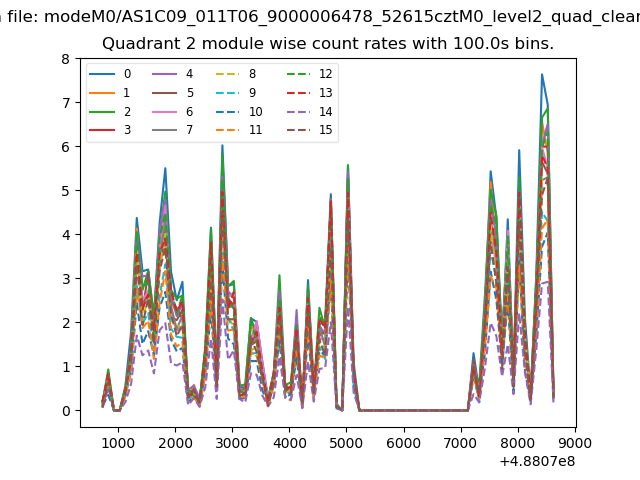
| Module-wise count rates for Quadrant B Data is divided into 100 sec bins |
 |
 |
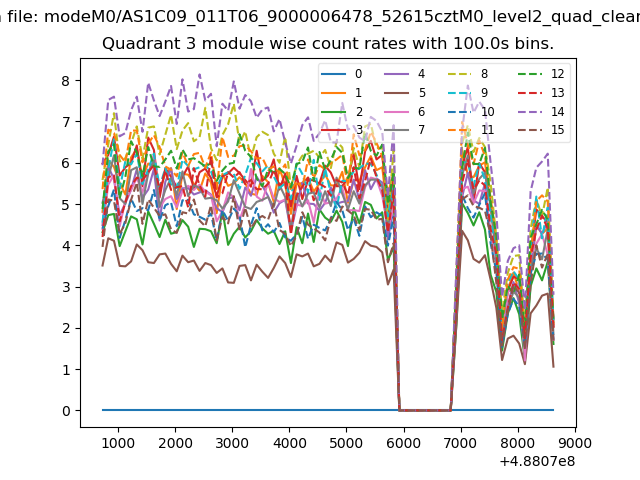
| Module-wise count rates for Quadrant C Data is divided into 100 sec bins |
 |
 |
| Module-wise count rates for Quadrant D Data is divided into 100 sec bins |
 |
 |
| Parameter | Plot |
|---|---|
| CZT HV Monitor | 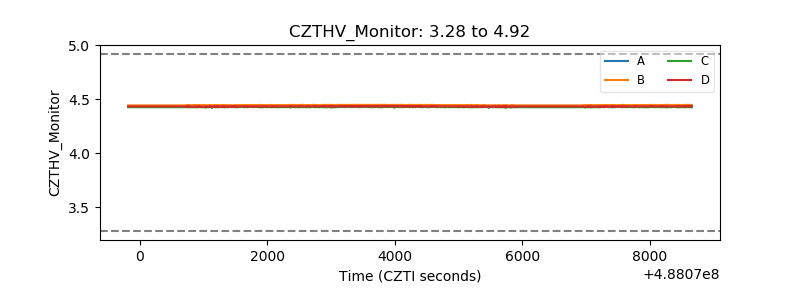 |
| D_VDD | 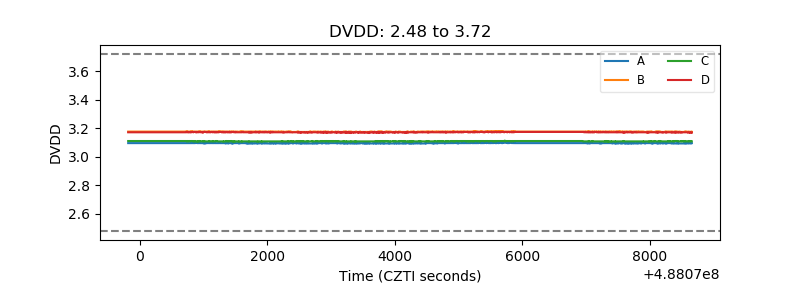 |
| Temperature 1 | 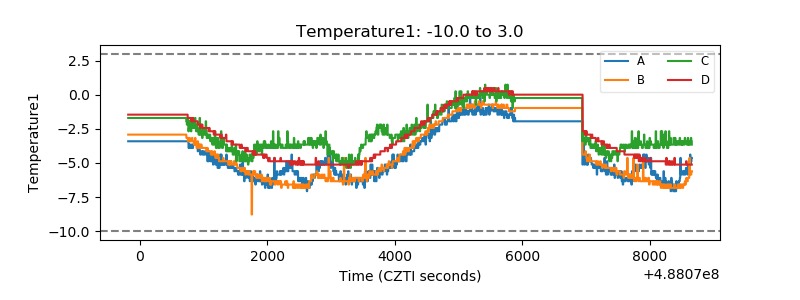 |
| Veto HV Monitor | 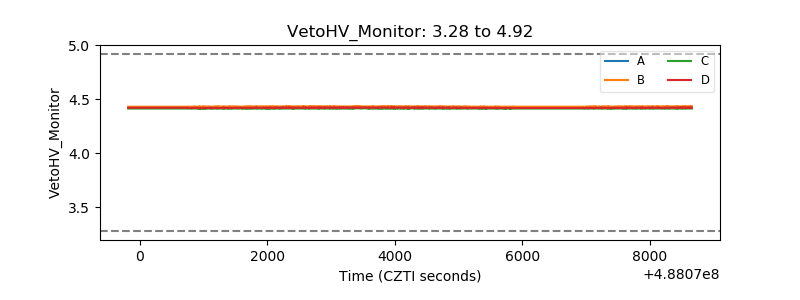 |
| Veto LLD | 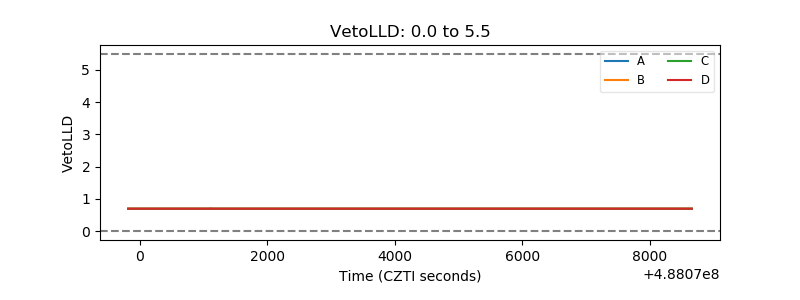 |
| Alpha Counter | 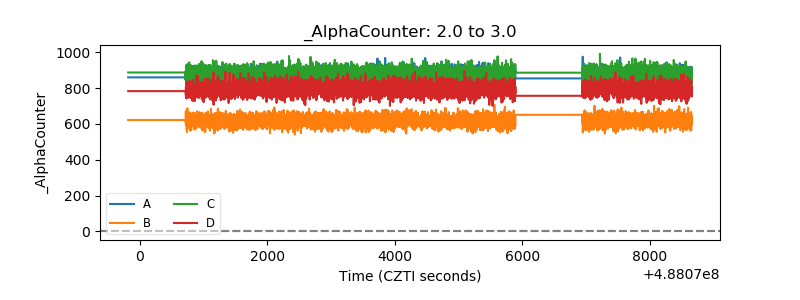 |
| _CPM_Rate | 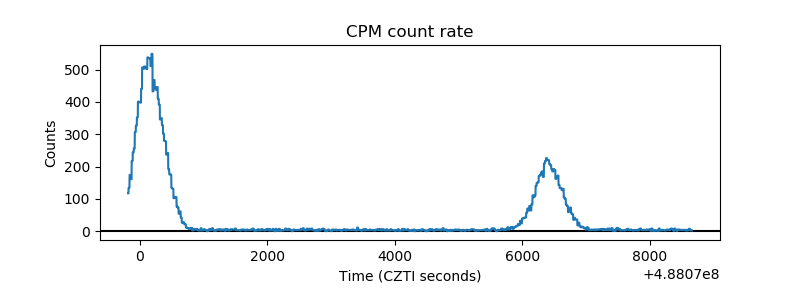 |
| CZT Counter | 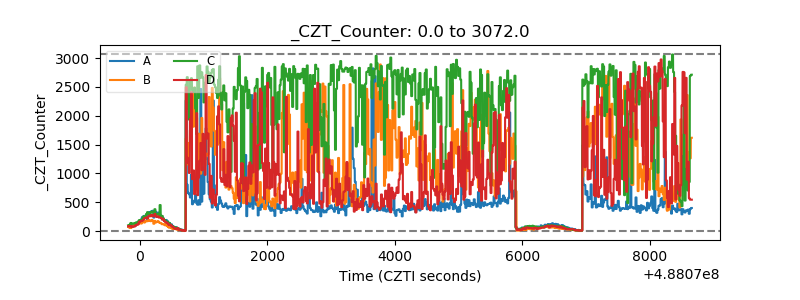 |
| +2.5 Volts monitor |  |
| +5 Volts monitor |  |
| _ROLL_ROT | 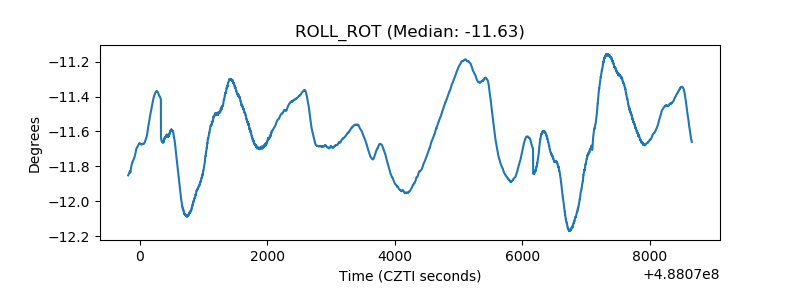 |
| _Roll_DEC | 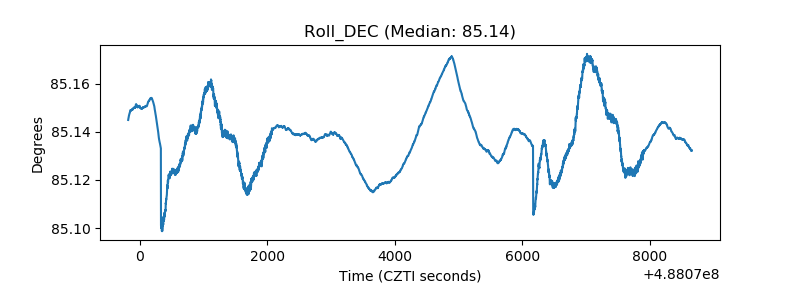 |
| _Roll_RA | 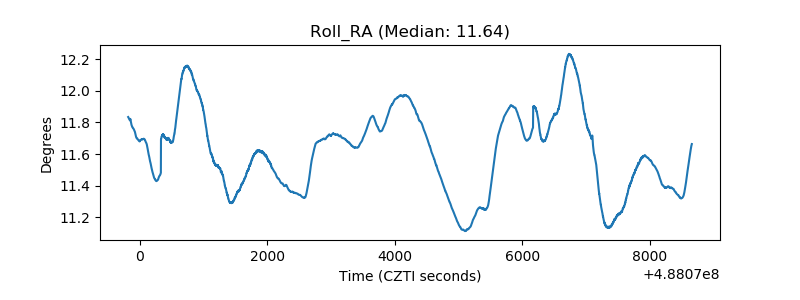 |
| Veto Counter | 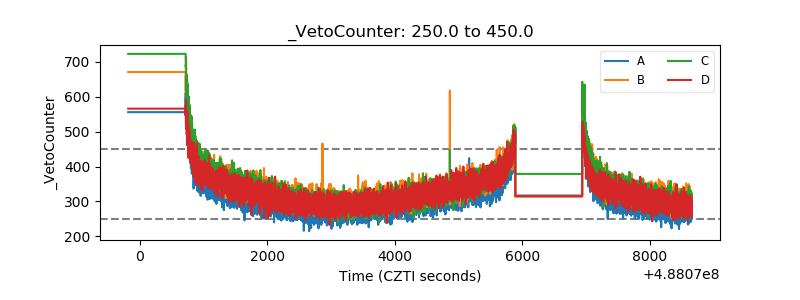 |