| Param | Original file | Final file |
|---|---|---|
| Filename | modeM0/AS1C09_011T06_9000006478_52617cztM0_level2.fits | modeM0/AS1C09_011T06_9000006478_52617cztM0_level2_quad_clean.evt |
| Size (bytes) | 1,008,434,880 | 73,025,280 |
| Size | 961.7 MB | 69.6 MB |
| Events in quadrant A | 3,092,009 | 622,756 |
| Events in quadrant B | 9,225,033 | 574,238 |
| Events in quadrant C | 16,679,240 | 42,010 |
| Events in quadrant D | 7,809,283 | 499,219 |
| Mode M0 | |||
|---|---|---|---|
| Quadrant | BADHDUFLAG | Total packets | Discarded packets |
| A | 0 | 14504 | 2 |
| B | 0 | 32178 | 2 |
| C | 0 | 54110 | 2 |
| D | 0 | 28000 | 2 |
| Mode M9 | |||
|---|---|---|---|
| Quadrant | BADHDUFLAG | Total packets | Discarded packets |
| A | 0 | 1 | 0 |
| B | 0 | 1 | 0 |
| C | 0 | 1 | 0 |
| D | 0 | 1 | 0 |
| Mode SS | |||
|---|---|---|---|
| Quadrant | BADHDUFLAG | Total packets | Discarded packets |
| A | 0 | 138 | 0 |
| B | 0 | 138 | 0 |
| C | 0 | 138 | 0 |
| D | 0 | 138 | 0 |
| Quadrant | Total seconds | Saturated seconds | Saturation percentage |
|---|---|---|---|
| A | 6776 | 64 | 0.944510% |
| B | 6777 | 1454 | 21.454921% |
| C | 6776 | 6373 | 94.052538% |
| D | 6776 | 1011 | 14.920307% |
Noise dominated data is calculated using 1-second bins in cleaned event files. If a bin has >2000 counts, and if more than 50% of those come from <1% of pixels, then it is considered to be noise-dominated and hence unusable.
| Quadrant | # 1 sec bins | Bins with >0 counts | Bins with >2000 counts | High rate bins dominated by noise | Noise dominated (total time) | Noise dominated (detector-on time) | Marked lightcurve |
|---|---|---|---|---|---|---|---|
| A | 6886 | 6779 | 19 | 19 | 0.28% | 0.28% | 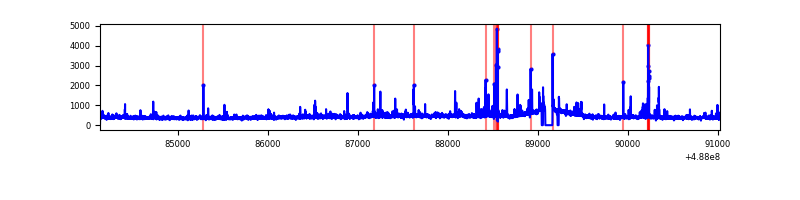 |
| B | 6887 | 6780 | 1333 | 1333 | 19.36% | 19.66% | 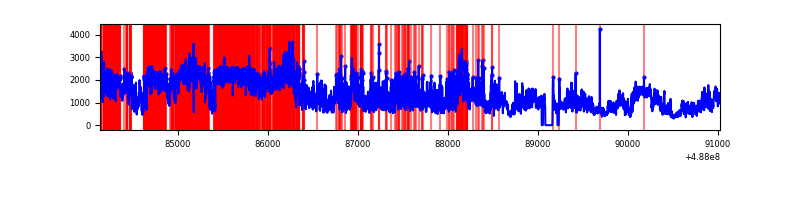 |
| C | 6885 | 6777 | 5465 | 5465 | 79.38% | 80.64% | 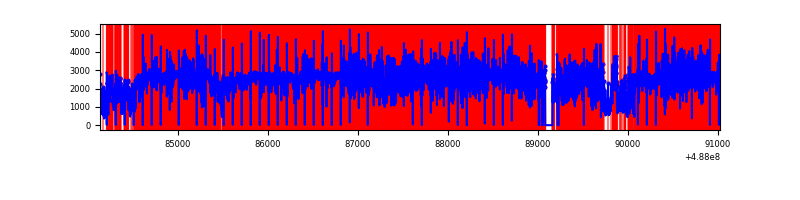 |
| D | 6886 | 6779 | 853 | 853 | 12.39% | 12.58% | 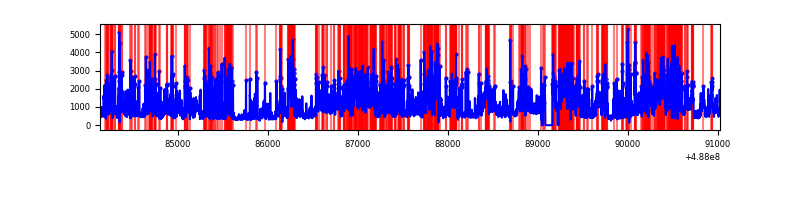 |
Top three noisy pixels from each quadrant. If the there are fewer than three noisy pixels in the level2.evt file, extra rows are filled as -1
| Pixel properties | Quadrant properties | ||||||
|---|---|---|---|---|---|---|---|
| Quadrant | DetID | PixID | Counts | Sigma | Mean | Median | Sigma |
| A | 4 | 249 | 65094 | 361.59 | 700 | 679 | 178.1 |
| A | 3 | 46 | 53447 | 296.21 | 700 | 679 | 178.1 |
| A | 4 | 3 | 30302 | 166.29 | 700 | 679 | 178.1 |
| B | 10 | 254 | 4197227 | 29298.98 | 667 | 644 | 143.2 |
| B | 10 | 128 | 981207 | 6845.93 | 667 | 644 | 143.2 |
| B | 1 | 255 | 332827 | 2319.18 | 667 | 644 | 143.2 |
| C | 15 | 248 | 15557600 | 282430.56 | 198 | 196 | 55.1 |
| C | 12 | 254 | 176706 | 3204.38 | 198 | 196 | 55.1 |
| C | 15 | 224 | 42995 | 776.98 | 198 | 196 | 55.1 |
| D | 8 | 176 | 2283927 | 12630.92 | 632 | 603 | 180.8 |
| D | 2 | 62 | 1786446 | 9878.95 | 632 | 603 | 180.8 |
| D | 6 | 42 | 284741 | 1571.8 | 632 | 603 | 180.8 |
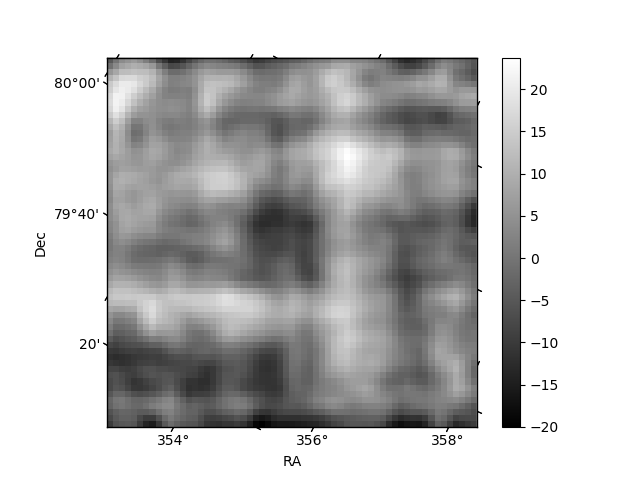
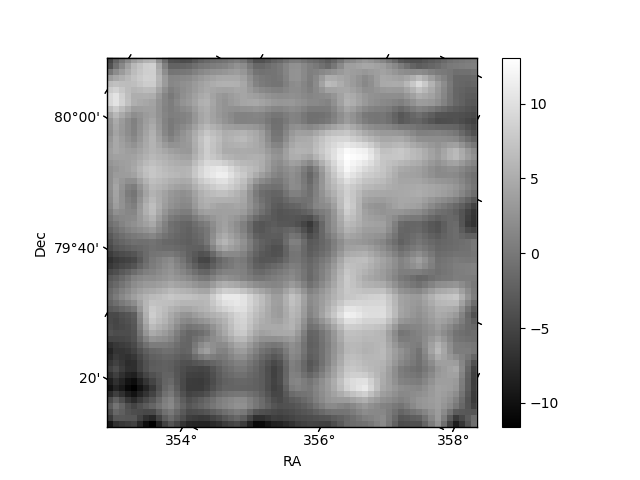
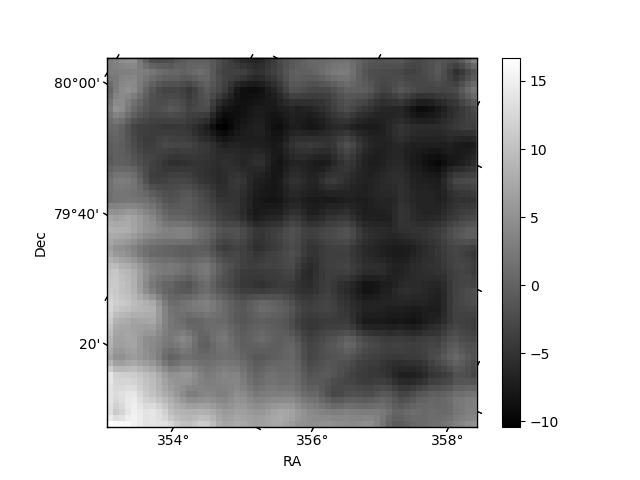
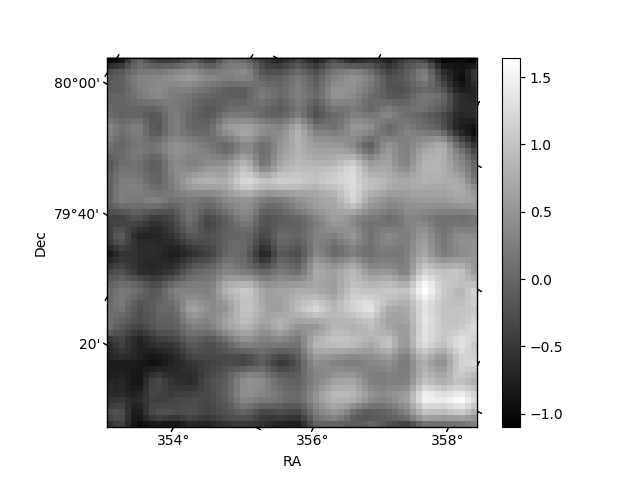
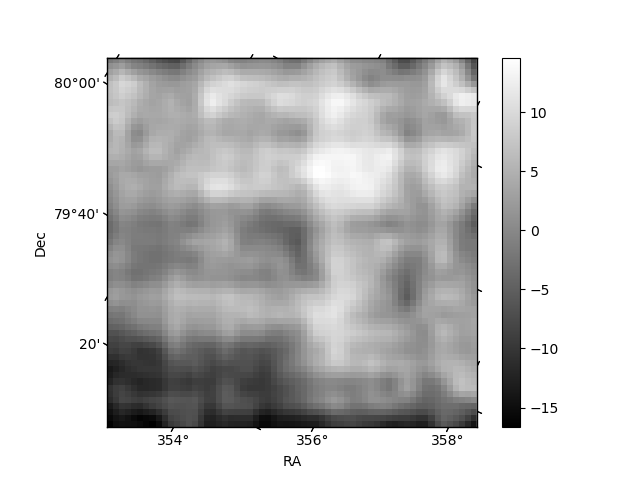
Histogram calculated using DETX and DETY for each event in the final _common_clean file
| Quadrant A | 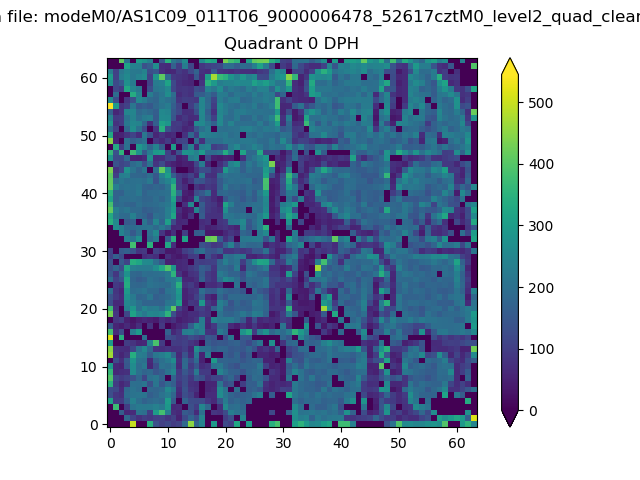 |
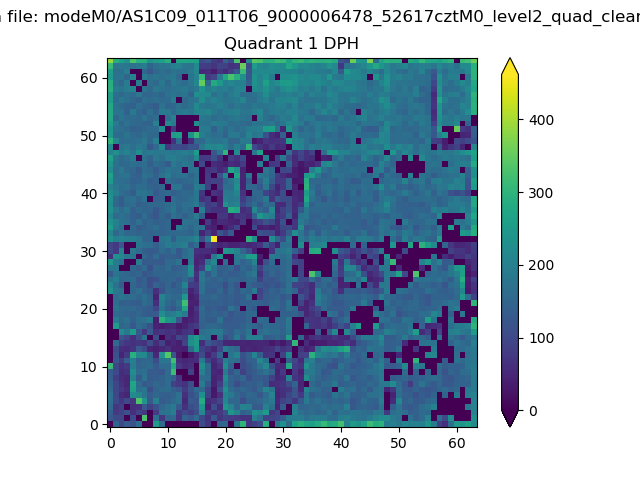 |
Quadrant B |
|---|---|---|---|
| Quadrant D | 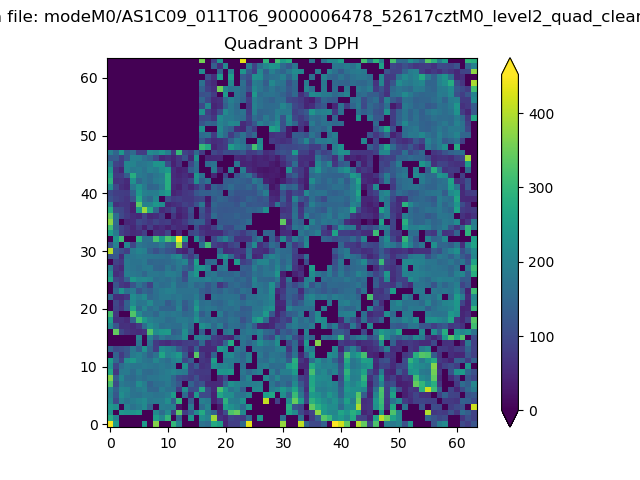 |
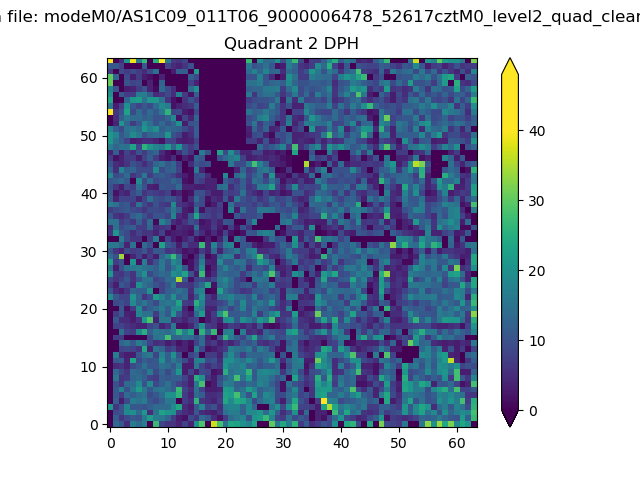 |
Quadrant C |
| Plot type | Count rate plots | Images |
|---|---|---|
| Comparison with Poisson distribution Blue bars denote a histogram of data divided into 1 sec bins. Red curve is a Poisson curve with rate = median count rate of data. |
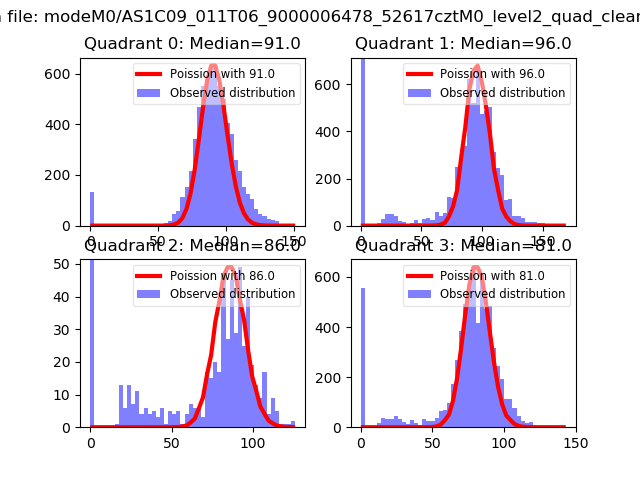 |
 |
| Quadrant-wise count rates Data is divided into 100 sec bins |
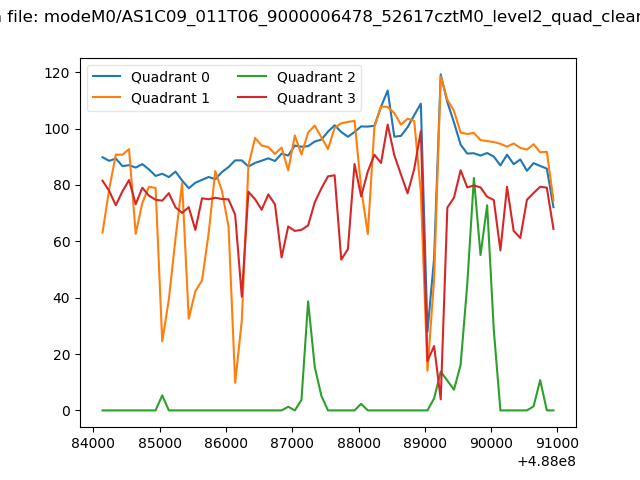 |
|
| Module-wise count rates for Quadrant A Data is divided into 100 sec bins |
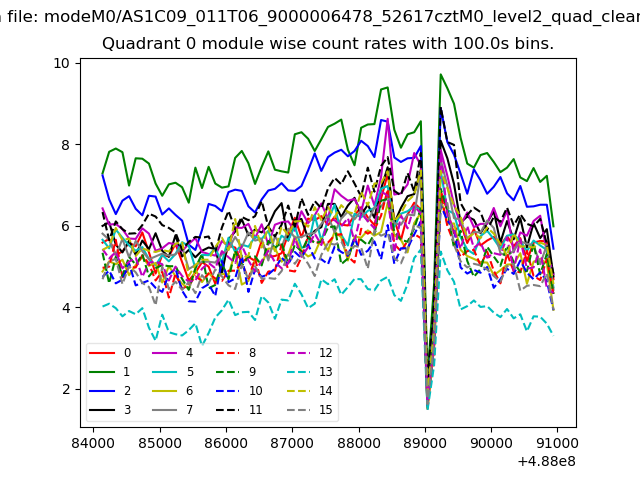 |
 |
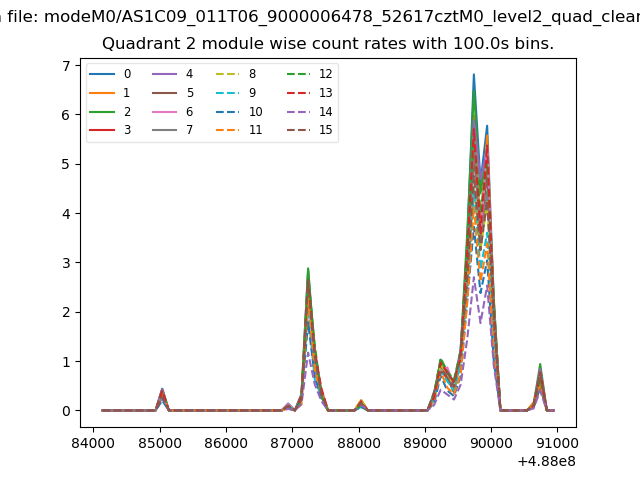
| Module-wise count rates for Quadrant B Data is divided into 100 sec bins |
 |
 |
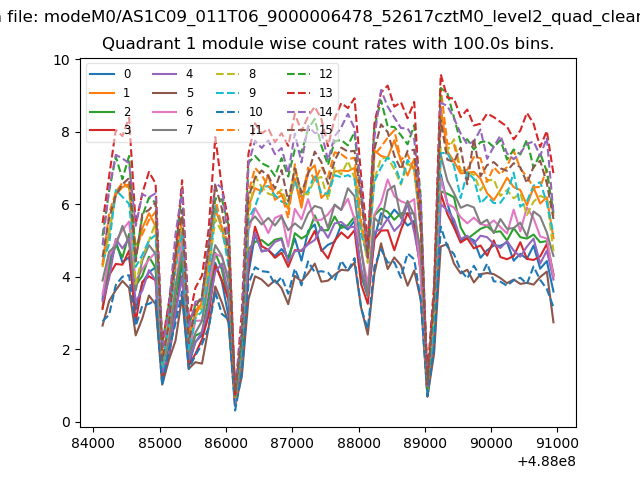
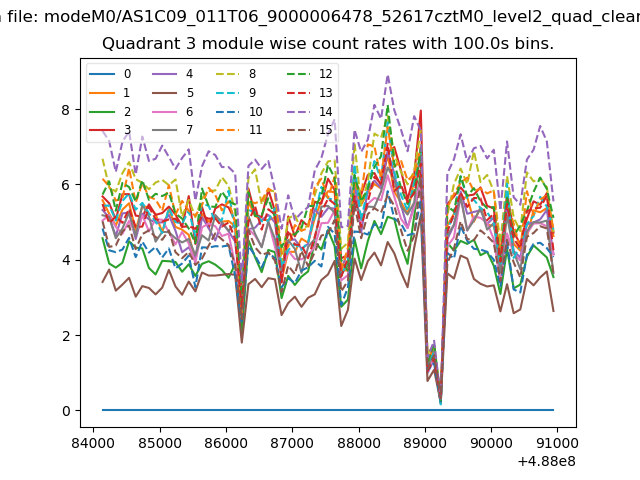
| Module-wise count rates for Quadrant C Data is divided into 100 sec bins |
 |
 |
| Module-wise count rates for Quadrant D Data is divided into 100 sec bins |
 |
 |
| Parameter | Plot |
|---|---|
| CZT HV Monitor | 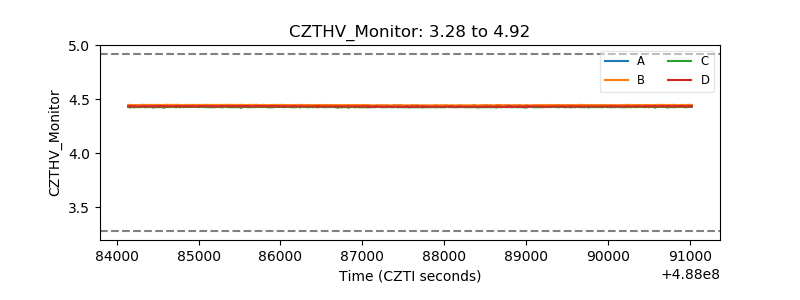 |
| D_VDD | 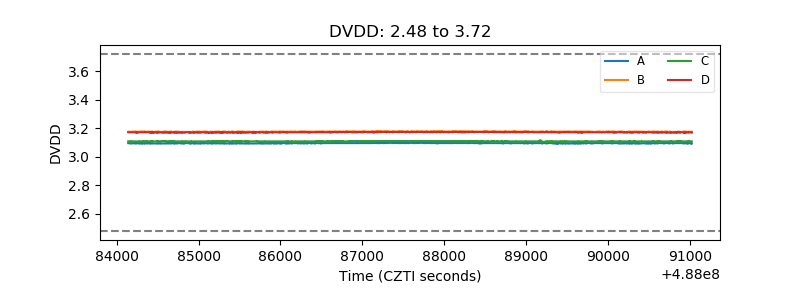 |
| Temperature 1 | 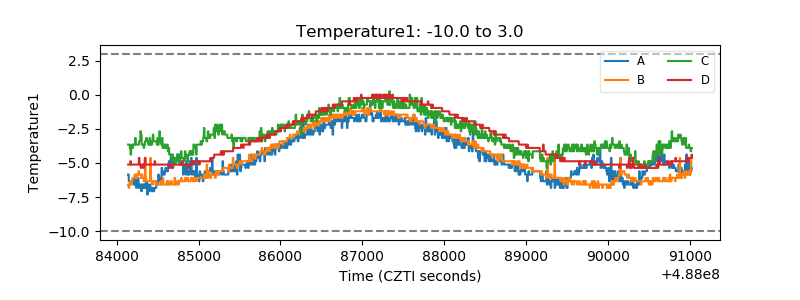 |
| Veto HV Monitor | 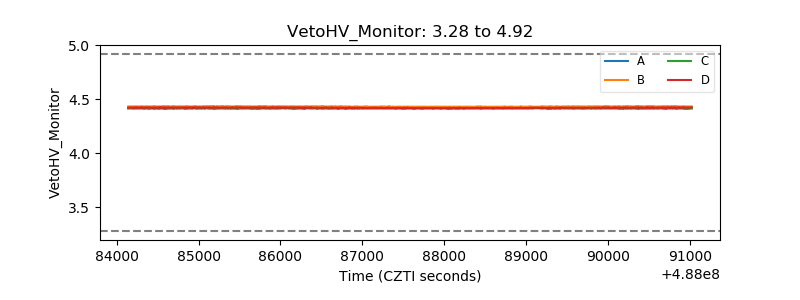 |
| Veto LLD | 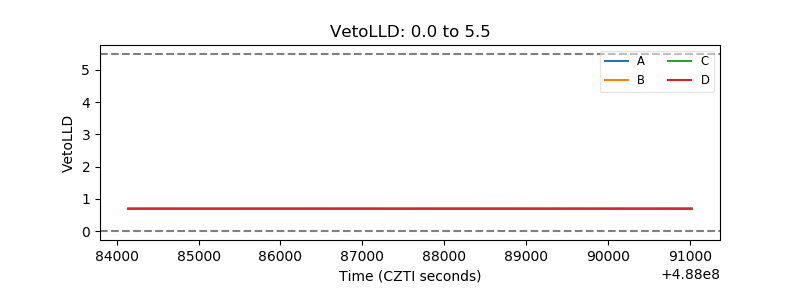 |
| Alpha Counter | 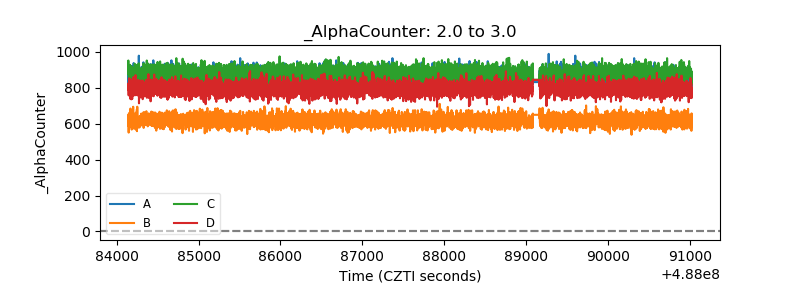 |
| _CPM_Rate | 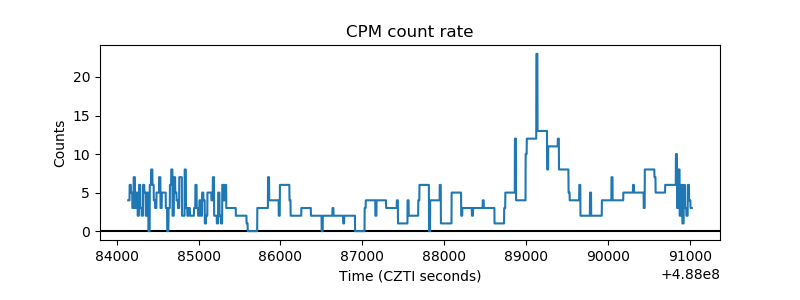 |
| CZT Counter | 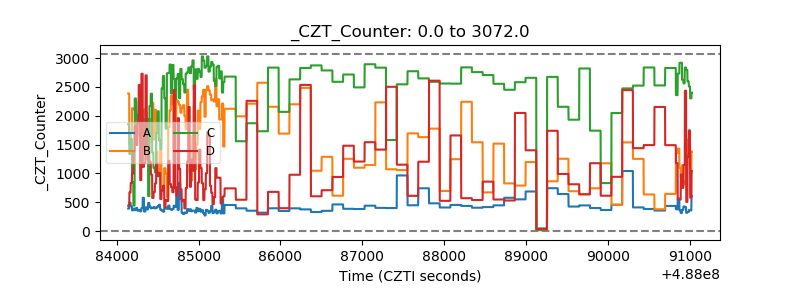 |
| +2.5 Volts monitor | 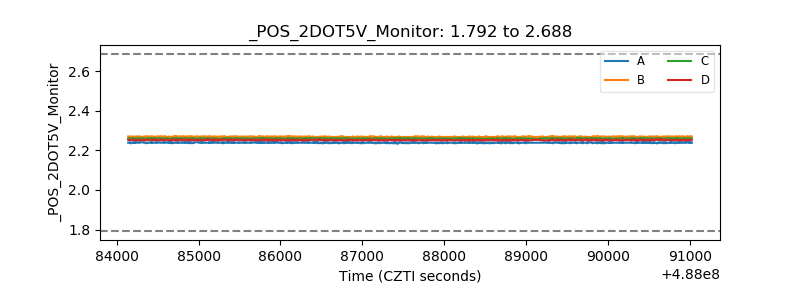 |
| +5 Volts monitor |  |
| _ROLL_ROT | 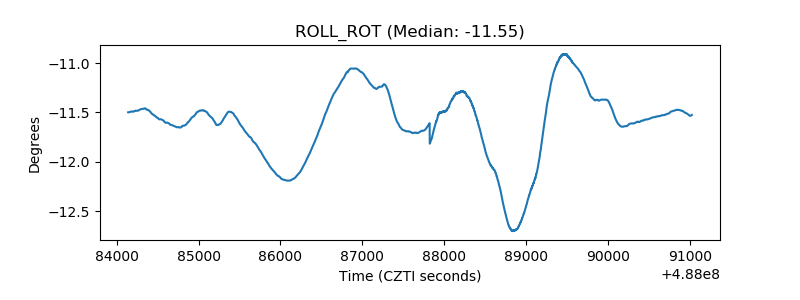 |
| _Roll_DEC | 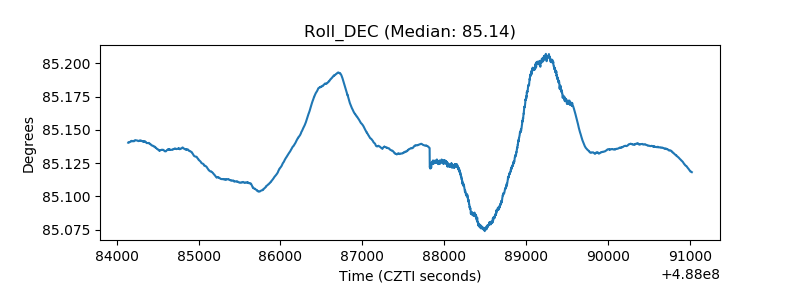 |
| _Roll_RA | 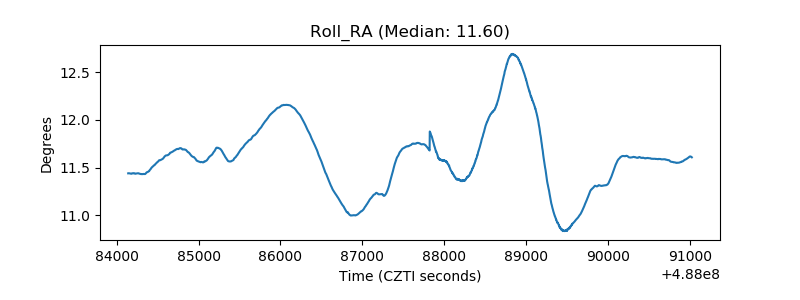 |
| Veto Counter | 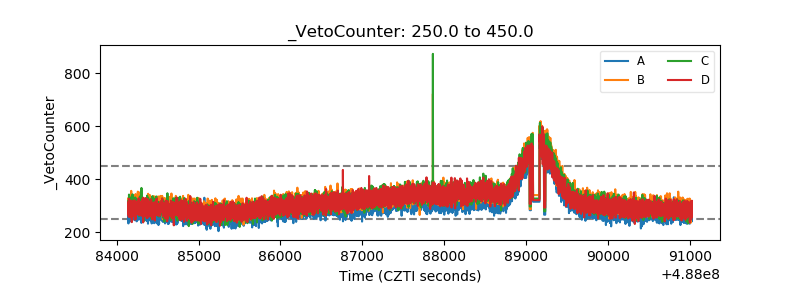 |