| Param | Original file | Final file |
|---|---|---|
| Filename | modeM0/AS1C09_011T06_9000006478_52622cztM0_level2.fits | modeM0/AS1C09_011T06_9000006478_52622cztM0_level2_quad_clean.evt |
| Size (bytes) | 2,946,974,400 | 191,900,160 |
| Size | 2.7 GB | 183.0 MB |
| Events in quadrant A | 11,937,205 | 1,551,166 |
| Events in quadrant B | 21,708,274 | 1,684,293 |
| Events in quadrant C | 45,708,821 | 235,851 |
| Events in quadrant D | 28,300,844 | 1,051,193 |
| Mode M0 | |||
|---|---|---|---|
| Quadrant | BADHDUFLAG | Total packets | Discarded packets |
| A | 0 | 48404 | 4 |
| B | 0 | 77674 | 4 |
| C | 0 | 148333 | 4 |
| D | 0 | 97007 | 9 |
| Mode M9 | |||
|---|---|---|---|
| Quadrant | BADHDUFLAG | Total packets | Discarded packets |
| A | 0 | 13 | 0 |
| B | 0 | 13 | 0 |
| C | 0 | 13 | 0 |
| D | 0 | 13 | 0 |
| Mode SS | |||
|---|---|---|---|
| Quadrant | BADHDUFLAG | Total packets | Discarded packets |
| A | 0 | 380 | 0 |
| B | 0 | 380 | 0 |
| C | 0 | 380 | 0 |
| D | 0 | 380 | 0 |
| Quadrant | Total seconds | Saturated seconds | Saturation percentage |
|---|---|---|---|
| A | 18661 | 1341 | 7.186110% |
| B | 18661 | 1937 | 10.379937% |
| C | 18662 | 16417 | 87.970207% |
| D | 18661 | 6084 | 32.602754% |
Noise dominated data is calculated using 1-second bins in cleaned event files. If a bin has >2000 counts, and if more than 50% of those come from <1% of pixels, then it is considered to be noise-dominated and hence unusable.
| Quadrant | # 1 sec bins | Bins with >0 counts | Bins with >2000 counts | High rate bins dominated by noise | Noise dominated (total time) | Noise dominated (detector-on time) | Marked lightcurve |
|---|---|---|---|---|---|---|---|
| A | 19996 | 18666 | 986 | 986 | 4.93% | 5.28% | 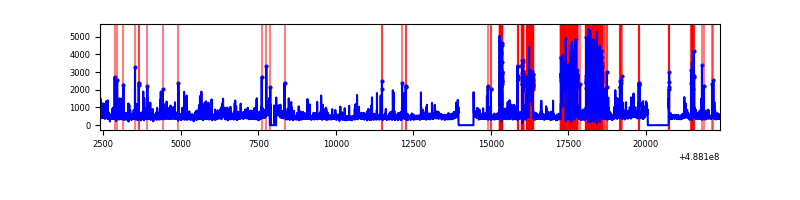 |
| B | 19996 | 18666 | 1024 | 1024 | 5.12% | 5.49% | 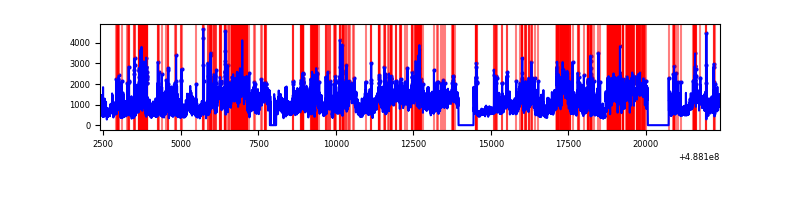 |
| C | 19996 | 18662 | 14727 | 14727 | 73.65% | 78.91% | 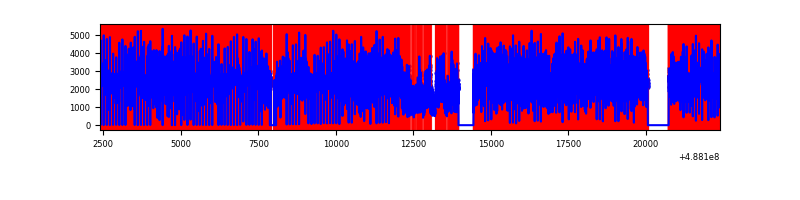 |
| D | 19996 | 18666 | 5550 | 5550 | 27.76% | 29.73% | 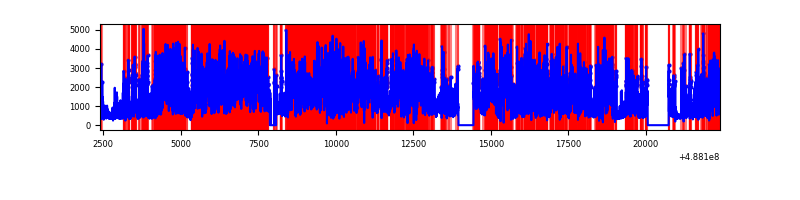 |
Top three noisy pixels from each quadrant. If the there are fewer than three noisy pixels in the level2.evt file, extra rows are filled as -1
| Pixel properties | Quadrant properties | ||||||
|---|---|---|---|---|---|---|---|
| Quadrant | DetID | PixID | Counts | Sigma | Mean | Median | Sigma |
| A | 3 | 110 | 2378541 | 4985.48 | 1886 | 1839 | 476.7 |
| A | 3 | 46 | 537089 | 1122.76 | 1886 | 1839 | 476.7 |
| A | 3 | 14 | 269445 | 561.34 | 1886 | 1839 | 476.7 |
| B | 10 | 254 | 11128850 | 28081.47 | 1867 | 1803 | 396.2 |
| B | 10 | 128 | 693662 | 1746.05 | 1867 | 1803 | 396.2 |
| B | 8 | 234 | 615266 | 1548.2 | 1867 | 1803 | 396.2 |
| C | 15 | 248 | 41929349 | 203308.36 | 741 | 734 | 206.2 |
| C | 12 | 254 | 189117 | 913.45 | 741 | 734 | 206.2 |
| C | 15 | 147 | 148240 | 715.24 | 741 | 734 | 206.2 |
| D | 6 | 42 | 6637404 | 14005.54 | 1645 | 1565 | 473.8 |
| D | 2 | 62 | 3970725 | 8377.27 | 1645 | 1565 | 473.8 |
| D | 12 | 17 | 3352141 | 7071.69 | 1645 | 1565 | 473.8 |
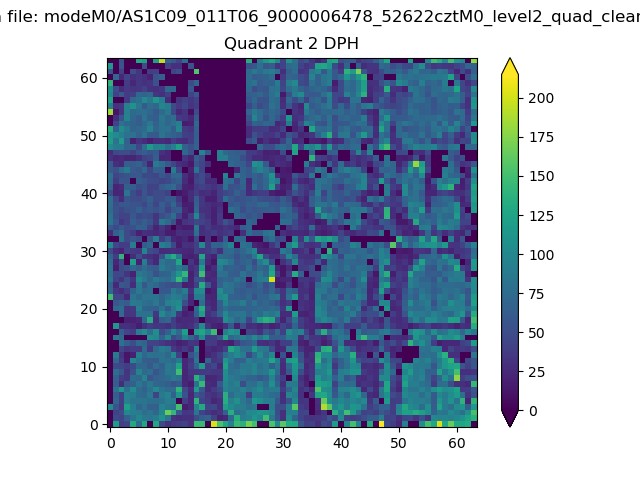
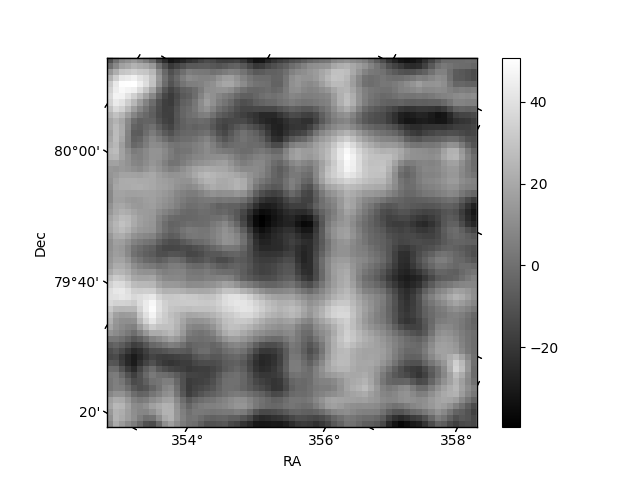
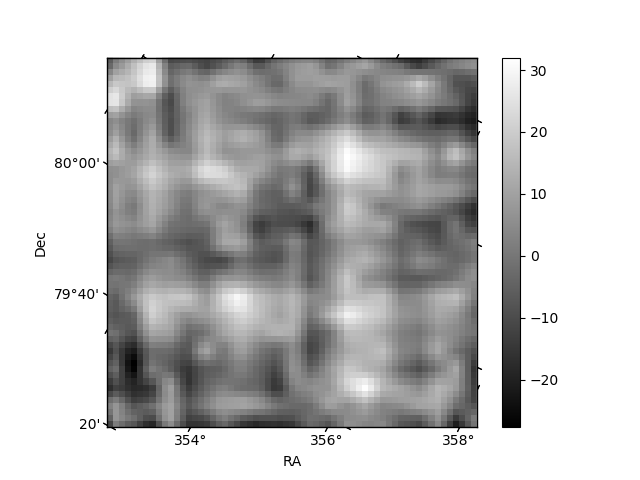
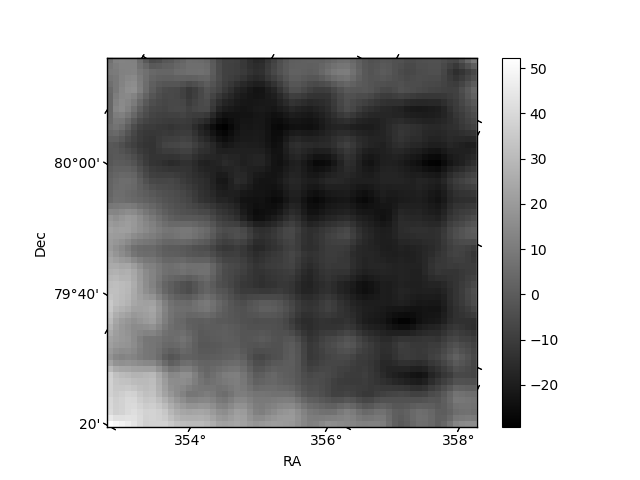
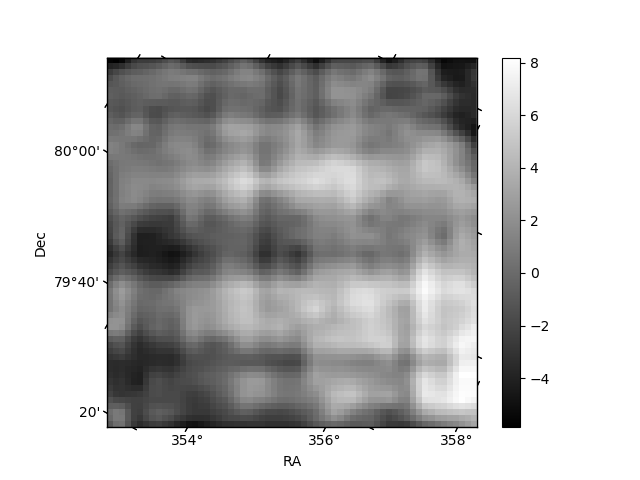
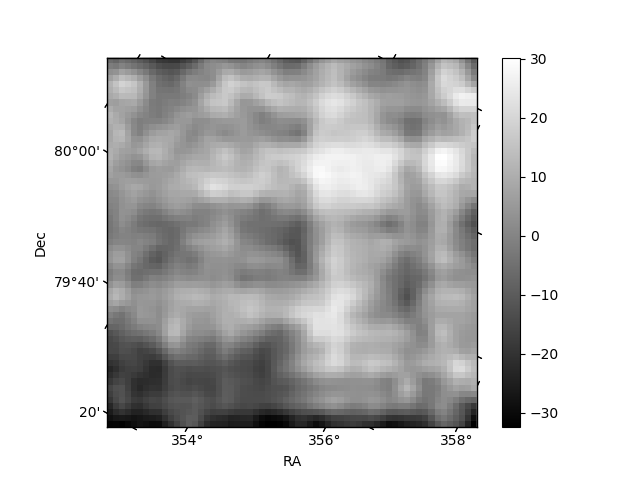
Histogram calculated using DETX and DETY for each event in the final _common_clean file
| Quadrant A | 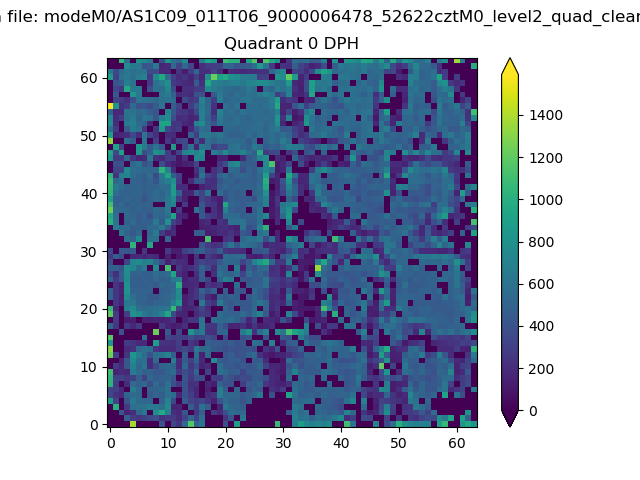 |
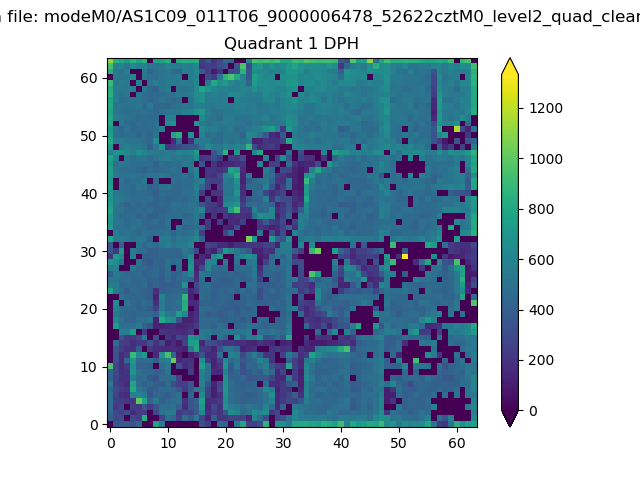 |
Quadrant B |
|---|---|---|---|
| Quadrant D | 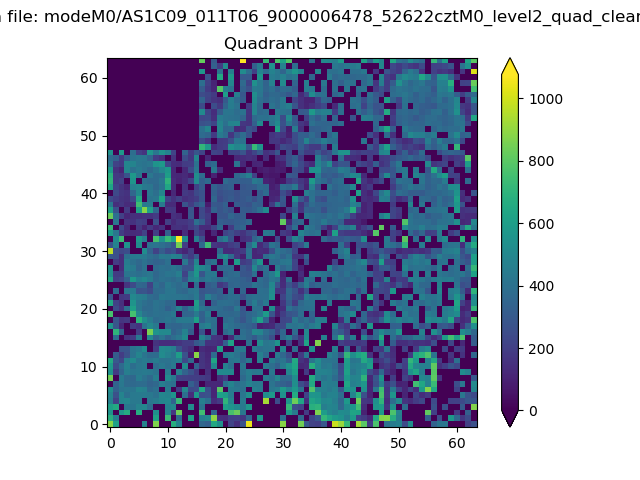 |
 |
Quadrant C |
| Plot type | Count rate plots | Images |
|---|---|---|
| Comparison with Poisson distribution Blue bars denote a histogram of data divided into 1 sec bins. Red curve is a Poisson curve with rate = median count rate of data. |
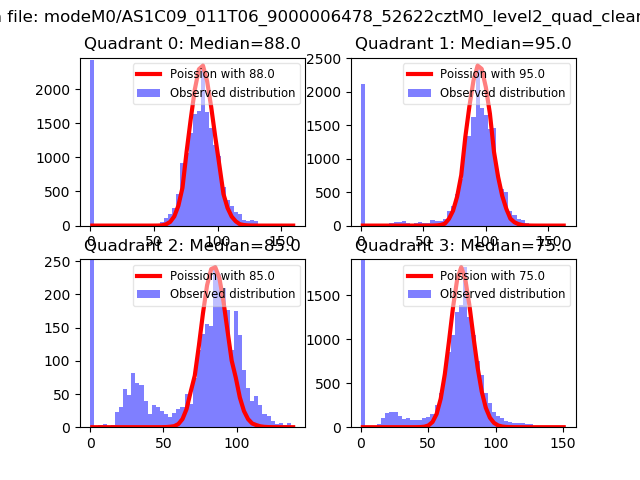 |
 |
| Quadrant-wise count rates Data is divided into 100 sec bins |
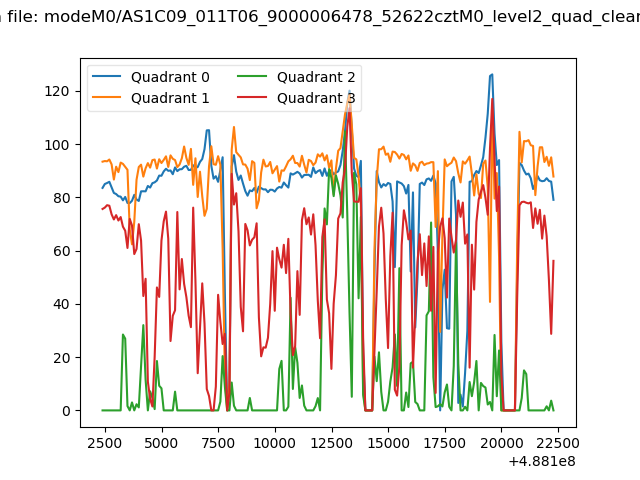 |
|
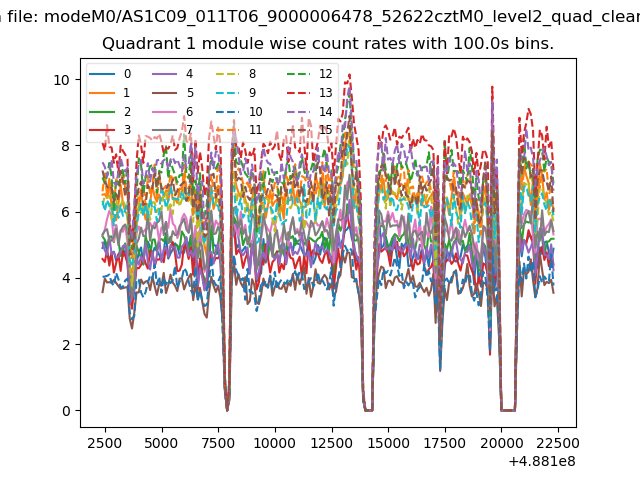
| Module-wise count rates for Quadrant A Data is divided into 100 sec bins |
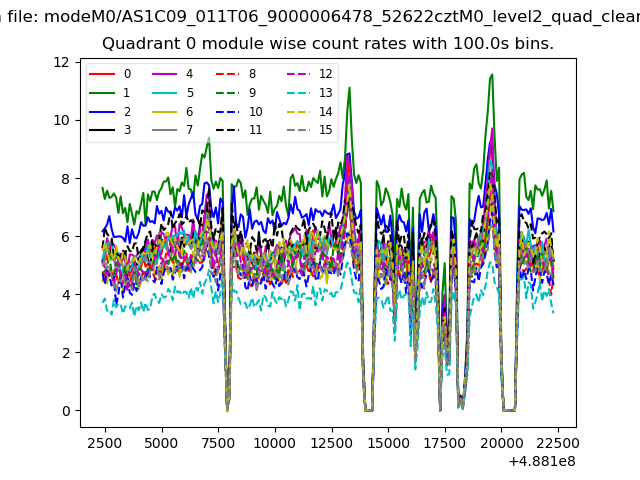 |
 |
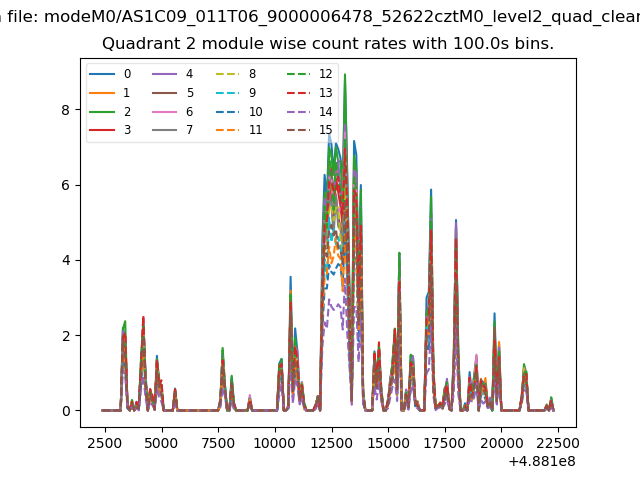
| Module-wise count rates for Quadrant B Data is divided into 100 sec bins |
 |
 |
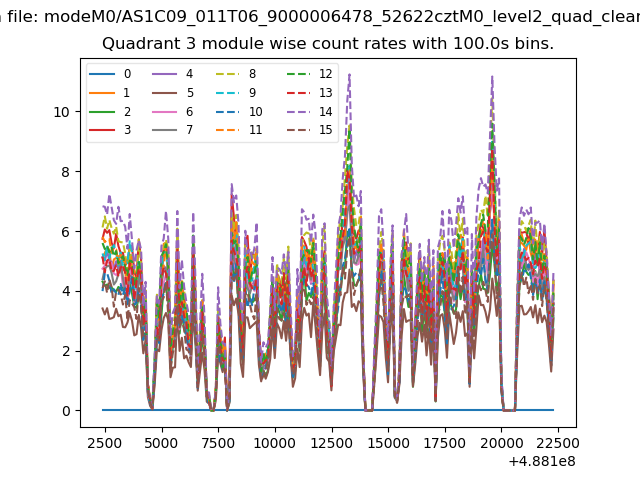
| Module-wise count rates for Quadrant C Data is divided into 100 sec bins |
 |
 |
| Module-wise count rates for Quadrant D Data is divided into 100 sec bins |
 |
 |
| Parameter | Plot |
|---|---|
| CZT HV Monitor | 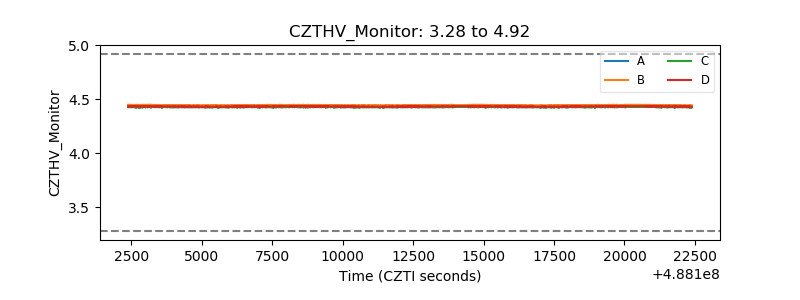 |
| D_VDD | 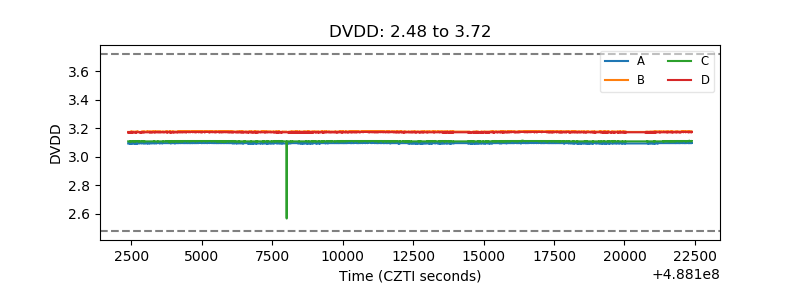 |
| Temperature 1 | 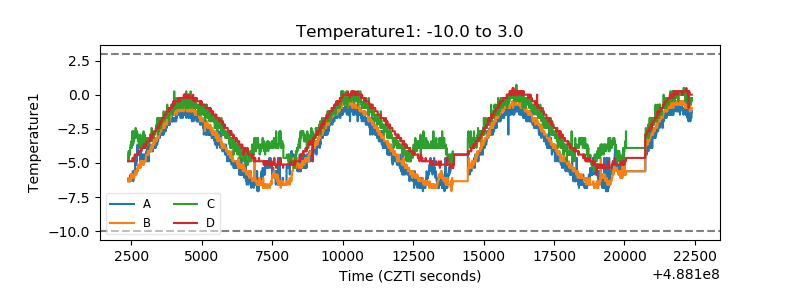 |
| Veto HV Monitor | 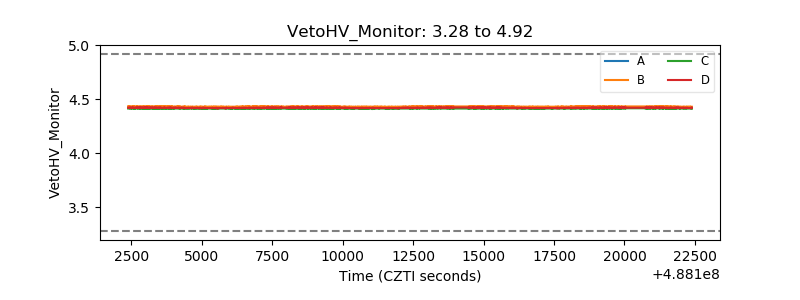 |
| Veto LLD | 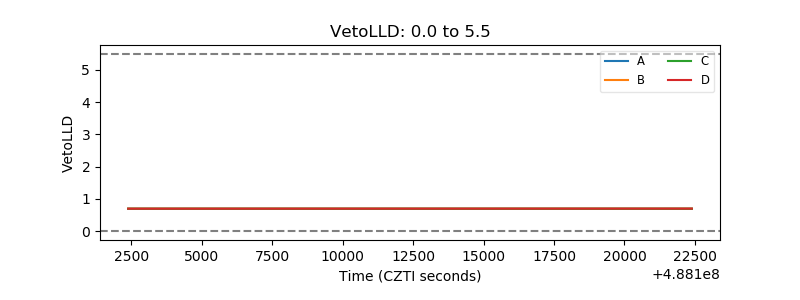 |
| Alpha Counter | 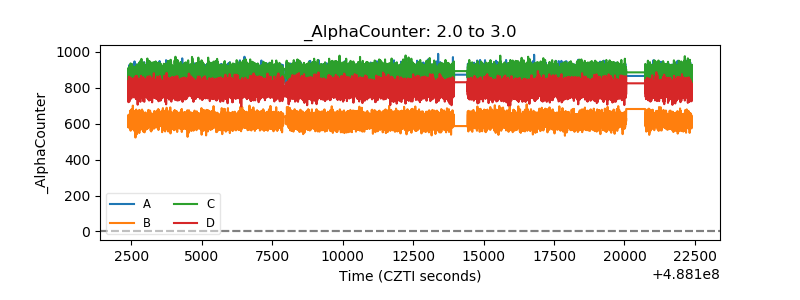 |
| _CPM_Rate | 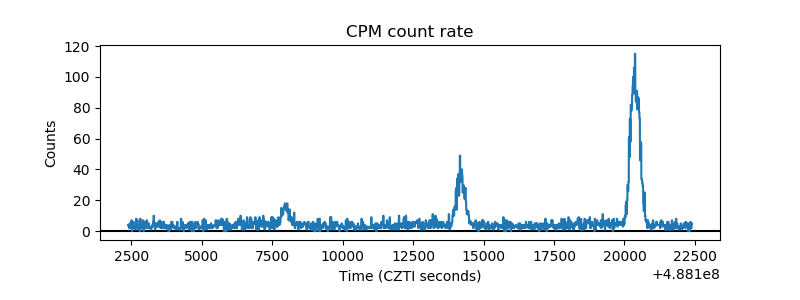 |
| CZT Counter | 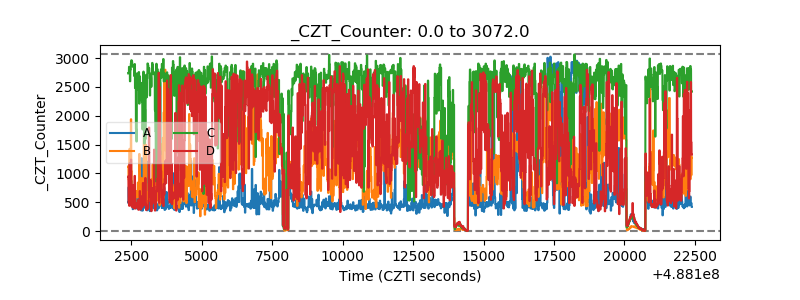 |
| +2.5 Volts monitor |  |
| +5 Volts monitor |  |
| _ROLL_ROT | 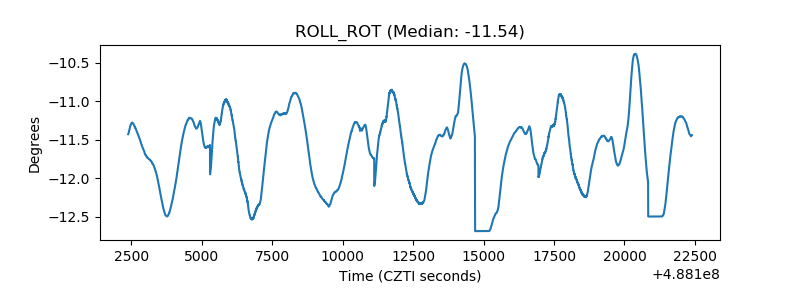 |
| _Roll_DEC | 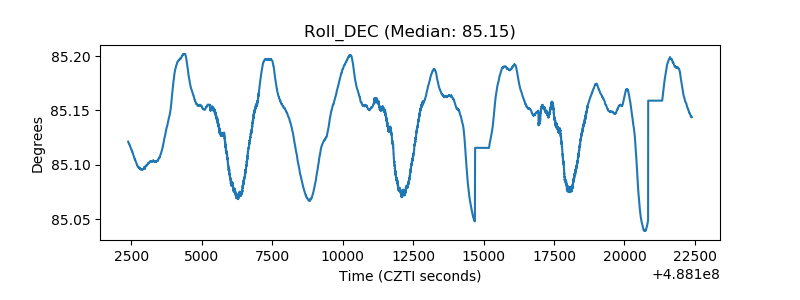 |
| _Roll_RA | 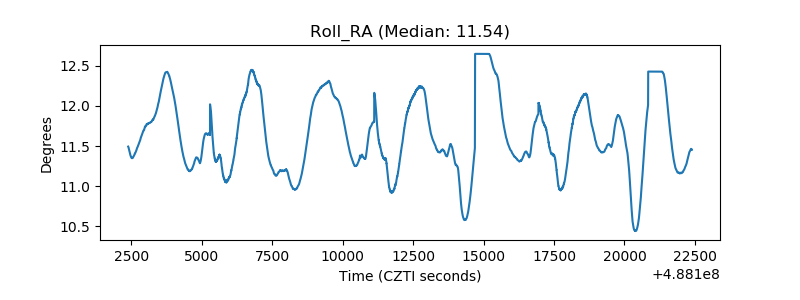 |
| Veto Counter | 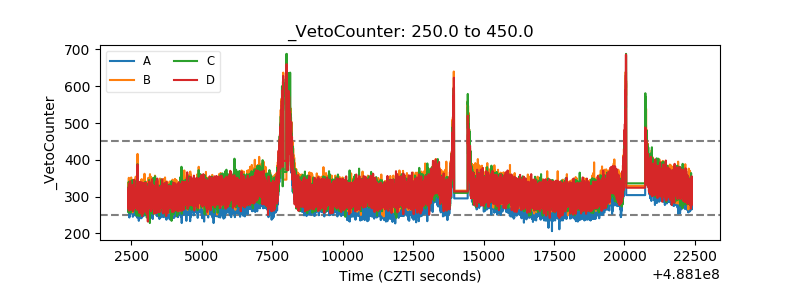 |