| Param | Original file | Final file |
|---|---|---|
| Filename | modeM0/AS1C09_011T06_9000006478_52627cztM0_level2.fits | modeM0/AS1C09_011T06_9000006478_52627cztM0_level2_quad_clean.evt |
| Size (bytes) | 740,093,760 | 79,542,720 |
| Size | 705.8 MB | 75.9 MB |
| Events in quadrant A | 3,126,486 | 596,954 |
| Events in quadrant B | 3,949,857 | 620,986 |
| Events in quadrant C | 10,207,378 | 375,562 |
| Events in quadrant D | 9,641,486 | 389,456 |
| Mode M0 | |||
|---|---|---|---|
| Quadrant | BADHDUFLAG | Total packets | Discarded packets |
| A | 0 | 13497 | 1 |
| B | 0 | 15947 | 1 |
| C | 0 | 34573 | 1 |
| D | 0 | 32826 | 7 |
| Mode M9 | |||
|---|---|---|---|
| Quadrant | BADHDUFLAG | Total packets | Discarded packets |
| A | 0 | 12 | 0 |
| B | 0 | 12 | 0 |
| C | 0 | 12 | 0 |
| D | 0 | 12 | 0 |
| Mode SS | |||
|---|---|---|---|
| Quadrant | BADHDUFLAG | Total packets | Discarded packets |
| A | 0 | 124 | 0 |
| B | 0 | 124 | 0 |
| C | 0 | 124 | 0 |
| D | 0 | 124 | 0 |
| Quadrant | Total seconds | Saturated seconds | Saturation percentage |
|---|---|---|---|
| A | 6087 | 39 | 0.640710% |
| B | 6088 | 230 | 3.777924% |
| C | 6088 | 2421 | 39.766754% |
| D | 6087 | 1976 | 32.462625% |
Noise dominated data is calculated using 1-second bins in cleaned event files. If a bin has >2000 counts, and if more than 50% of those come from <1% of pixels, then it is considered to be noise-dominated and hence unusable.
| Quadrant | # 1 sec bins | Bins with >0 counts | Bins with >2000 counts | High rate bins dominated by noise | Noise dominated (total time) | Noise dominated (detector-on time) | Marked lightcurve |
|---|---|---|---|---|---|---|---|
| A | 7282 | 6088 | 13 | 13 | 0.18% | 0.21% | 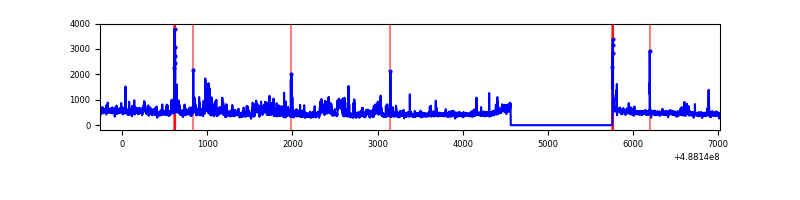 |
| B | 7283 | 6089 | 121 | 121 | 1.66% | 1.99% | 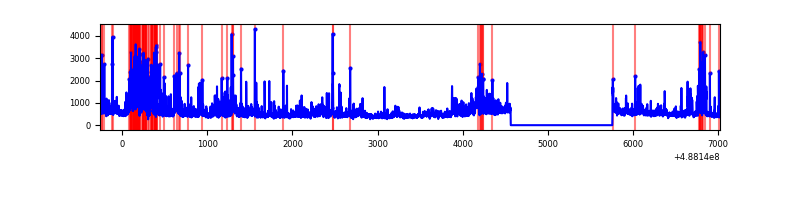 |
| C | 7283 | 6089 | 2192 | 2192 | 30.10% | 36.00% | 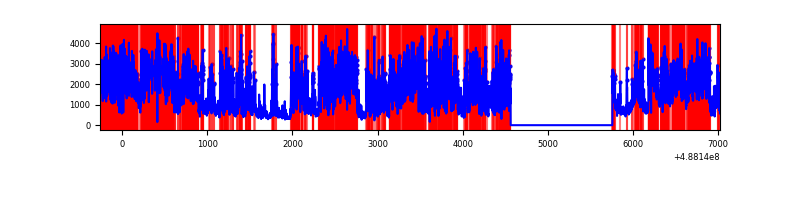 |
| D | 7282 | 6088 | 1791 | 1791 | 24.59% | 29.42% | 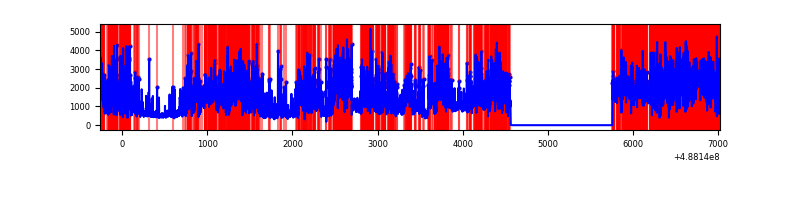 |
Top three noisy pixels from each quadrant. If the there are fewer than three noisy pixels in the level2.evt file, extra rows are filled as -1
| Pixel properties | Quadrant properties | ||||||
|---|---|---|---|---|---|---|---|
| Quadrant | DetID | PixID | Counts | Sigma | Mean | Median | Sigma |
| A | 3 | 14 | 337942 | 2111.16 | 635 | 618 | 159.8 |
| A | 0 | 30 | 46014 | 284.11 | 635 | 618 | 159.8 |
| A | 13 | 6 | 43555 | 268.72 | 635 | 618 | 159.8 |
| B | 10 | 128 | 401624 | 3018.62 | 628 | 606 | 132.8 |
| B | 1 | 255 | 354649 | 2665.02 | 628 | 606 | 132.8 |
| B | 10 | 254 | 305816 | 2297.43 | 628 | 606 | 132.8 |
| C | 15 | 248 | 7242946 | 49679.67 | 523 | 518 | 145.8 |
| C | 15 | 224 | 197869 | 1353.74 | 523 | 518 | 145.8 |
| C | 15 | 147 | 159585 | 1091.13 | 523 | 518 | 145.8 |
| D | 12 | 33 | 1751097 | 11165.78 | 541 | 516 | 156.8 |
| D | 6 | 42 | 1688594 | 10767.12 | 541 | 516 | 156.8 |
| D | 1 | 7 | 1166809 | 7439.0 | 541 | 516 | 156.8 |
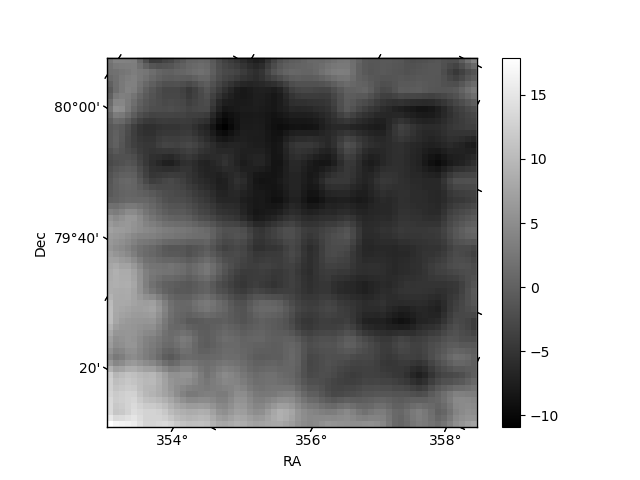
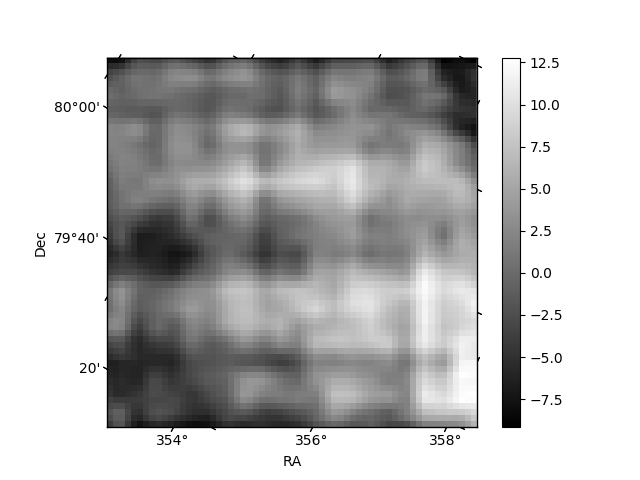
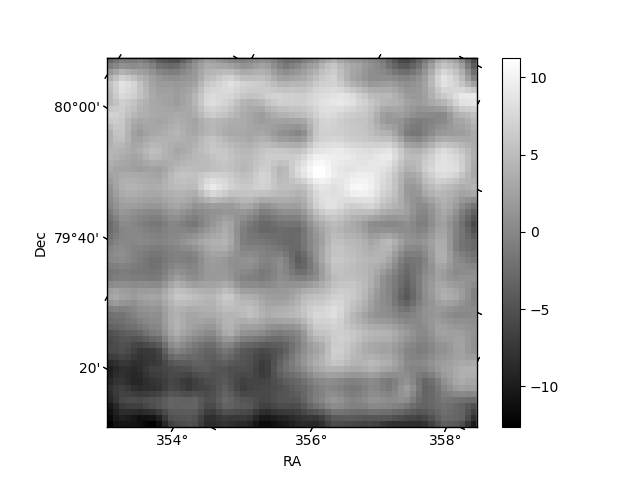
Histogram calculated using DETX and DETY for each event in the final _common_clean file
| Quadrant A | 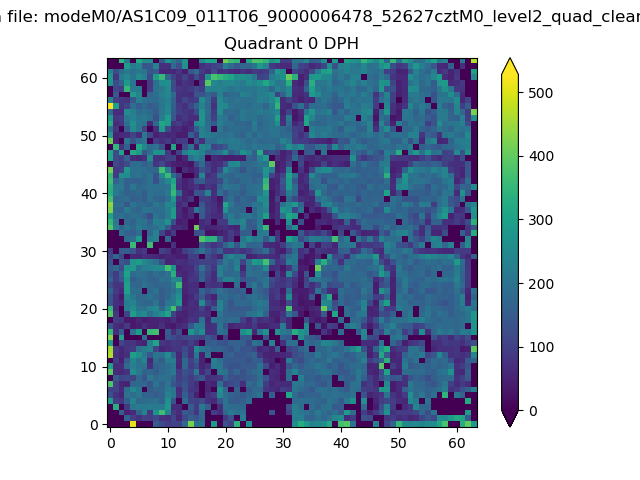 |
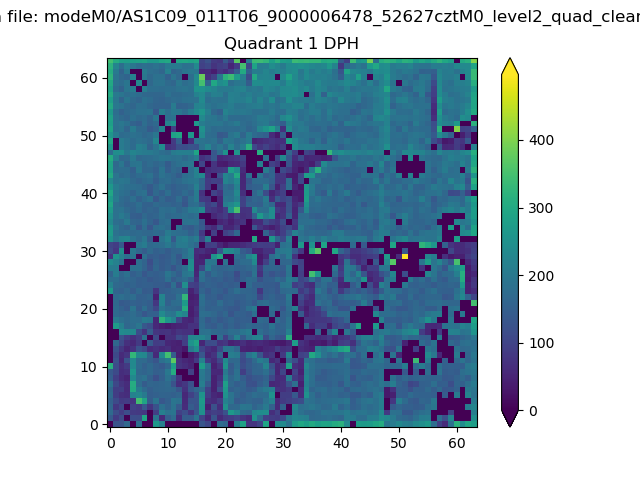 |
Quadrant B |
|---|---|---|---|
| Quadrant D | 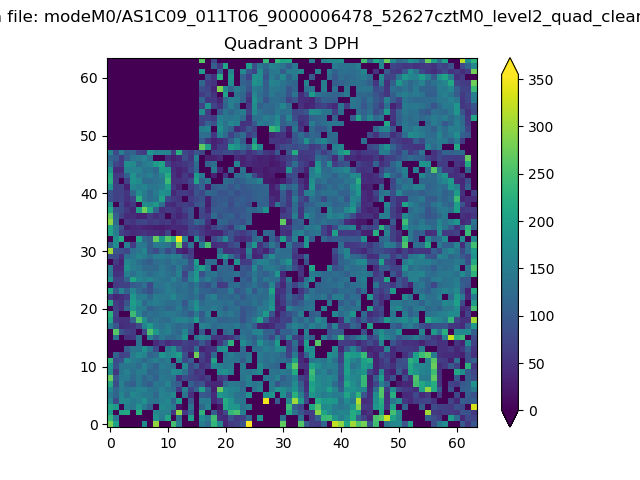 |
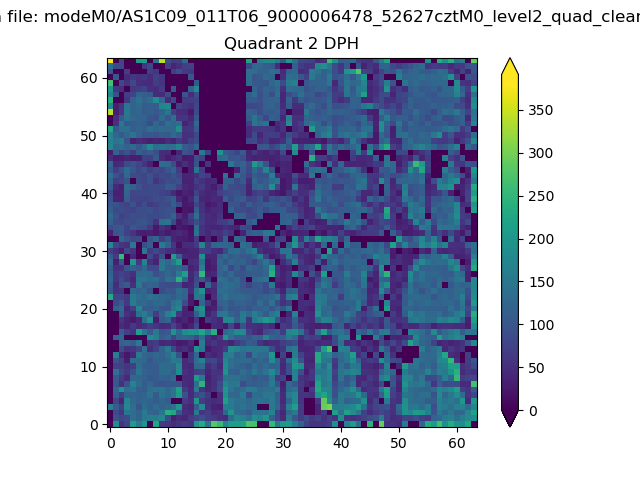 |
Quadrant C |
| Plot type | Count rate plots | Images |
|---|---|---|
| Comparison with Poisson distribution Blue bars denote a histogram of data divided into 1 sec bins. Red curve is a Poisson curve with rate = median count rate of data. |
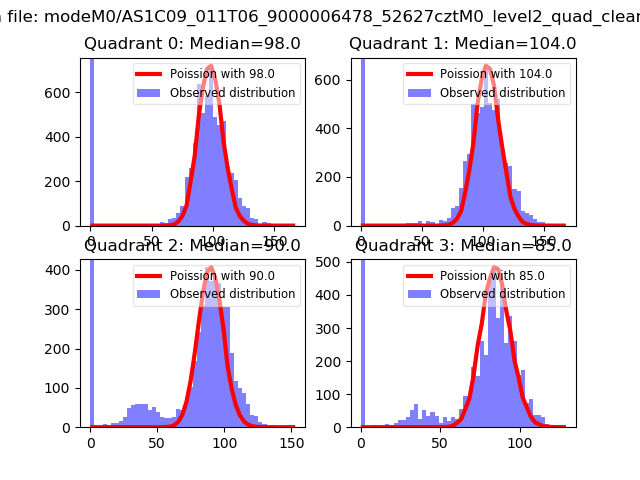 |
 |
| Quadrant-wise count rates Data is divided into 100 sec bins |
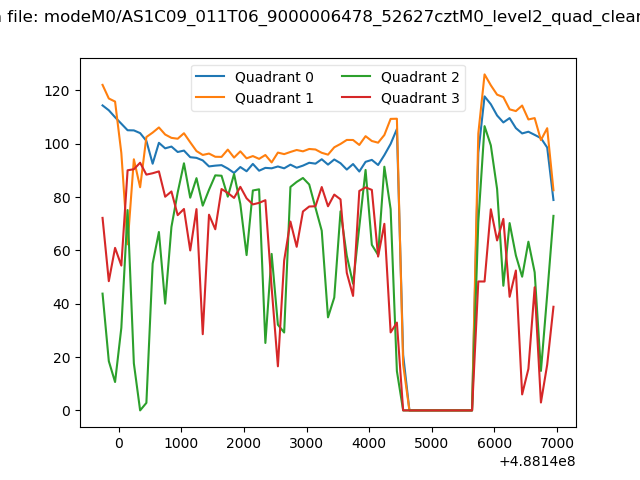 |
|
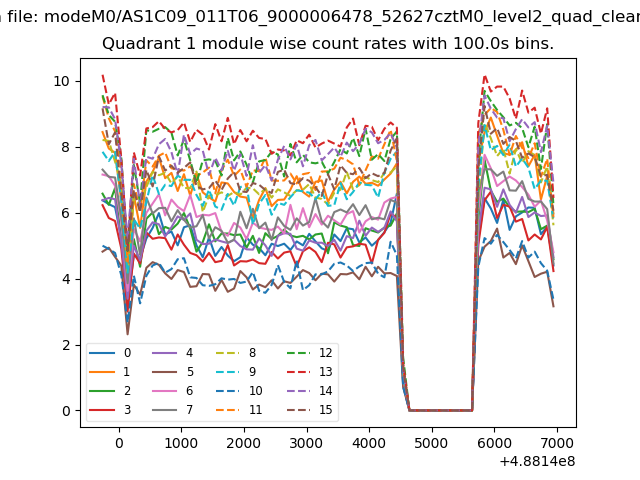
| Module-wise count rates for Quadrant A Data is divided into 100 sec bins |
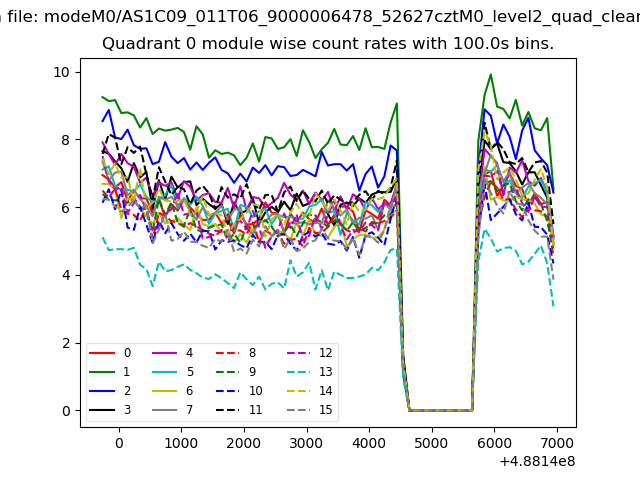 |
 |
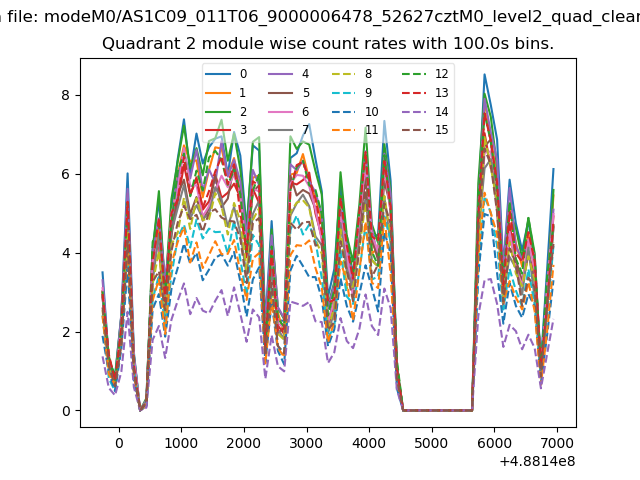
| Module-wise count rates for Quadrant B Data is divided into 100 sec bins |
 |
 |
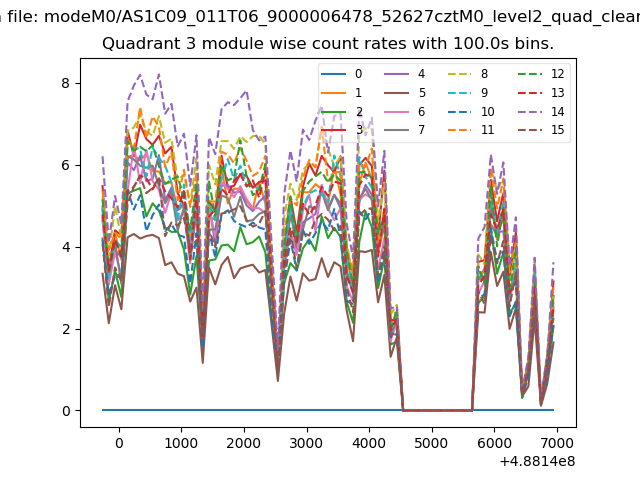
| Module-wise count rates for Quadrant C Data is divided into 100 sec bins |
 |
 |
| Module-wise count rates for Quadrant D Data is divided into 100 sec bins |
 |
 |
| Parameter | Plot |
|---|---|
| CZT HV Monitor | 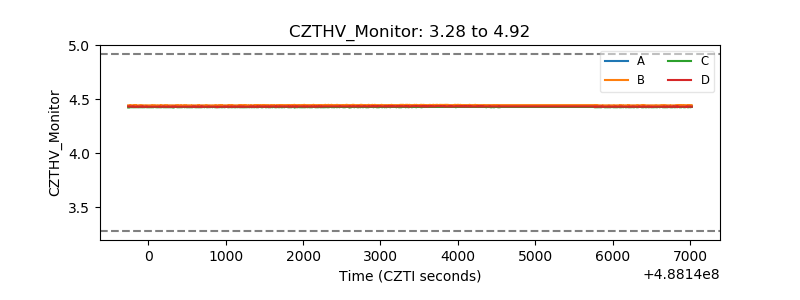 |
| D_VDD | 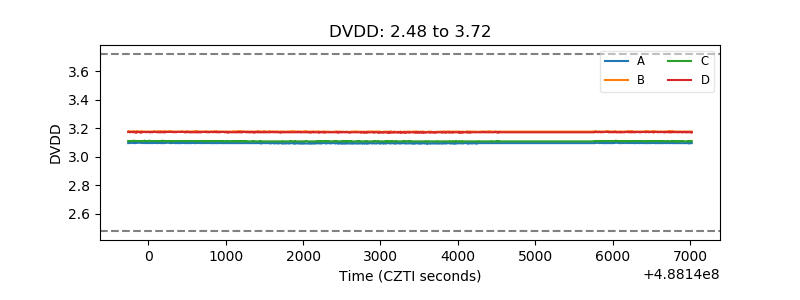 |
| Temperature 1 | 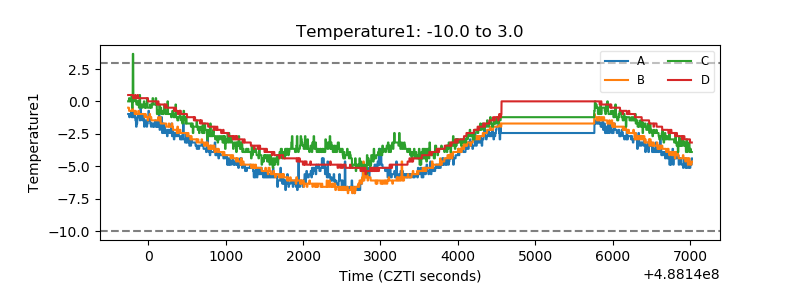 |
| Veto HV Monitor | 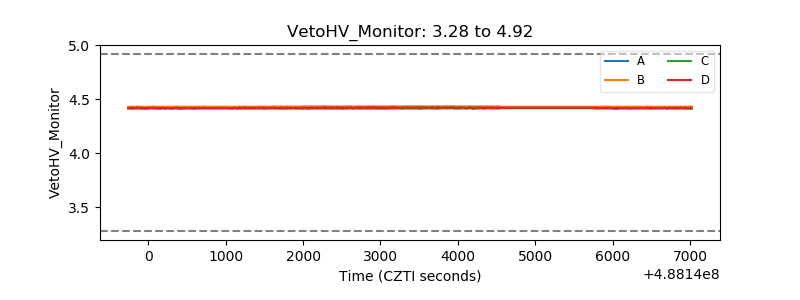 |
| Veto LLD | 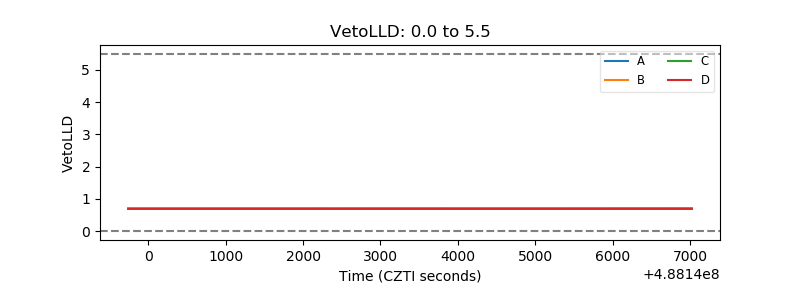 |
| Alpha Counter | 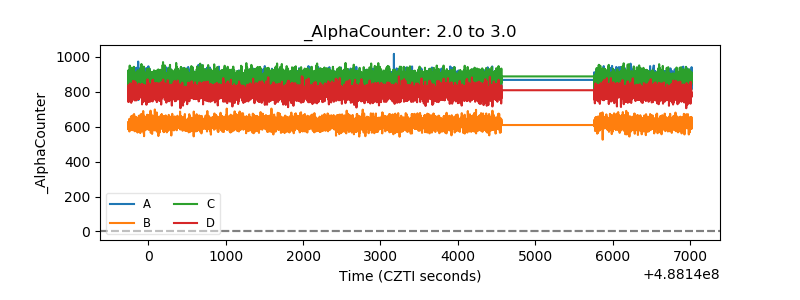 |
| _CPM_Rate | 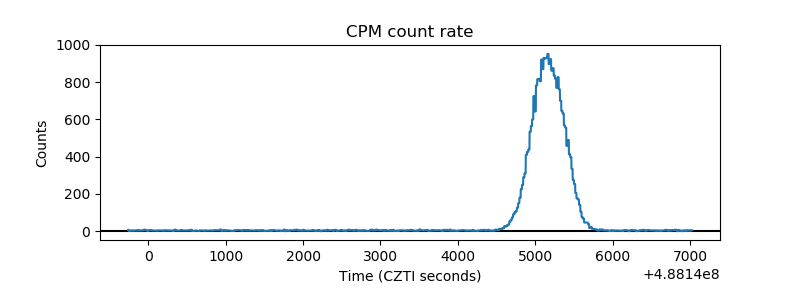 |
| CZT Counter | 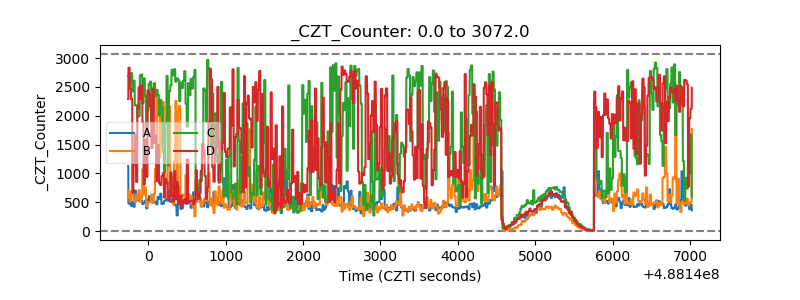 |
| +2.5 Volts monitor |  |
| +5 Volts monitor |  |
| _ROLL_ROT | 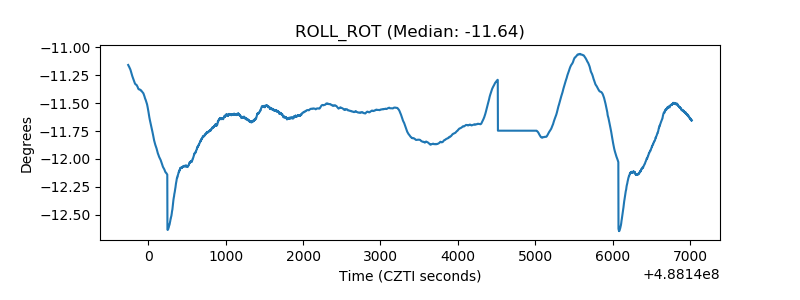 |
| _Roll_DEC | 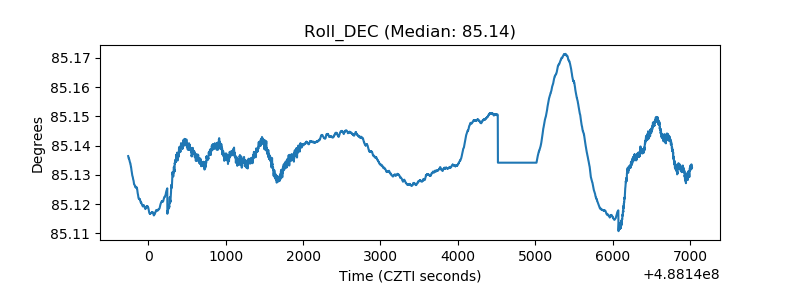 |
| _Roll_RA | 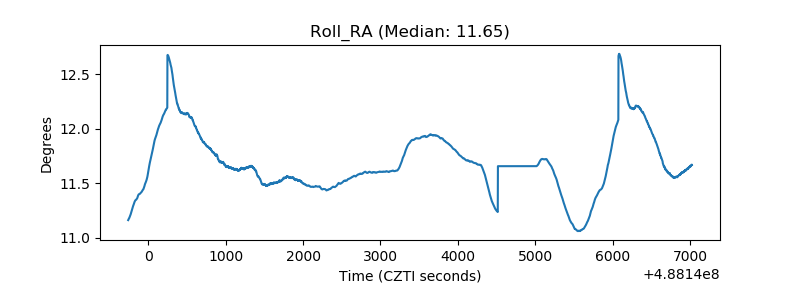 |
| Veto Counter | 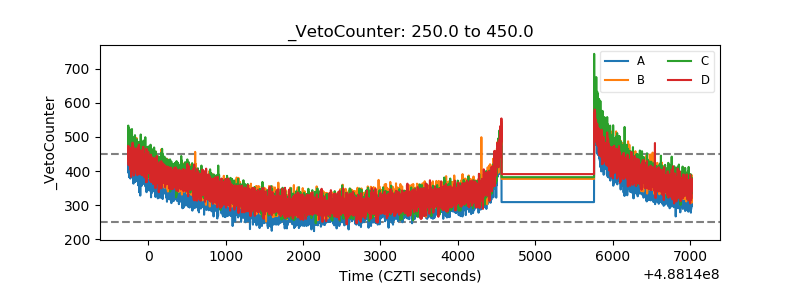 |