| Param | Original file | Final file |
|---|---|---|
| Filename | modeM0/AS1C09_011T06_9000006478_52628cztM0_level2.fits | modeM0/AS1C09_011T06_9000006478_52628cztM0_level2_quad_clean.evt |
| Size (bytes) | 801,996,480 | 80,055,360 |
| Size | 764.8 MB | 76.3 MB |
| Events in quadrant A | 2,962,250 | 623,429 |
| Events in quadrant B | 6,622,972 | 548,652 |
| Events in quadrant C | 8,608,257 | 448,764 |
| Events in quadrant D | 11,001,389 | 359,000 |
| Mode M0 | |||
|---|---|---|---|
| Quadrant | BADHDUFLAG | Total packets | Discarded packets |
| A | 0 | 13573 | 2 |
| B | 0 | 24115 | 2 |
| C | 0 | 30030 | 2 |
| D | 0 | 37100 | 2 |
| Mode M9 | |||
|---|---|---|---|
| Quadrant | BADHDUFLAG | Total packets | Discarded packets |
| A | 0 | 18 | 0 |
| B | 0 | 19 | 0 |
| C | 0 | 19 | 0 |
| D | 0 | 19 | 0 |
| Mode SS | |||
|---|---|---|---|
| Quadrant | BADHDUFLAG | Total packets | Discarded packets |
| A | 0 | 128 | 0 |
| B | 0 | 128 | 0 |
| C | 0 | 128 | 0 |
| D | 0 | 128 | 0 |
| Quadrant | Total seconds | Saturated seconds | Saturation percentage |
|---|---|---|---|
| A | 6364 | 75 | 1.178504% |
| B | 6364 | 1314 | 20.647392% |
| C | 6364 | 1845 | 28.991201% |
| D | 6364 | 2655 | 41.719045% |
Noise dominated data is calculated using 1-second bins in cleaned event files. If a bin has >2000 counts, and if more than 50% of those come from <1% of pixels, then it is considered to be noise-dominated and hence unusable.
| Quadrant | # 1 sec bins | Bins with >0 counts | Bins with >2000 counts | High rate bins dominated by noise | Noise dominated (total time) | Noise dominated (detector-on time) | Marked lightcurve |
|---|---|---|---|---|---|---|---|
| A | 7510 | 6365 | 23 | 23 | 0.31% | 0.36% | 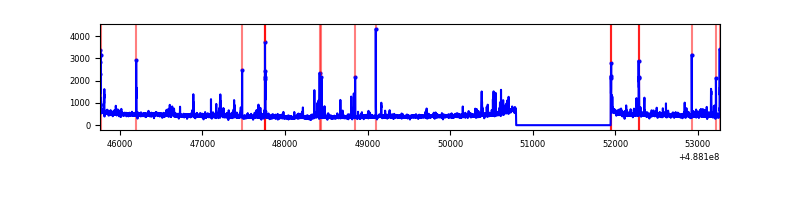 |
| B | 7510 | 6364 | 903 | 903 | 12.02% | 14.19% | 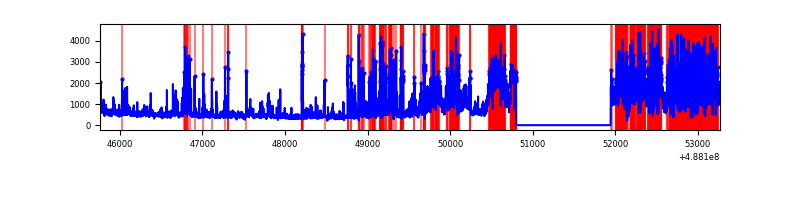 |
| C | 7510 | 6364 | 1573 | 1573 | 20.95% | 24.72% | 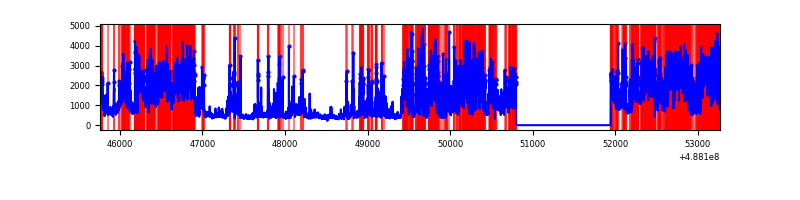 |
| D | 7510 | 6365 | 2370 | 2370 | 31.56% | 37.23% | 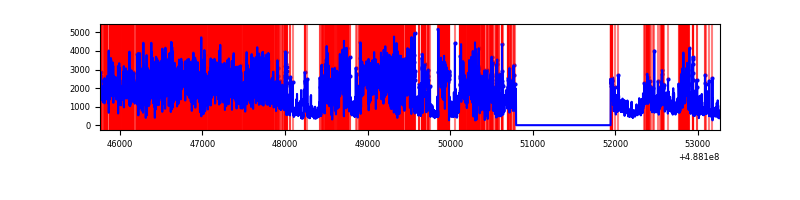 |
Top three noisy pixels from each quadrant. If the there are fewer than three noisy pixels in the level2.evt file, extra rows are filled as -1
| Pixel properties | Quadrant properties | ||||||
|---|---|---|---|---|---|---|---|
| Quadrant | DetID | PixID | Counts | Sigma | Mean | Median | Sigma |
| A | 8 | 246 | 83093 | 496.13 | 668 | 651 | 166.2 |
| A | 3 | 14 | 27937 | 164.2 | 668 | 651 | 166.2 |
| A | 3 | 46 | 25673 | 150.58 | 668 | 651 | 166.2 |
| B | 10 | 128 | 2764448 | 21623.36 | 608 | 587 | 127.8 |
| B | 10 | 254 | 596546 | 4662.55 | 608 | 587 | 127.8 |
| B | 8 | 234 | 333759 | 2606.61 | 608 | 587 | 127.8 |
| C | 15 | 248 | 5244104 | 32506.8 | 575 | 568 | 161.3 |
| C | 15 | 147 | 450954 | 2792.12 | 575 | 568 | 161.3 |
| C | 13 | 3 | 219081 | 1354.65 | 575 | 568 | 161.3 |
| D | 6 | 42 | 2513433 | 16124.71 | 537 | 511 | 155.8 |
| D | 12 | 33 | 1708229 | 10957.94 | 537 | 511 | 155.8 |
| D | 2 | 62 | 1668300 | 10701.73 | 537 | 511 | 155.8 |
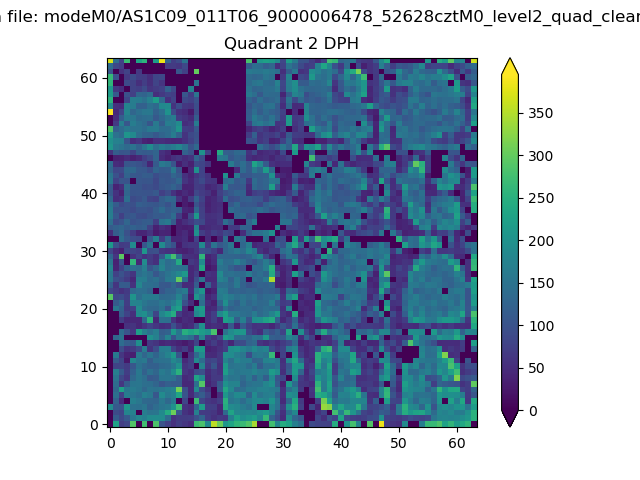
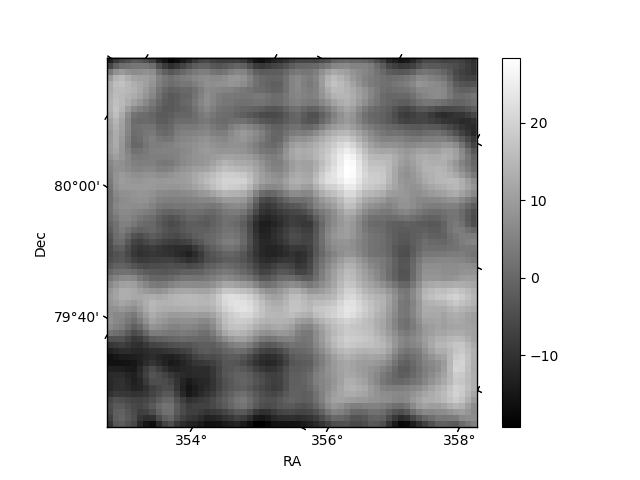
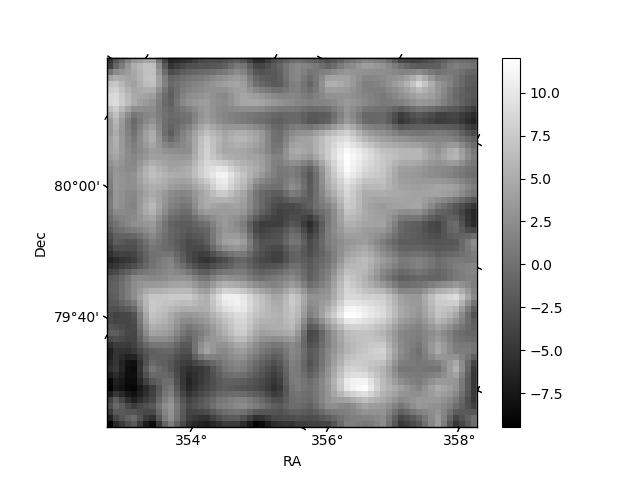
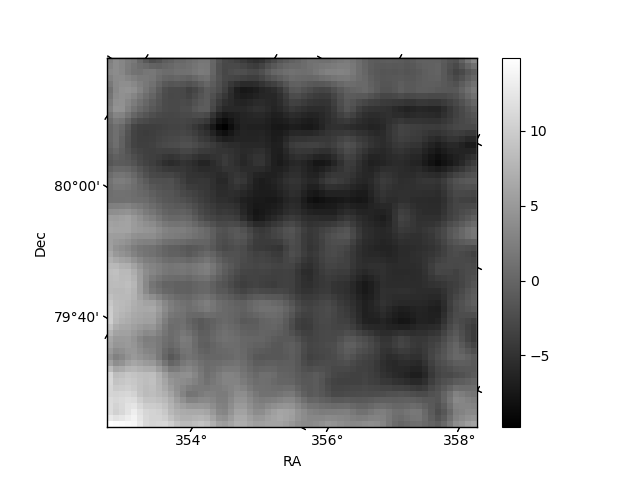
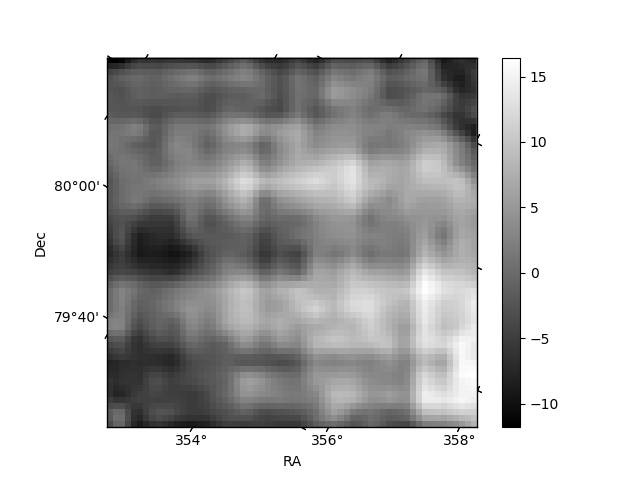
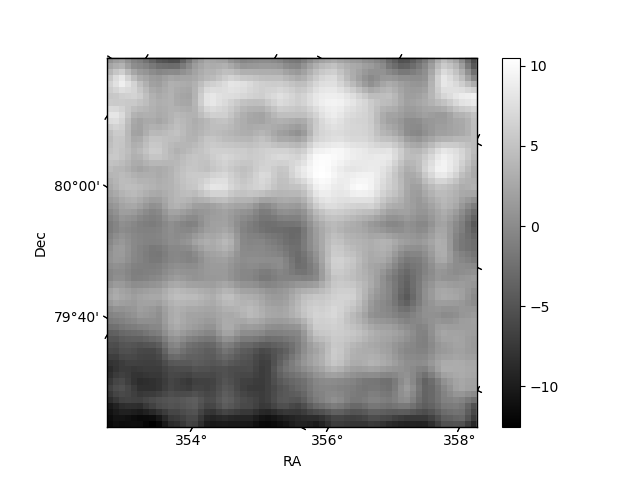
Histogram calculated using DETX and DETY for each event in the final _common_clean file
| Quadrant A | 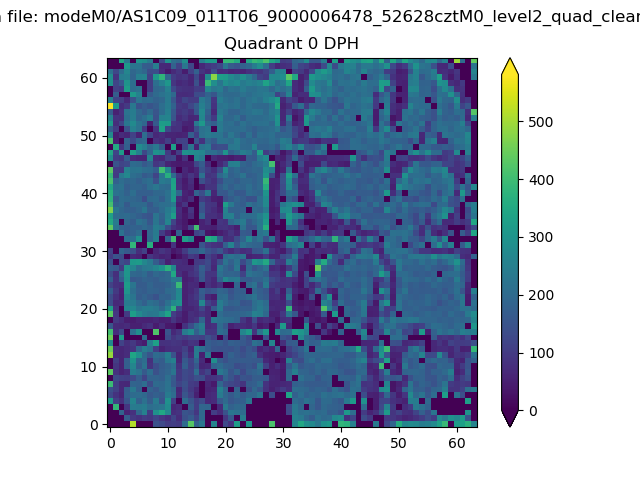 |
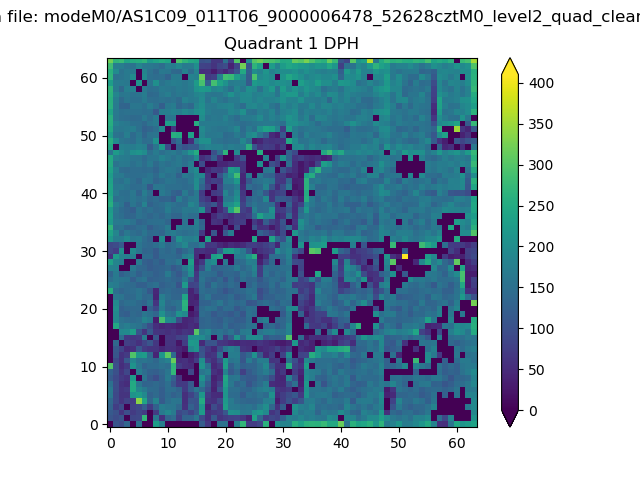 |
Quadrant B |
|---|---|---|---|
| Quadrant D | 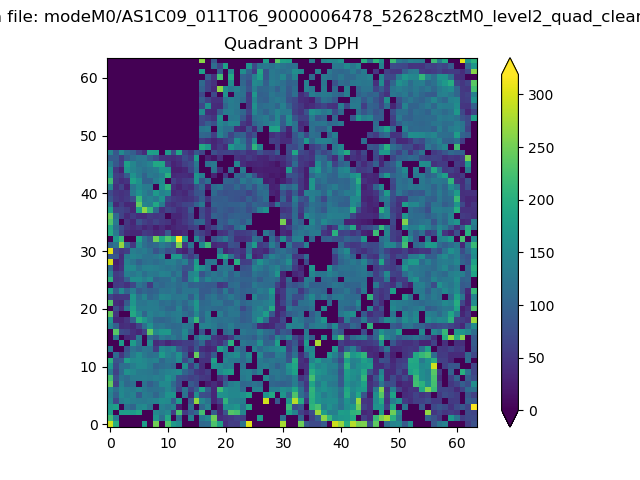 |
 |
Quadrant C |
| Plot type | Count rate plots | Images |
|---|---|---|
| Comparison with Poisson distribution Blue bars denote a histogram of data divided into 1 sec bins. Red curve is a Poisson curve with rate = median count rate of data. |
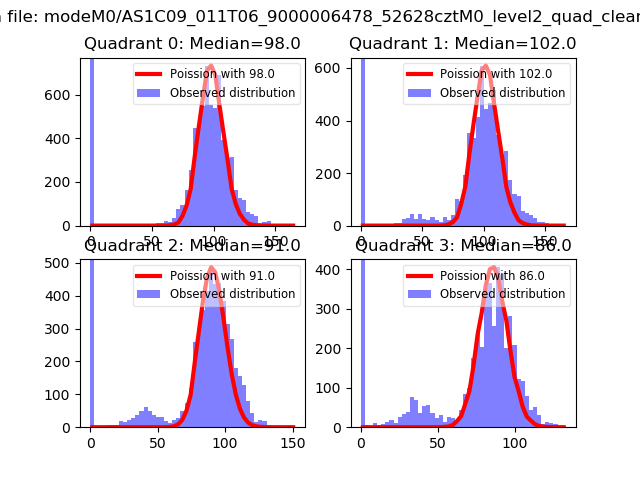 |
 |
| Quadrant-wise count rates Data is divided into 100 sec bins |
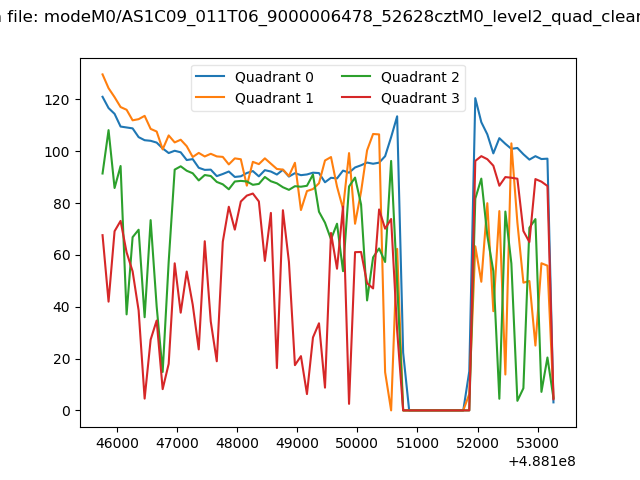 |
|
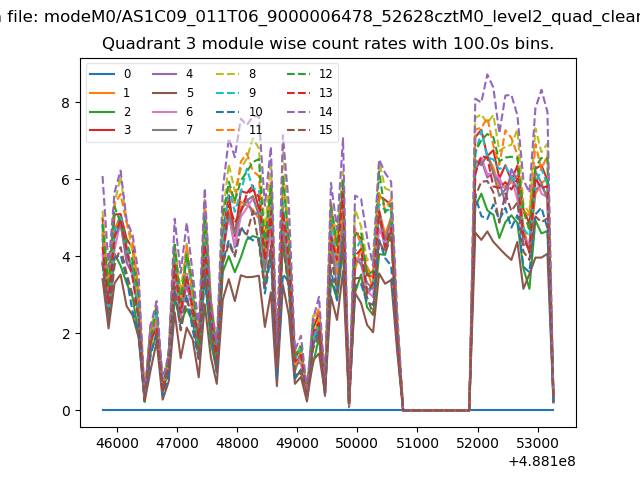
| Module-wise count rates for Quadrant A Data is divided into 100 sec bins |
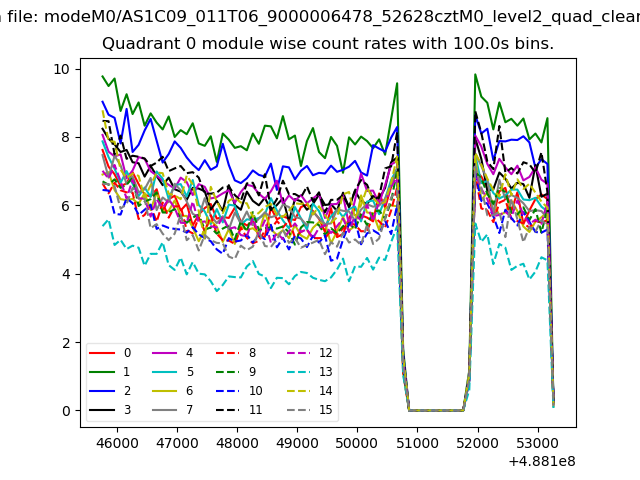 |
 |
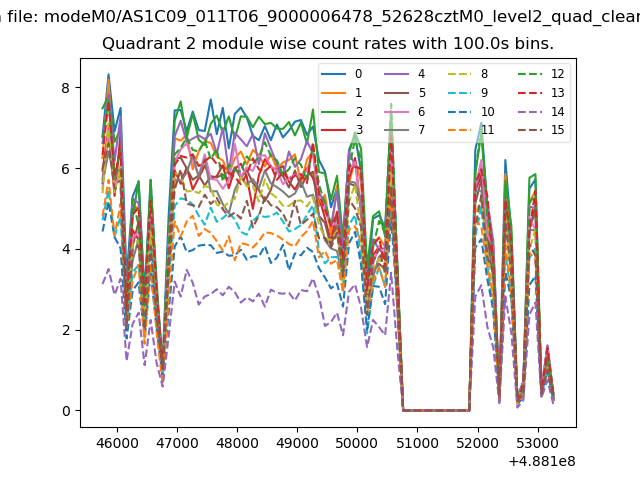
| Module-wise count rates for Quadrant B Data is divided into 100 sec bins |
 |
 |
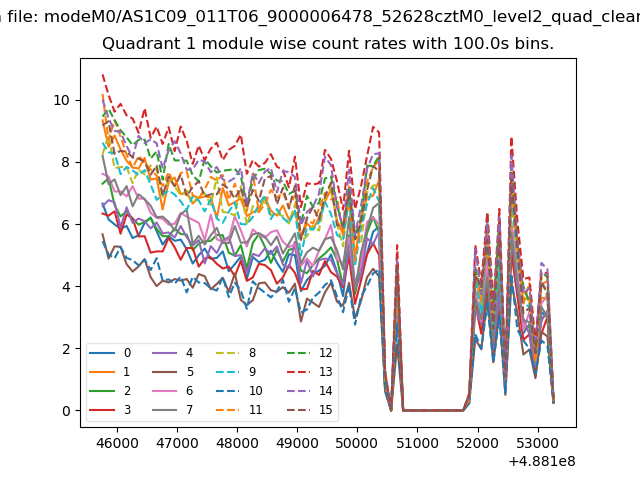
| Module-wise count rates for Quadrant C Data is divided into 100 sec bins |
 |
 |
| Module-wise count rates for Quadrant D Data is divided into 100 sec bins |
 |
 |
| Parameter | Plot |
|---|---|
| CZT HV Monitor | 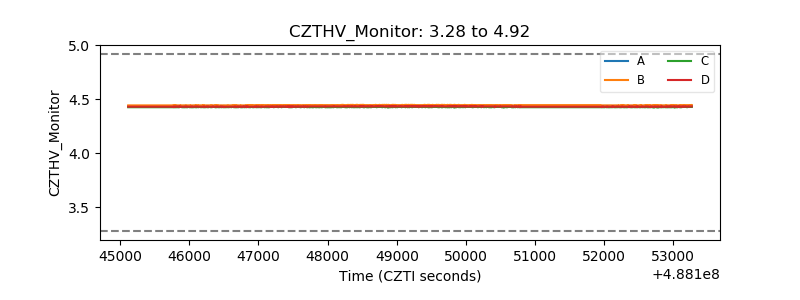 |
| D_VDD | 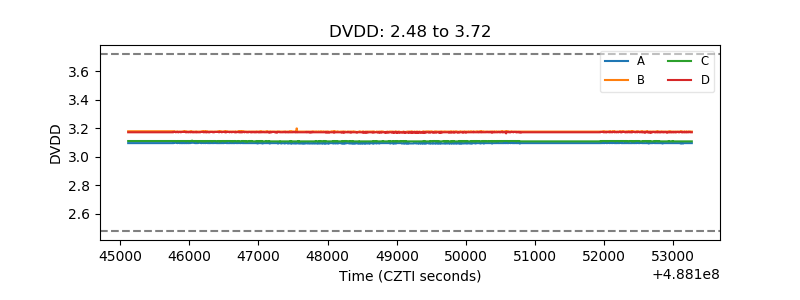 |
| Temperature 1 | 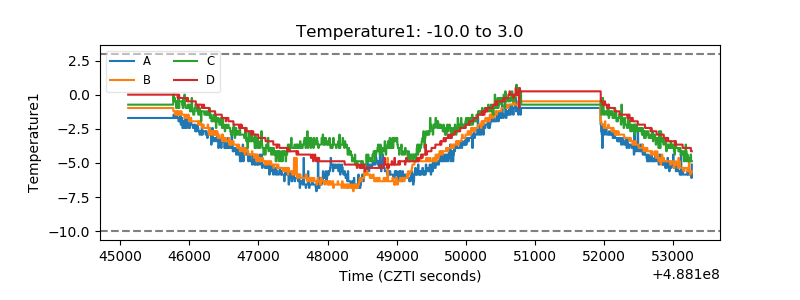 |
| Veto HV Monitor | 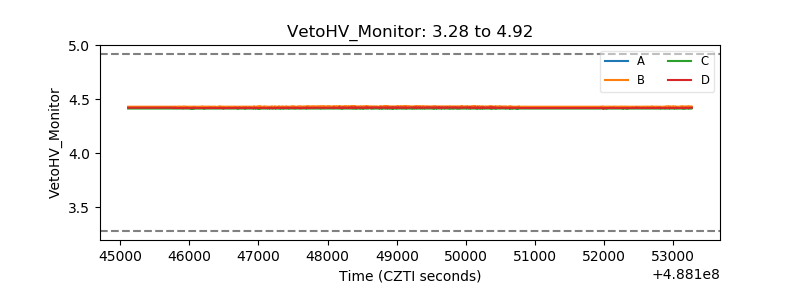 |
| Veto LLD | 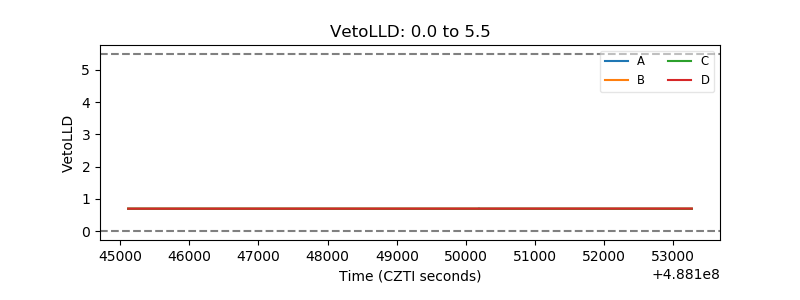 |
| Alpha Counter | 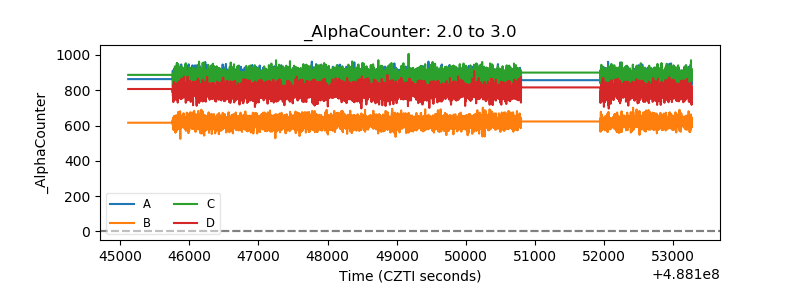 |
| _CPM_Rate | 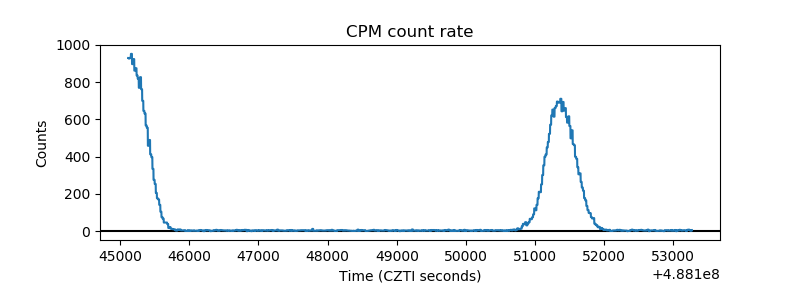 |
| CZT Counter | 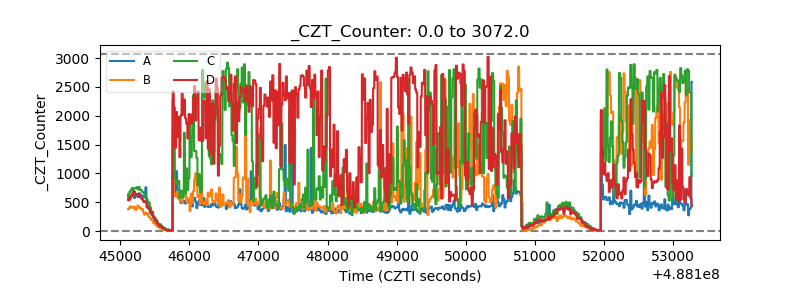 |
| +2.5 Volts monitor | 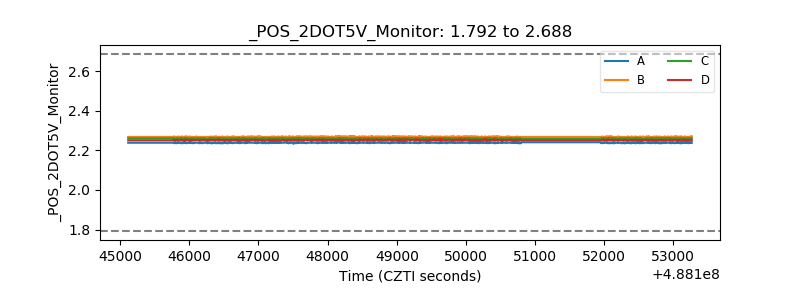 |
| +5 Volts monitor |  |
| _ROLL_ROT | 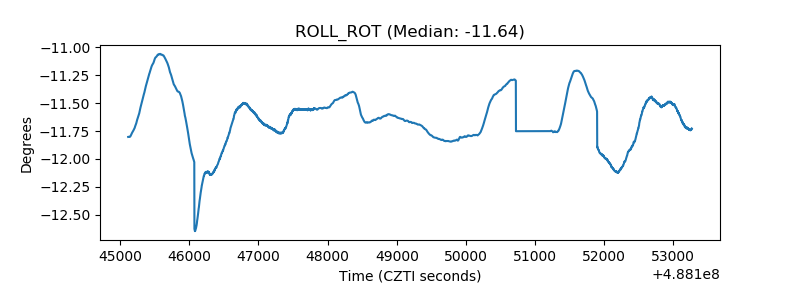 |
| _Roll_DEC | 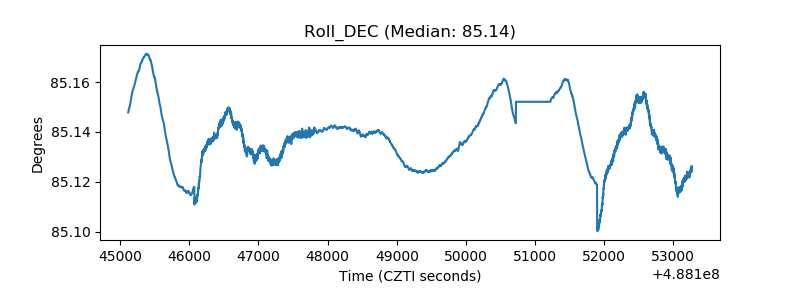 |
| _Roll_RA | 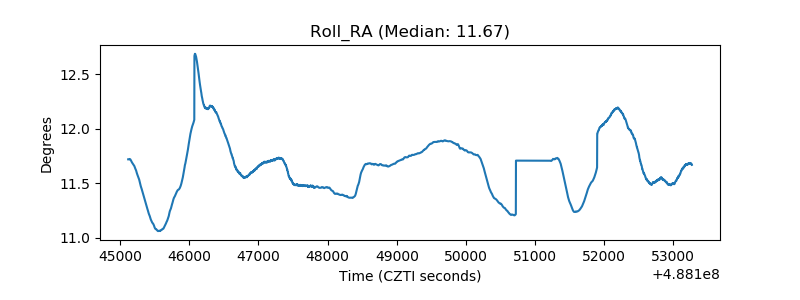 |
| Veto Counter | 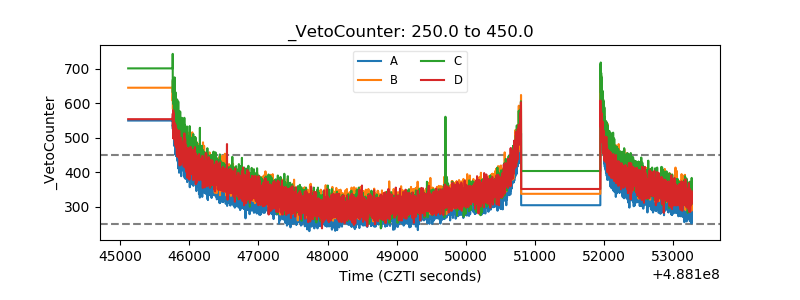 |