| Param | Original file | Final file |
|---|---|---|
| Filename | modeM0/AS1C09_011T06_9000006478_52630cztM0_level2.fits | modeM0/AS1C09_011T06_9000006478_52630cztM0_level2_quad_clean.evt |
| Size (bytes) | 609,500,160 | 55,180,800 |
| Size | 581.3 MB | 52.6 MB |
| Events in quadrant A | 2,217,647 | 437,665 |
| Events in quadrant B | 3,657,218 | 446,081 |
| Events in quadrant C | 9,577,592 | 194,274 |
| Events in quadrant D | 6,736,084 | 255,380 |
| Mode M0 | |||
|---|---|---|---|
| Quadrant | BADHDUFLAG | Total packets | Discarded packets |
| A | 0 | 10479 | 110 |
| B | 0 | 14460 | 111 |
| C | 0 | 32171 | 429 |
| D | 0 | 23520 | 112 |
| Mode SS | |||
|---|---|---|---|
| Quadrant | BADHDUFLAG | Total packets | Discarded packets |
| A | 0 | 100 | 4 |
| B | 0 | 100 | 4 |
| C | 0 | 100 | 4 |
| D | 0 | 101 | 5 |
| Quadrant | Total seconds | Saturated seconds | Saturation percentage |
|---|---|---|---|
| A | 4806 | 17 | 0.353725% |
| B | 4807 | 325 | 6.760974% |
| C | 4801 | 2797 | 58.258696% |
| D | 4802 | 1906 | 39.691795% |
Noise dominated data is calculated using 1-second bins in cleaned event files. If a bin has >2000 counts, and if more than 50% of those come from <1% of pixels, then it is considered to be noise-dominated and hence unusable.
| Quadrant | # 1 sec bins | Bins with >0 counts | Bins with >2000 counts | High rate bins dominated by noise | Noise dominated (total time) | Noise dominated (detector-on time) | Marked lightcurve |
|---|---|---|---|---|---|---|---|
| A | 7943 | 4809 | 14 | 14 | 0.18% | 0.29% | 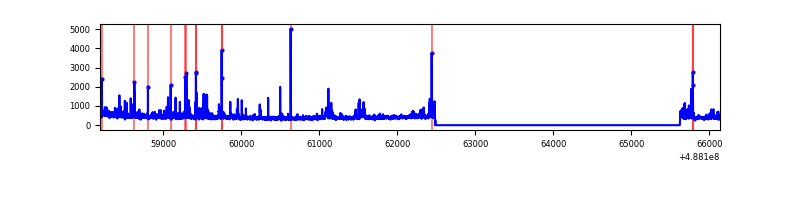 |
| B | 7943 | 4810 | 241 | 241 | 3.03% | 5.01% | 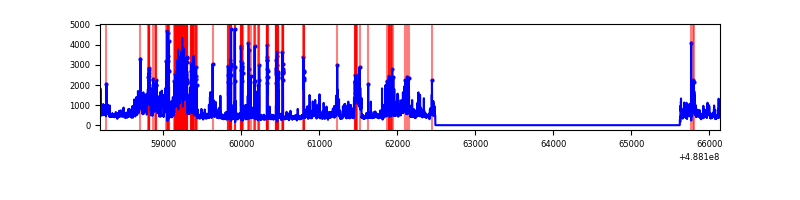 |
| C | 7943 | 4801 | 2628 | 2628 | 33.09% | 54.74% | 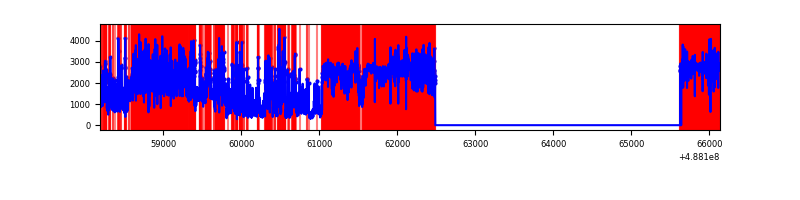 |
| D | 7944 | 4807 | 1558 | 1558 | 19.61% | 32.41% | 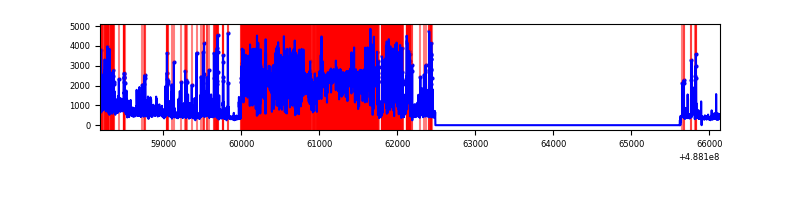 |
Top three noisy pixels from each quadrant. If the there are fewer than three noisy pixels in the level2.evt file, extra rows are filled as -1
| Pixel properties | Quadrant properties | ||||||
|---|---|---|---|---|---|---|---|
| Quadrant | DetID | PixID | Counts | Sigma | Mean | Median | Sigma |
| A | 8 | 246 | 74507 | 644.4 | 459 | 450 | 114.9 |
| A | 12 | 17 | 42504 | 365.93 | 459 | 450 | 114.9 |
| A | 15 | 174 | 34312 | 294.65 | 459 | 450 | 114.9 |
| B | 10 | 254 | 642482 | 6710.69 | 448 | 431 | 95.7 |
| B | 5 | 185 | 446625 | 4663.6 | 448 | 431 | 95.7 |
| B | 10 | 128 | 369156 | 3853.9 | 448 | 431 | 95.7 |
| C | 15 | 248 | 6208987 | 76090.81 | 286 | 283 | 81.6 |
| C | 15 | 147 | 1094750 | 13413.25 | 286 | 283 | 81.6 |
| C | 13 | 3 | 953274 | 11679.39 | 286 | 283 | 81.6 |
| D | 12 | 16 | 4133392 | 42674.39 | 329 | 314 | 96.9 |
| D | 1 | 7 | 468653 | 4835.64 | 329 | 314 | 96.9 |
| D | 2 | 153 | 152397 | 1570.27 | 329 | 314 | 96.9 |
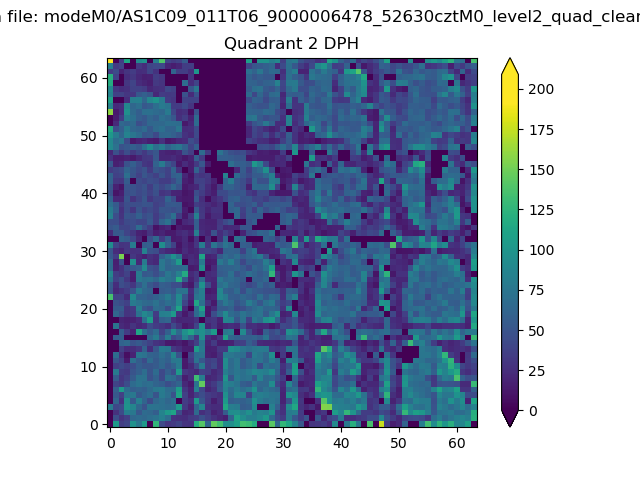
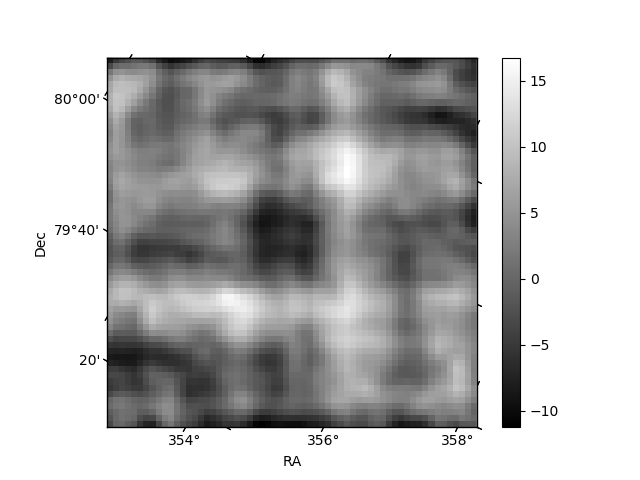
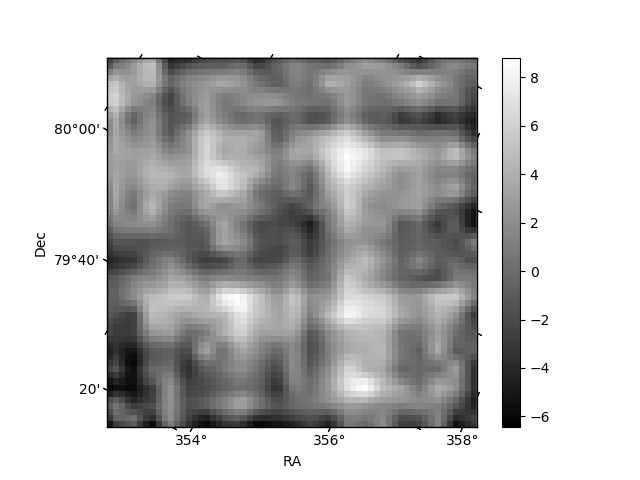
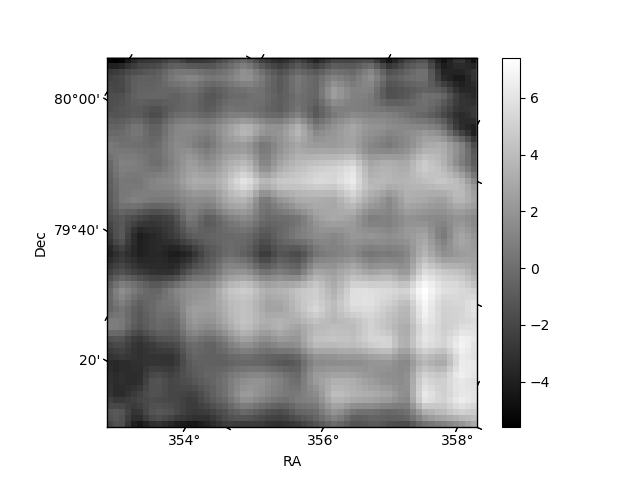
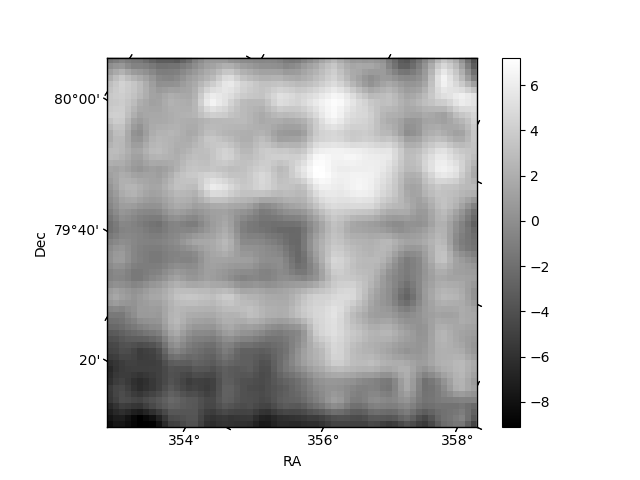
Histogram calculated using DETX and DETY for each event in the final _common_clean file
| Quadrant A | 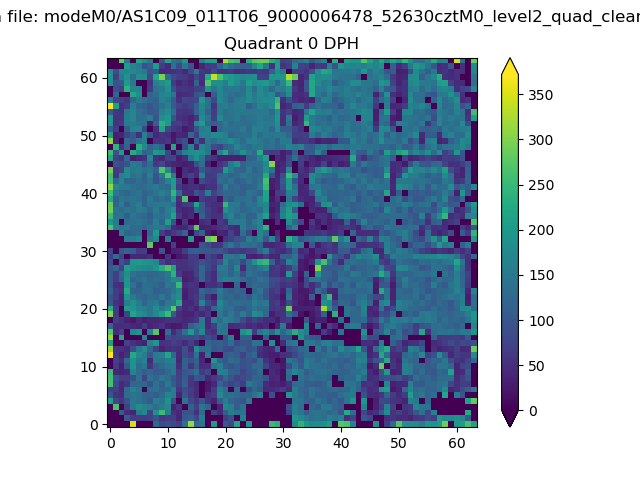 |
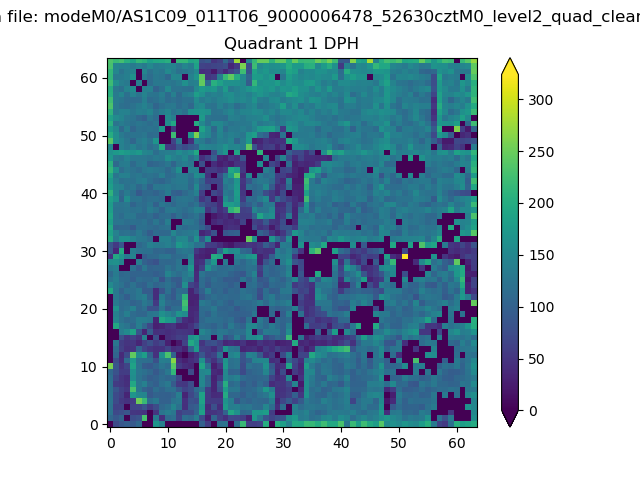 |
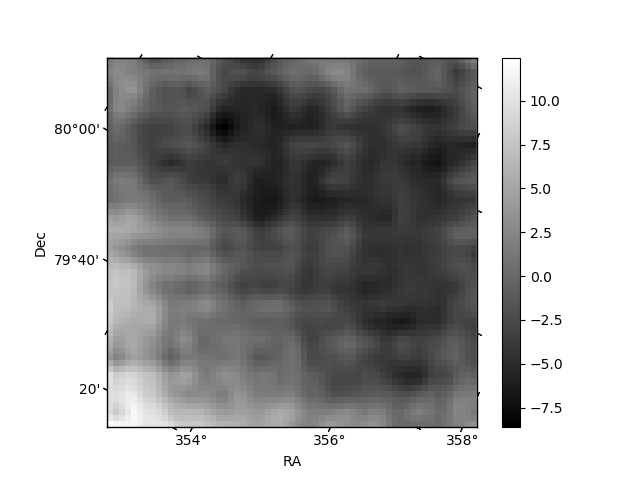
Quadrant B |
|---|---|---|---|
| Quadrant D | 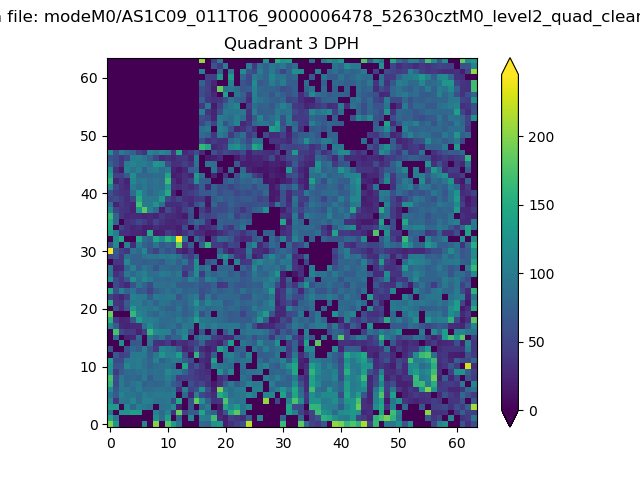 |
 |
Quadrant C |
| Plot type | Count rate plots | Images |
|---|---|---|
| Comparison with Poisson distribution Blue bars denote a histogram of data divided into 1 sec bins. Red curve is a Poisson curve with rate = median count rate of data. |
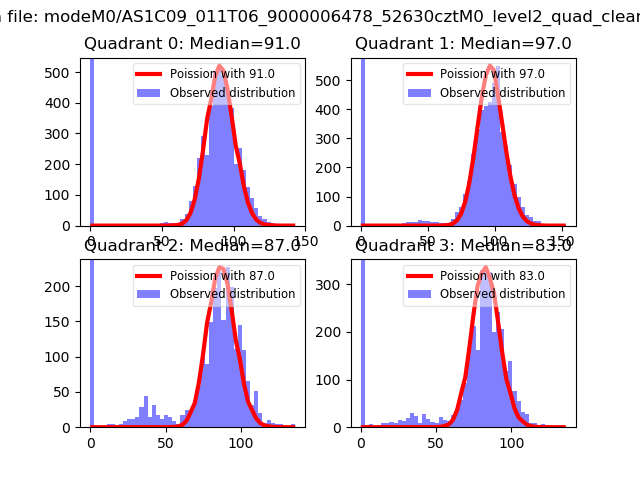 |
 |
| Quadrant-wise count rates Data is divided into 100 sec bins |
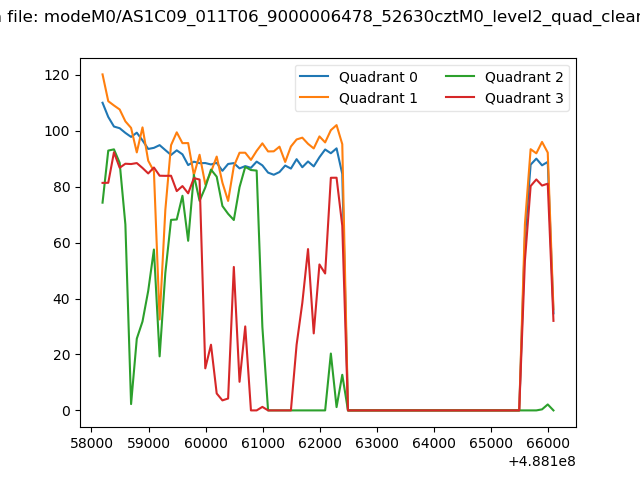 |
|
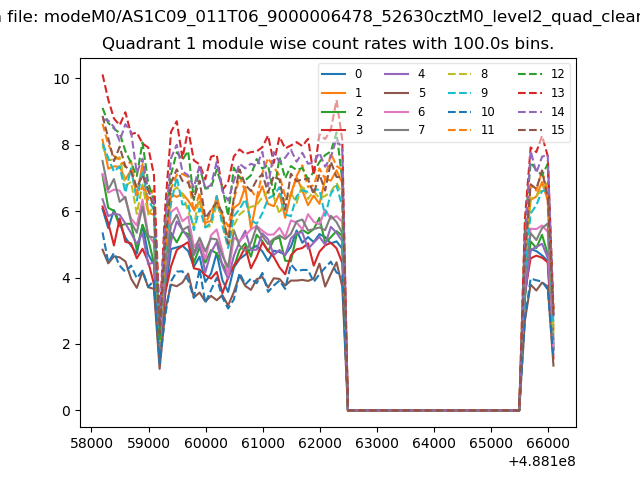
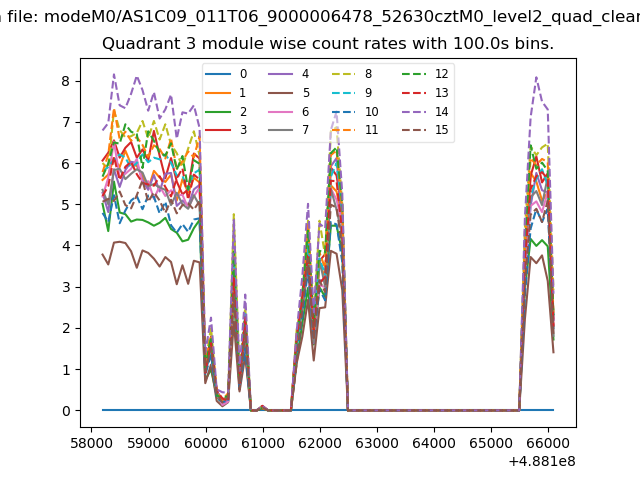
| Module-wise count rates for Quadrant A Data is divided into 100 sec bins |
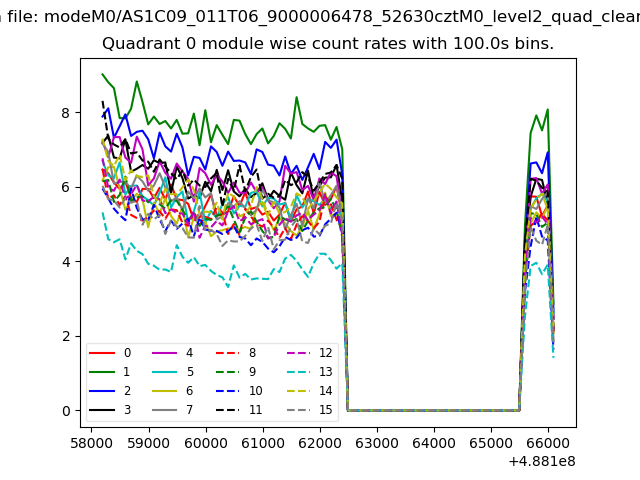 |
 |
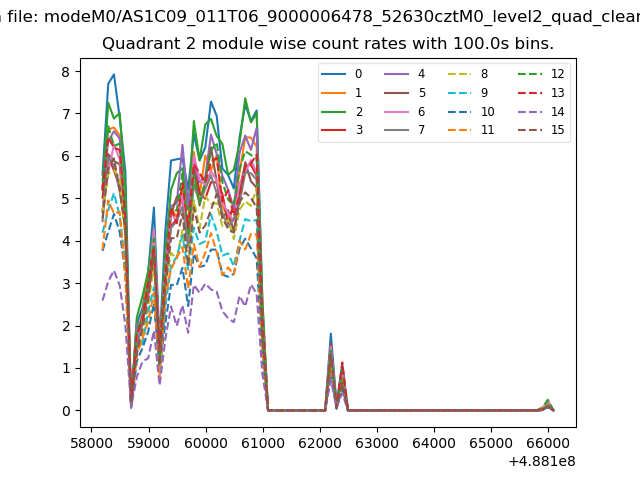
| Module-wise count rates for Quadrant B Data is divided into 100 sec bins |
 |
 |
| Module-wise count rates for Quadrant C Data is divided into 100 sec bins |
 |
 |
| Module-wise count rates for Quadrant D Data is divided into 100 sec bins |
 |
 |
| Parameter | Plot |
|---|---|
| CZT HV Monitor | 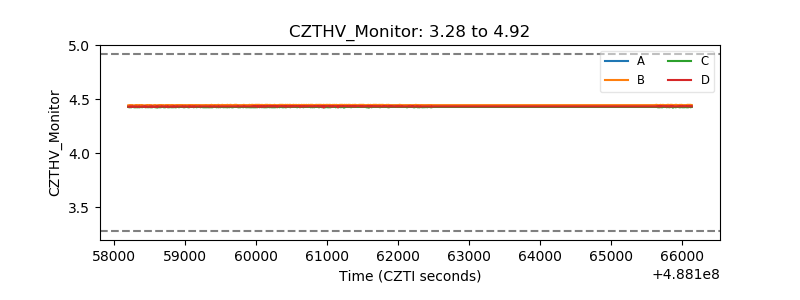 |
| D_VDD | 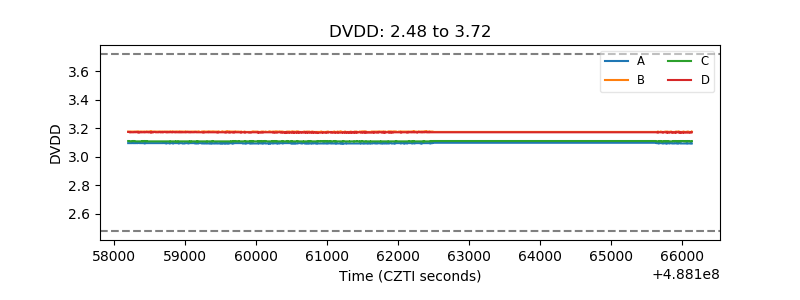 |
| Temperature 1 | 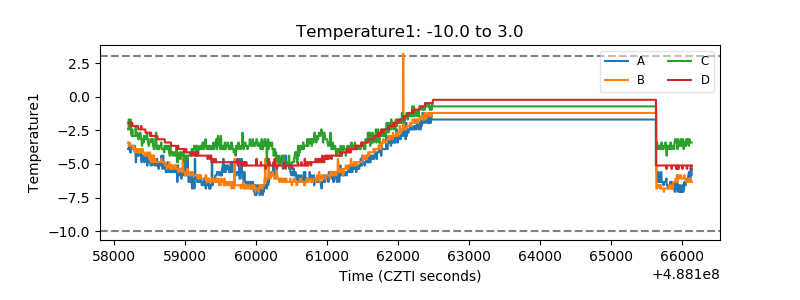 |
| Veto HV Monitor | 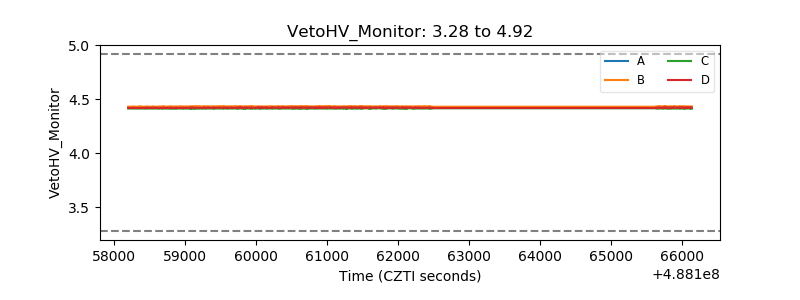 |
| Veto LLD | 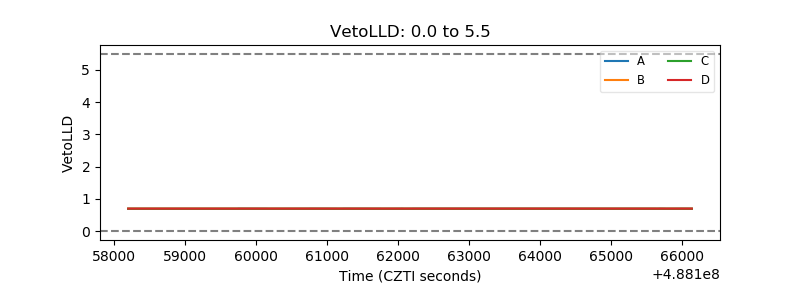 |
| Alpha Counter | 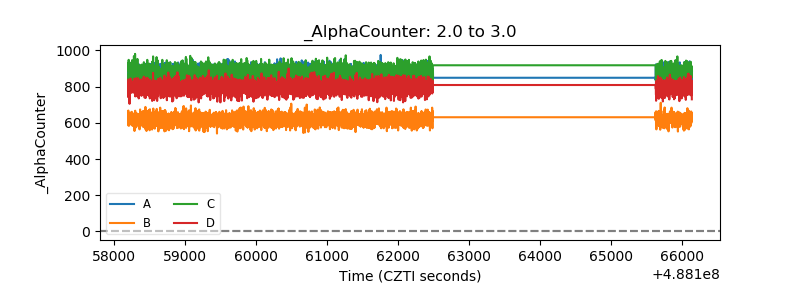 |
| _CPM_Rate | 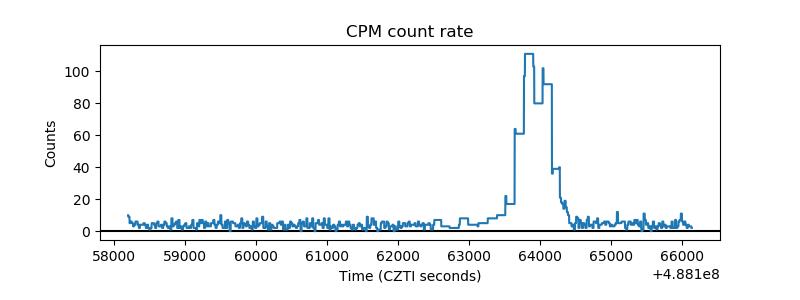 |
| CZT Counter | 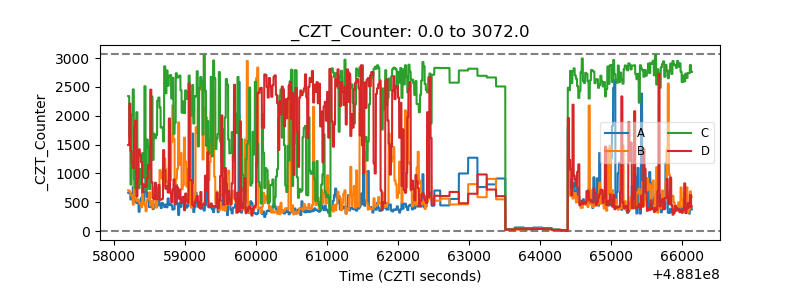 |
| +2.5 Volts monitor | 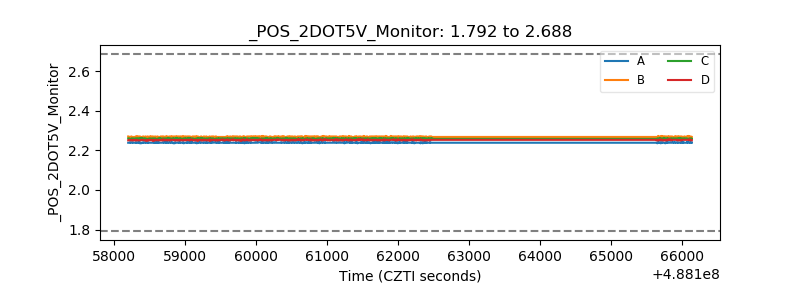 |
| +5 Volts monitor | 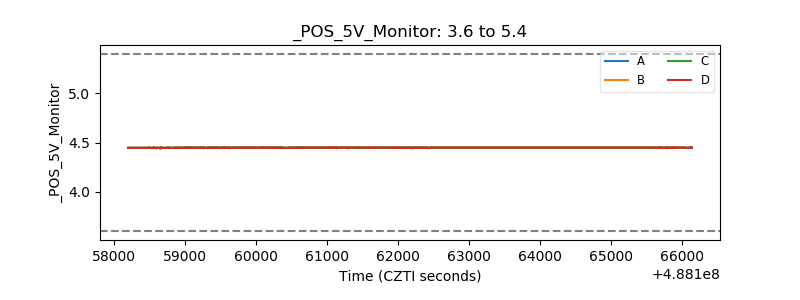 |
| _ROLL_ROT | 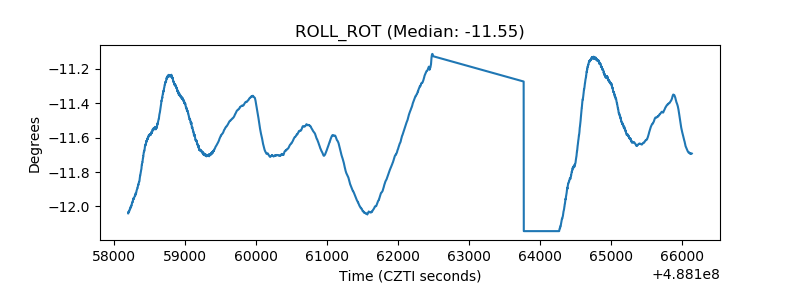 |
| _Roll_DEC | 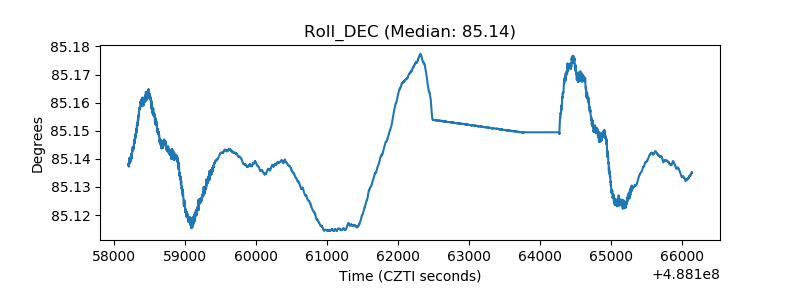 |
| _Roll_RA | 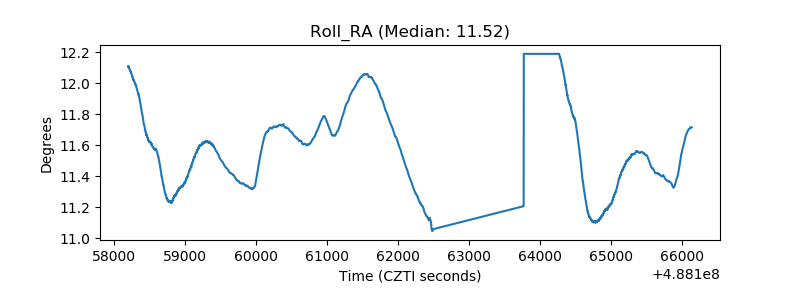 |
| Veto Counter | 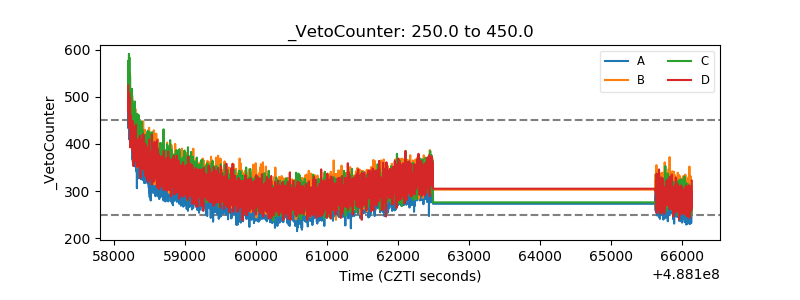 |