| Param | Original file | Final file |
|---|---|---|
| Filename | modeM0/AS1C09_011T06_9000006478_52632cztM0_level2.fits | modeM0/AS1C09_011T06_9000006478_52632cztM0_level2_quad_clean.evt |
| Size (bytes) | 877,141,440 | 86,031,360 |
| Size | 836.5 MB | 82.0 MB |
| Events in quadrant A | 3,666,617 | 644,720 |
| Events in quadrant B | 4,541,817 | 687,085 |
| Events in quadrant C | 14,098,708 | 326,152 |
| Events in quadrant D | 9,614,596 | 453,330 |
| Mode M0 | |||
|---|---|---|---|
| Quadrant | BADHDUFLAG | Total packets | Discarded packets |
| A | 0 | 16199 | 0 |
| B | 0 | 18643 | 0 |
| C | 0 | 46697 | 0 |
| D | 0 | 33575 | 2 |
| Mode SS | |||
|---|---|---|---|
| Quadrant | BADHDUFLAG | Total packets | Discarded packets |
| A | 0 | 142 | 0 |
| B | 0 | 142 | 0 |
| C | 0 | 142 | 0 |
| D | 0 | 142 | 0 |
| Quadrant | Total seconds | Saturated seconds | Saturation percentage |
|---|---|---|---|
| A | 7081 | 102 | 1.440475% |
| B | 7081 | 166 | 2.344302% |
| C | 7081 | 3787 | 53.481147% |
| D | 7080 | 1781 | 25.155367% |
Noise dominated data is calculated using 1-second bins in cleaned event files. If a bin has >2000 counts, and if more than 50% of those come from <1% of pixels, then it is considered to be noise-dominated and hence unusable.
| Quadrant | # 1 sec bins | Bins with >0 counts | Bins with >2000 counts | High rate bins dominated by noise | Noise dominated (total time) | Noise dominated (detector-on time) | Marked lightcurve |
|---|---|---|---|---|---|---|---|
| A | 7081 | 7081 | 74 | 74 | 1.05% | 1.05% | 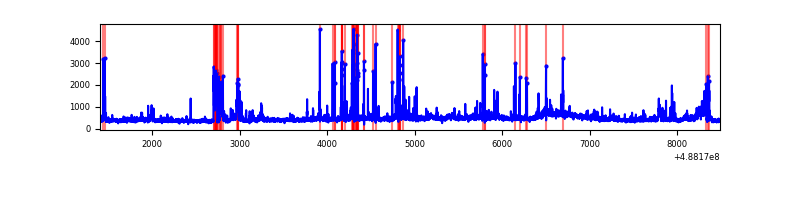 |
| B | 7081 | 7081 | 90 | 90 | 1.27% | 1.27% | 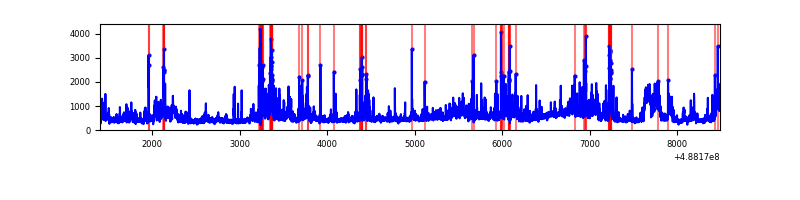 |
| C | 7081 | 7081 | 3614 | 3614 | 51.04% | 51.04% | 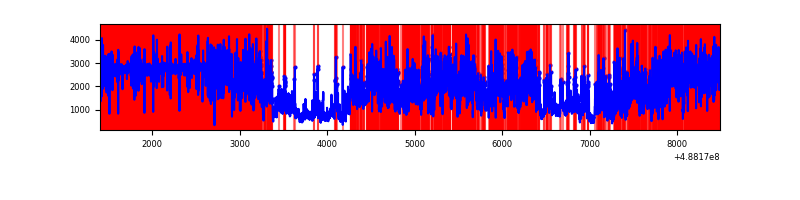 |
| D | 7079 | 7079 | 1732 | 1732 | 24.47% | 24.47% | 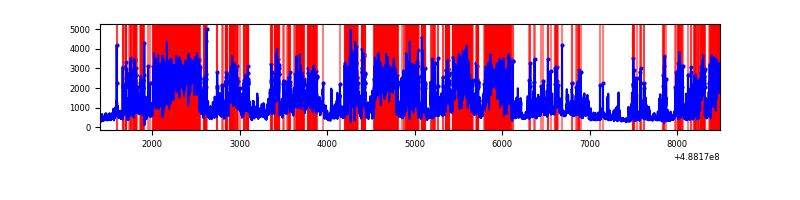 |
Top three noisy pixels from each quadrant. If the there are fewer than three noisy pixels in the level2.evt file, extra rows are filled as -1
| Pixel properties | Quadrant properties | ||||||
|---|---|---|---|---|---|---|---|
| Quadrant | DetID | PixID | Counts | Sigma | Mean | Median | Sigma |
| A | 4 | 249 | 368245 | 2060.47 | 716 | 697 | 178.4 |
| A | 15 | 174 | 135927 | 758.1 | 716 | 697 | 178.4 |
| A | 3 | 46 | 52743 | 291.77 | 716 | 697 | 178.4 |
| B | 10 | 254 | 650308 | 4269.07 | 711 | 688 | 152.2 |
| B | 8 | 234 | 266097 | 1744.17 | 711 | 688 | 152.2 |
| B | 4 | 81 | 224120 | 1468.31 | 711 | 688 | 152.2 |
| C | 15 | 248 | 11126022 | 76352.24 | 530 | 525 | 145.7 |
| C | 15 | 147 | 329439 | 2257.28 | 530 | 525 | 145.7 |
| C | 13 | 3 | 230324 | 1577.07 | 530 | 525 | 145.7 |
| D | 6 | 42 | 3948994 | 21956.03 | 622 | 591 | 179.8 |
| D | 8 | 176 | 1157638 | 6434.03 | 622 | 591 | 179.8 |
| D | 12 | 17 | 768324 | 4269.16 | 622 | 591 | 179.8 |
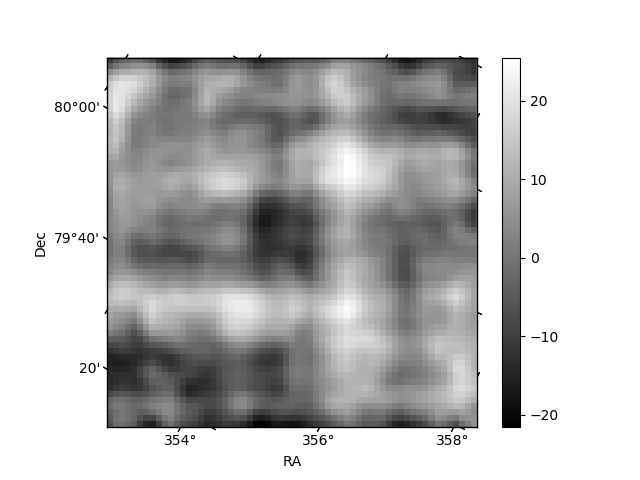
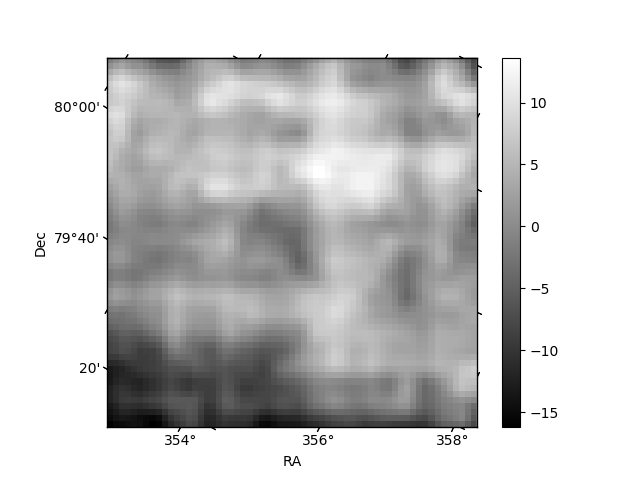
Histogram calculated using DETX and DETY for each event in the final _common_clean file
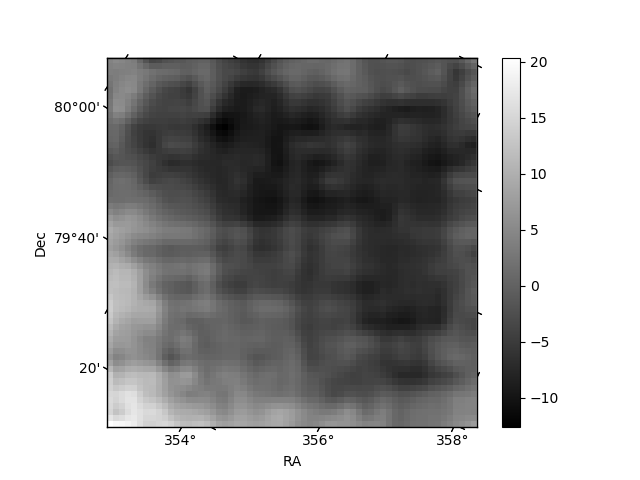
| Quadrant A | 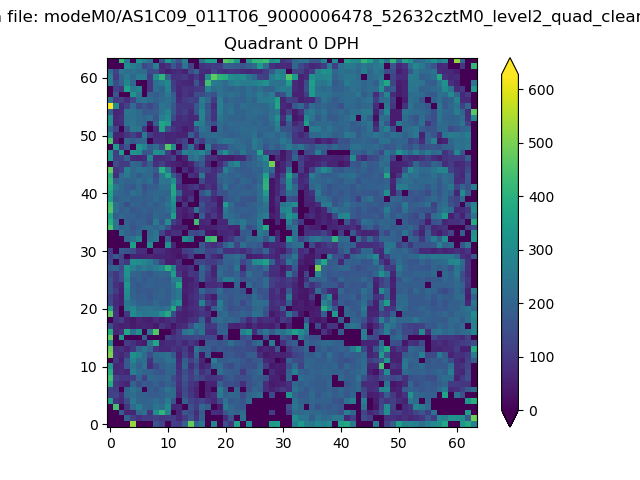 |
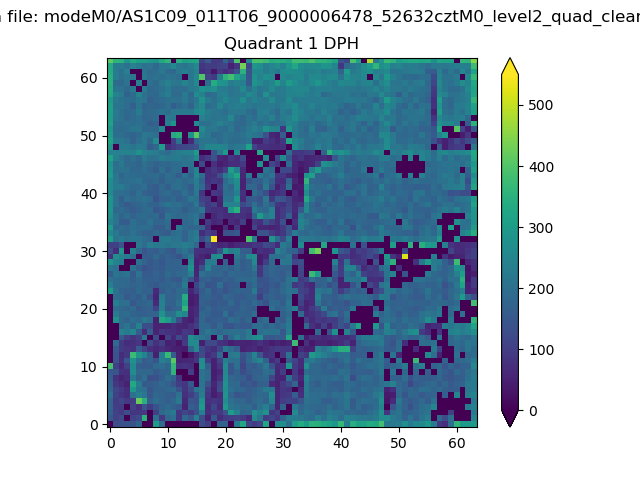 |
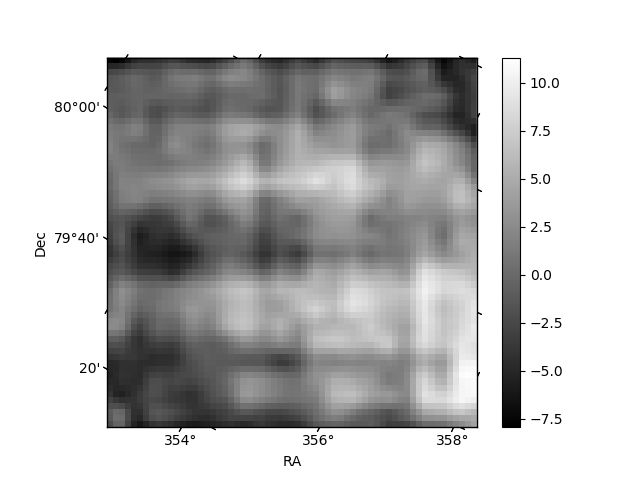
Quadrant B |
|---|---|---|---|
| Quadrant D | 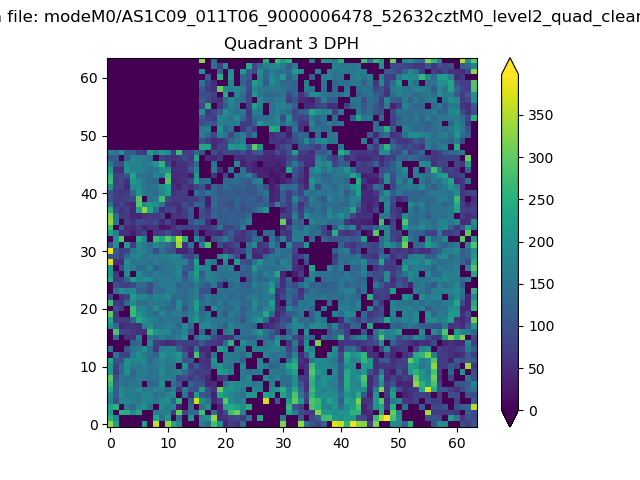 |
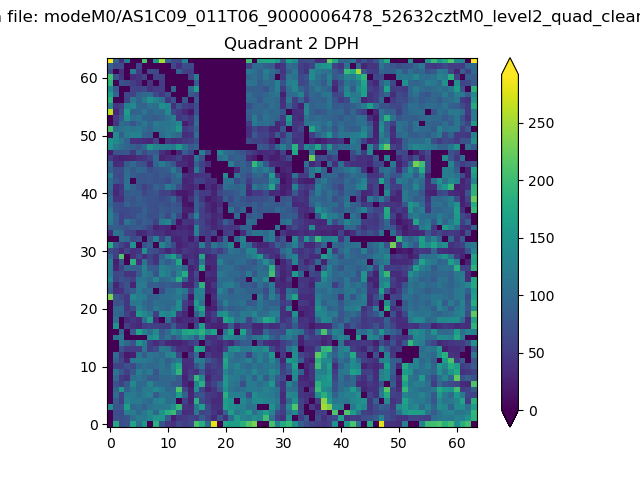 |
Quadrant C |
| Plot type | Count rate plots | Images |
|---|---|---|
| Comparison with Poisson distribution Blue bars denote a histogram of data divided into 1 sec bins. Red curve is a Poisson curve with rate = median count rate of data. |
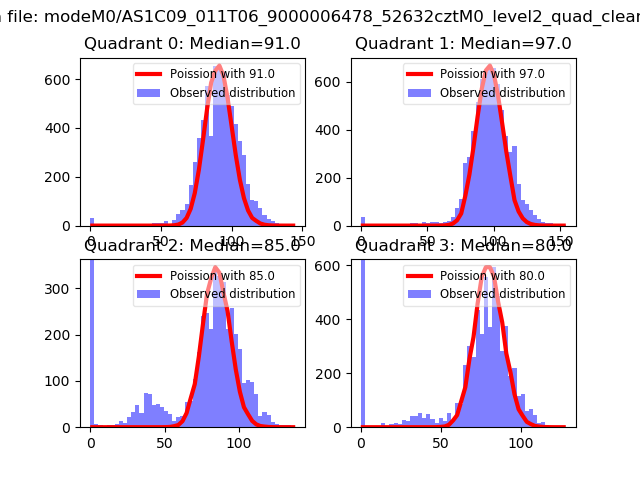 |
 |
| Quadrant-wise count rates Data is divided into 100 sec bins |
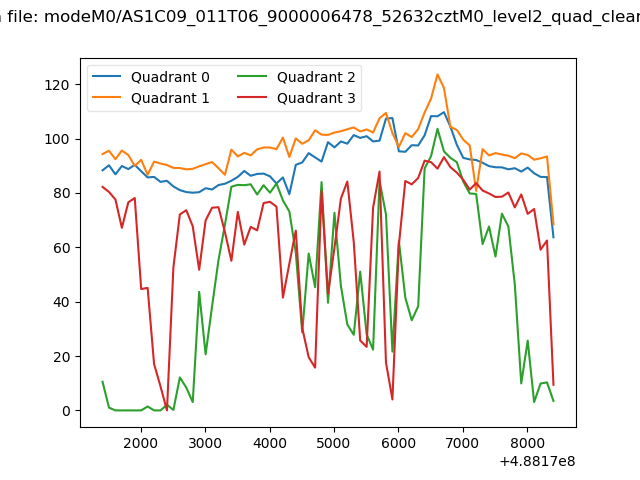 |
|
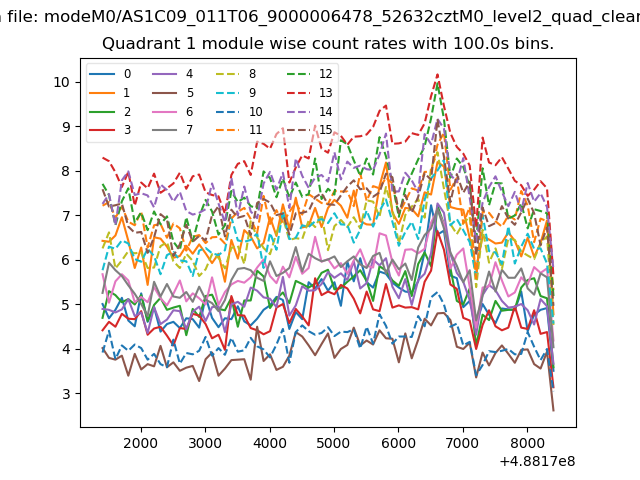
| Module-wise count rates for Quadrant A Data is divided into 100 sec bins |
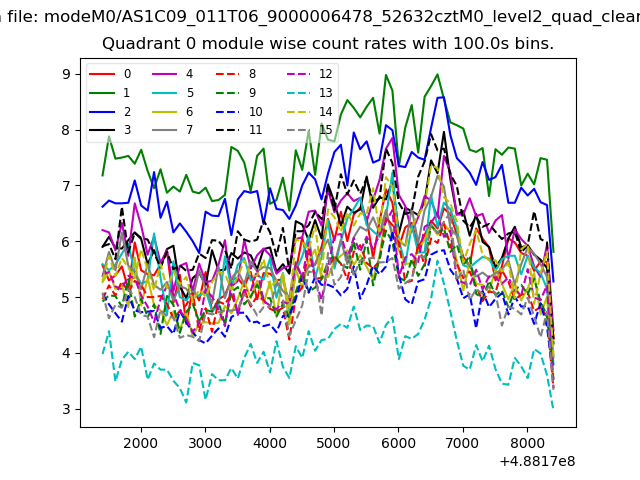 |
 |
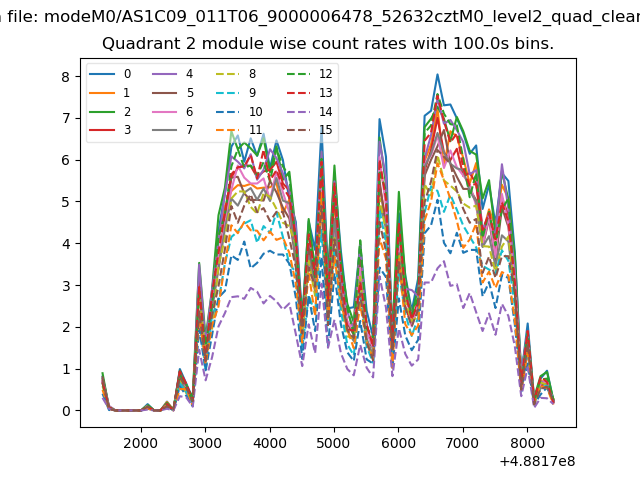
| Module-wise count rates for Quadrant B Data is divided into 100 sec bins |
 |
 |
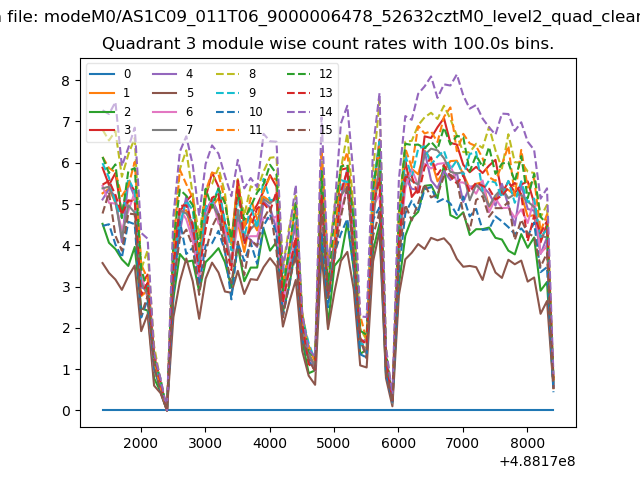
| Module-wise count rates for Quadrant C Data is divided into 100 sec bins |
 |
 |
| Module-wise count rates for Quadrant D Data is divided into 100 sec bins |
 |
 |
| Parameter | Plot |
|---|---|
| CZT HV Monitor | 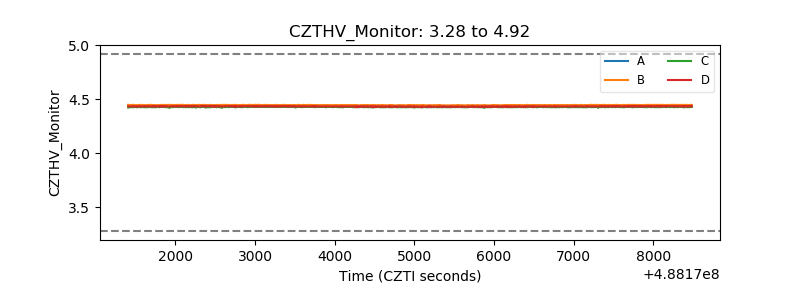 |
| D_VDD | 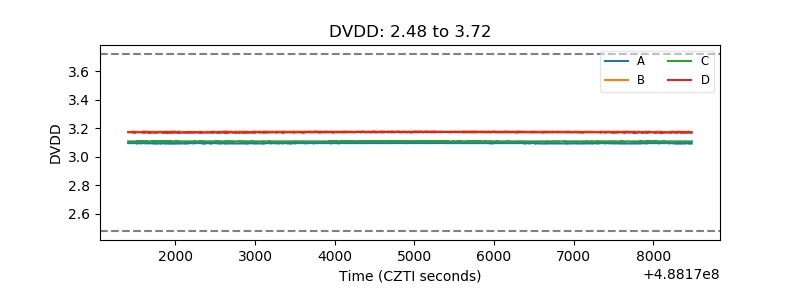 |
| Temperature 1 | 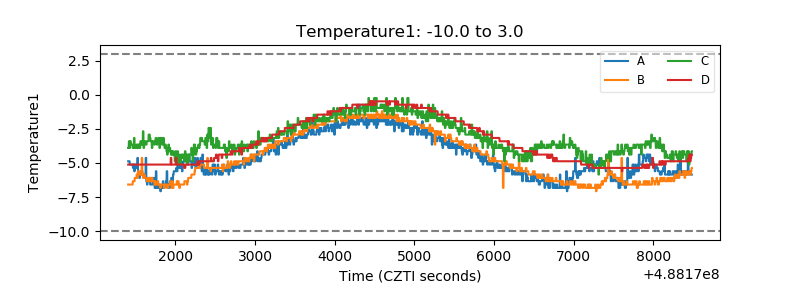 |
| Veto HV Monitor |  |
| Veto LLD | 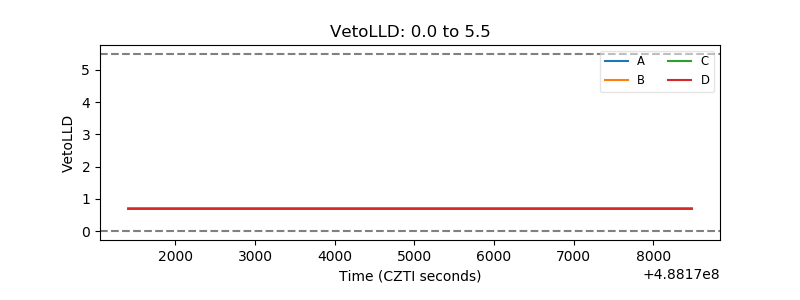 |
| Alpha Counter | 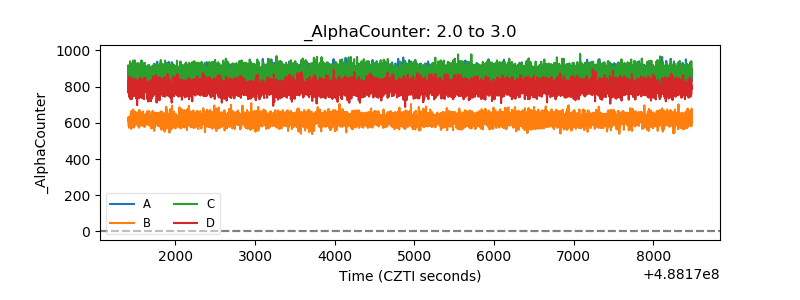 |
| _CPM_Rate | 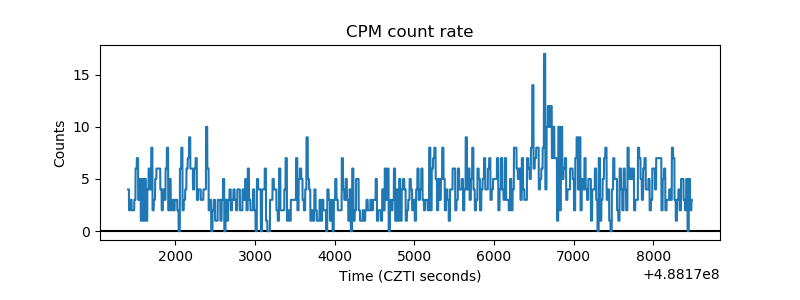 |
| CZT Counter | 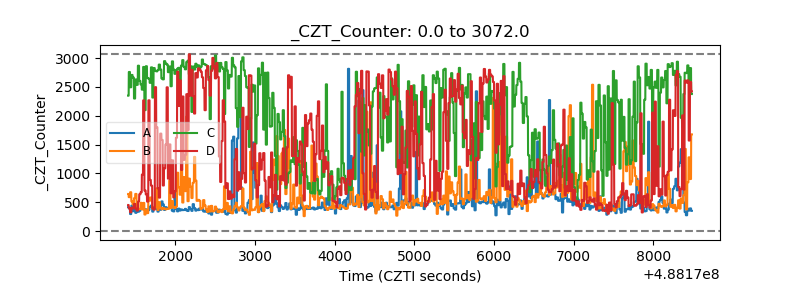 |
| +2.5 Volts monitor | 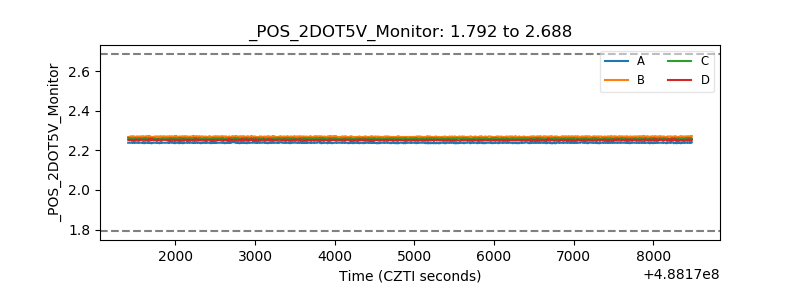 |
| +5 Volts monitor |  |
| _ROLL_ROT | 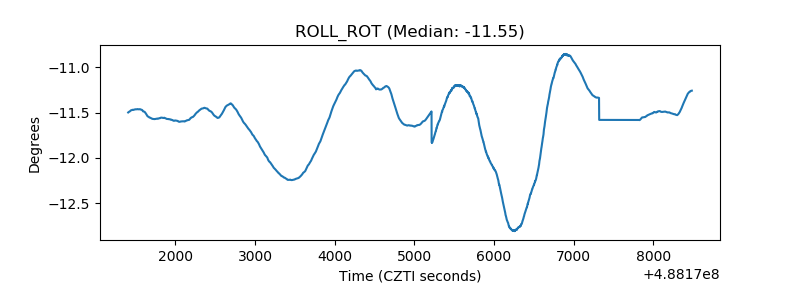 |
| _Roll_DEC |  |
| _Roll_RA | 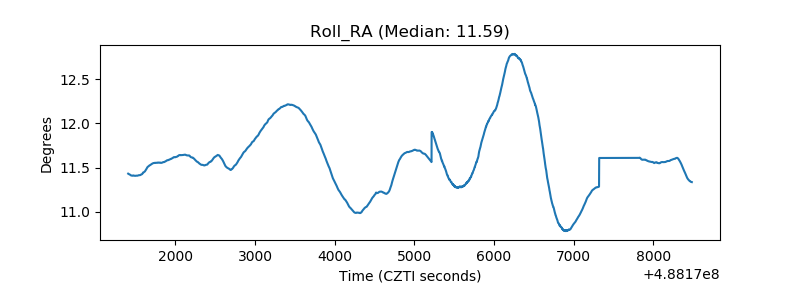 |
| Veto Counter | 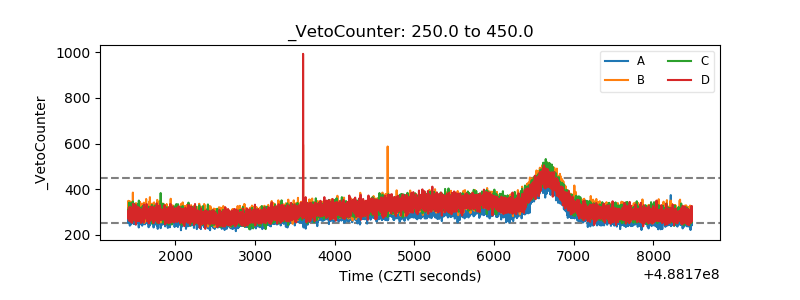 |