| Param | Original file | Final file |
|---|---|---|
| Filename | modeM0/AS1C09_011T06_9000006478_52640cztM0_level2.fits | modeM0/AS1C09_011T06_9000006478_52640cztM0_level2_quad_clean.evt |
| Size (bytes) | 641,024,640 | 83,424,960 |
| Size | 611.3 MB | 79.6 MB |
| Events in quadrant A | 3,792,680 | 578,035 |
| Events in quadrant B | 5,512,512 | 581,711 |
| Events in quadrant C | 6,450,194 | 508,377 |
| Events in quadrant D | 7,498,043 | 428,982 |
| Mode M0 | |||
|---|---|---|---|
| Quadrant | BADHDUFLAG | Total packets | Discarded packets |
| A | 0 | 15484 | 1 |
| B | 0 | 20688 | 1 |
| C | 0 | 23404 | 1 |
| D | 0 | 26640 | 1 |
| Mode M9 | |||
|---|---|---|---|
| Quadrant | BADHDUFLAG | Total packets | Discarded packets |
| A | 0 | 11 | 0 |
| B | 0 | 11 | 0 |
| C | 0 | 11 | 0 |
| D | 0 | 11 | 0 |
| Mode SS | |||
|---|---|---|---|
| Quadrant | BADHDUFLAG | Total packets | Discarded packets |
| A | 0 | 124 | 0 |
| B | 0 | 124 | 0 |
| C | 0 | 124 | 0 |
| D | 0 | 124 | 0 |
| Quadrant | Total seconds | Saturated seconds | Saturation percentage |
|---|---|---|---|
| A | 6139 | 195 | 3.176413% |
| B | 6140 | 537 | 8.745928% |
| C | 6139 | 719 | 11.712005% |
| D | 6139 | 1451 | 23.635771% |
Noise dominated data is calculated using 1-second bins in cleaned event files. If a bin has >2000 counts, and if more than 50% of those come from <1% of pixels, then it is considered to be noise-dominated and hence unusable.
| Quadrant | # 1 sec bins | Bins with >0 counts | Bins with >2000 counts | High rate bins dominated by noise | Noise dominated (total time) | Noise dominated (detector-on time) | Marked lightcurve |
|---|---|---|---|---|---|---|---|
| A | 7224 | 6140 | 152 | 152 | 2.10% | 2.48% | 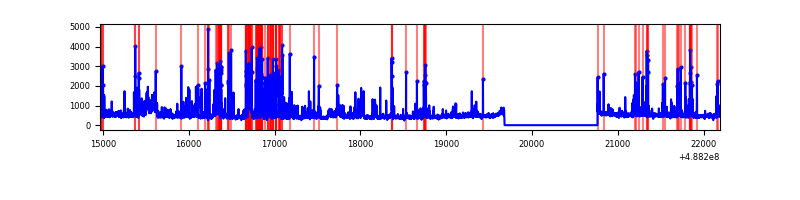 |
| B | 7225 | 6140 | 379 | 379 | 5.25% | 6.17% | 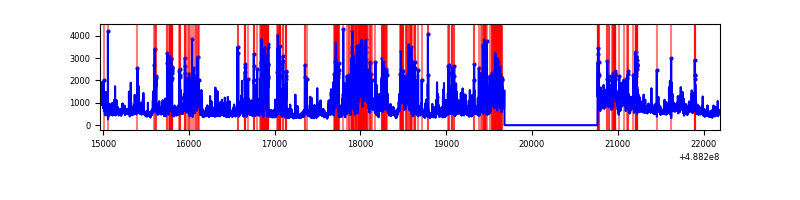 |
| C | 7224 | 6140 | 702 | 702 | 9.72% | 11.43% | 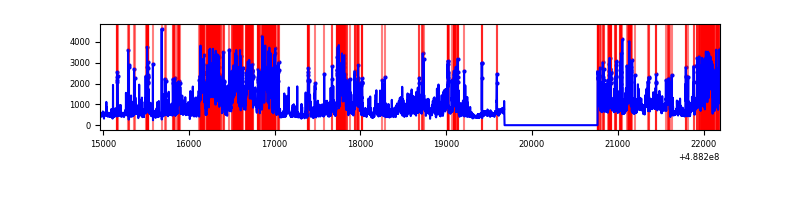 |
| D | 7224 | 6140 | 1220 | 1220 | 16.89% | 19.87% | 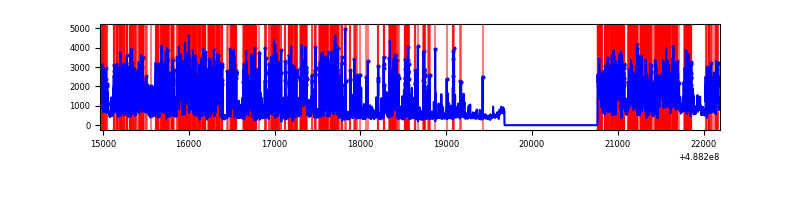 |
Top three noisy pixels from each quadrant. If the there are fewer than three noisy pixels in the level2.evt file, extra rows are filled as -1
| Pixel properties | Quadrant properties | ||||||
|---|---|---|---|---|---|---|---|
| Quadrant | DetID | PixID | Counts | Sigma | Mean | Median | Sigma |
| A | 7 | 206 | 525240 | 3276.97 | 633 | 618 | 160.1 |
| A | 5 | 246 | 251722 | 1568.48 | 633 | 618 | 160.1 |
| A | 3 | 46 | 117357 | 729.19 | 633 | 618 | 160.1 |
| B | 10 | 128 | 1929579 | 14966.49 | 612 | 593 | 128.9 |
| B | 5 | 185 | 503047 | 3898.41 | 612 | 593 | 128.9 |
| B | 12 | 32 | 149788 | 1157.56 | 612 | 593 | 128.9 |
| C | 15 | 248 | 3427152 | 20894.47 | 595 | 590 | 164.0 |
| C | 13 | 3 | 397025 | 2417.38 | 595 | 590 | 164.0 |
| C | 1 | 44 | 55635 | 335.65 | 595 | 590 | 164.0 |
| D | 8 | 176 | 4149943 | 25891.1 | 554 | 526 | 160.3 |
| D | 2 | 37 | 235017 | 1463.15 | 554 | 526 | 160.3 |
| D | 2 | 153 | 106377 | 660.48 | 554 | 526 | 160.3 |
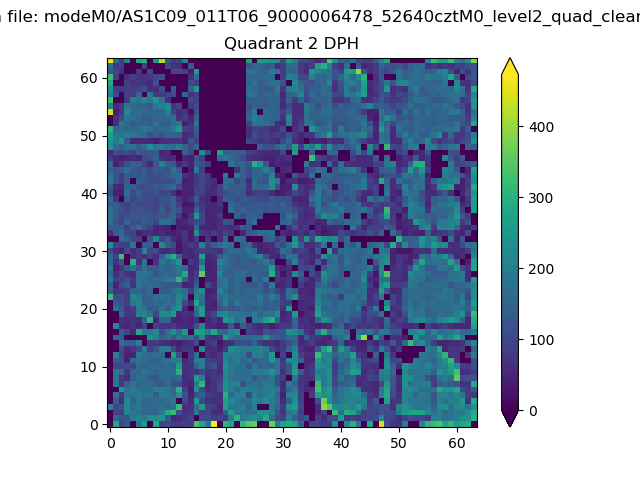
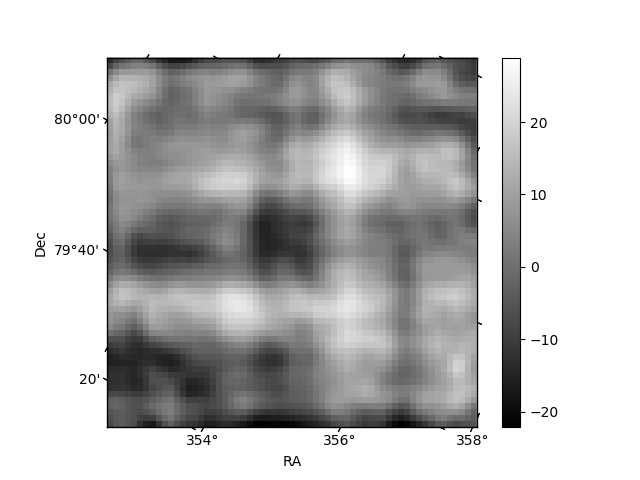
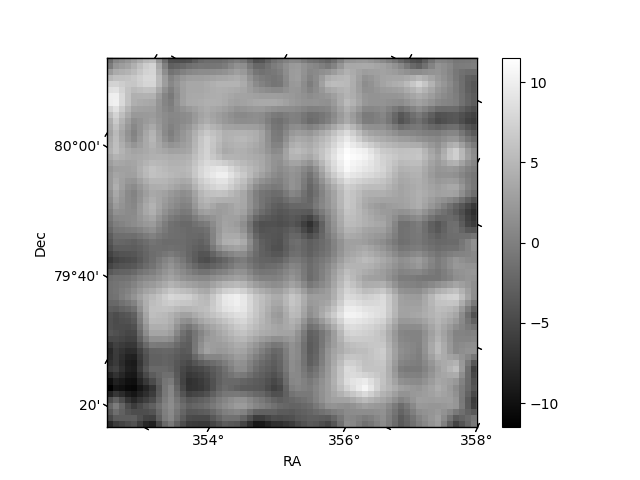
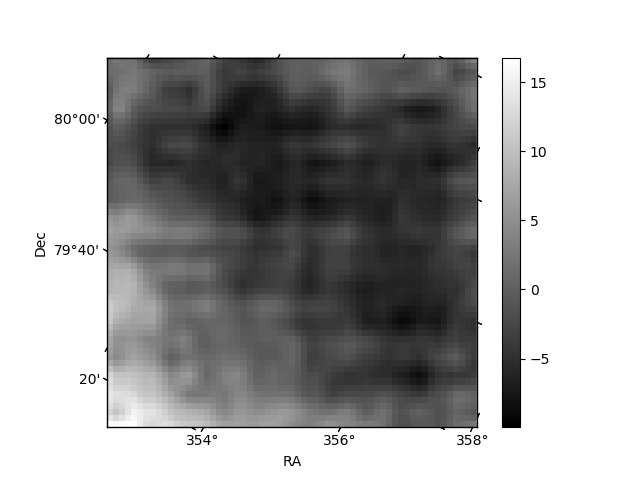
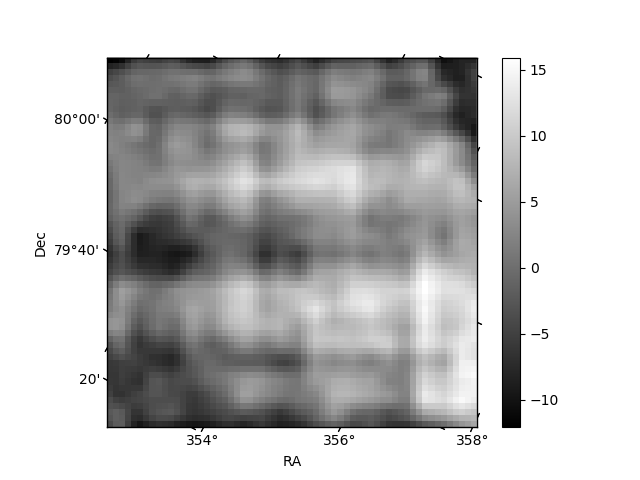
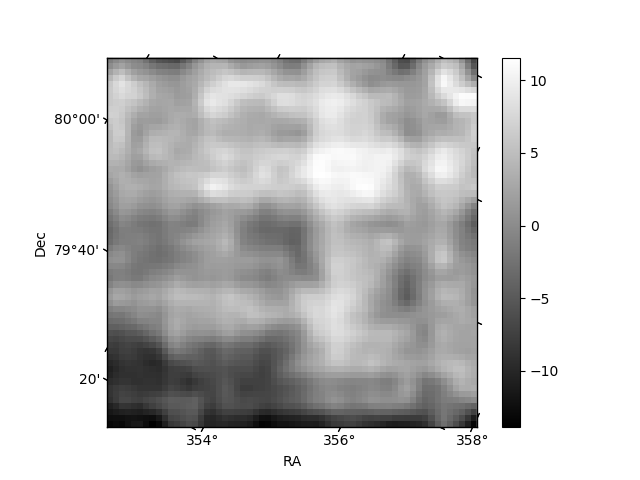
Histogram calculated using DETX and DETY for each event in the final _common_clean file
| Quadrant A | 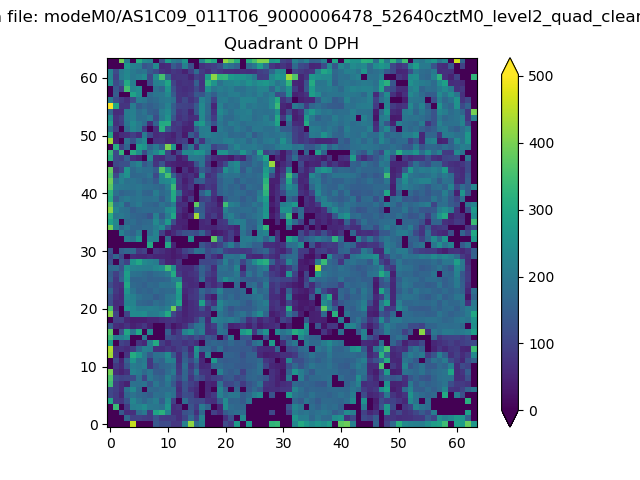 |
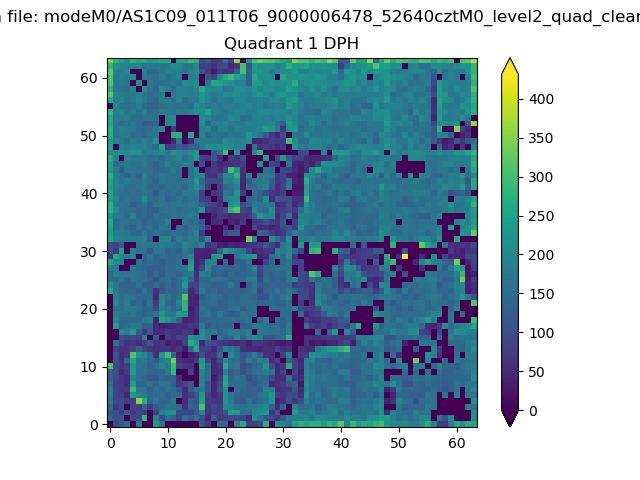 |
Quadrant B |
|---|---|---|---|
| Quadrant D | 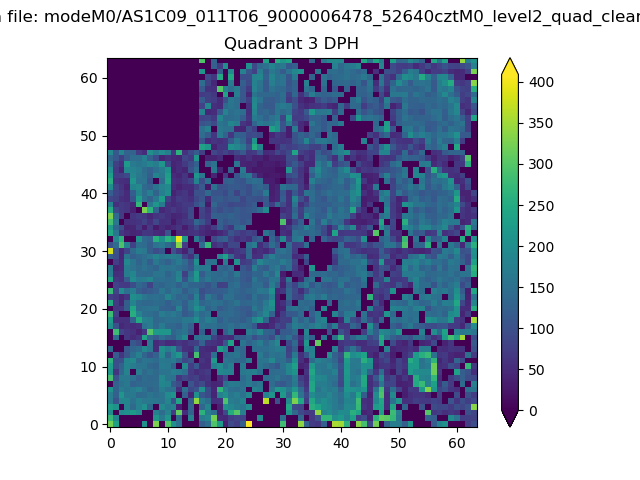 |
 |
Quadrant C |
| Plot type | Count rate plots | Images |
|---|---|---|
| Comparison with Poisson distribution Blue bars denote a histogram of data divided into 1 sec bins. Red curve is a Poisson curve with rate = median count rate of data. |
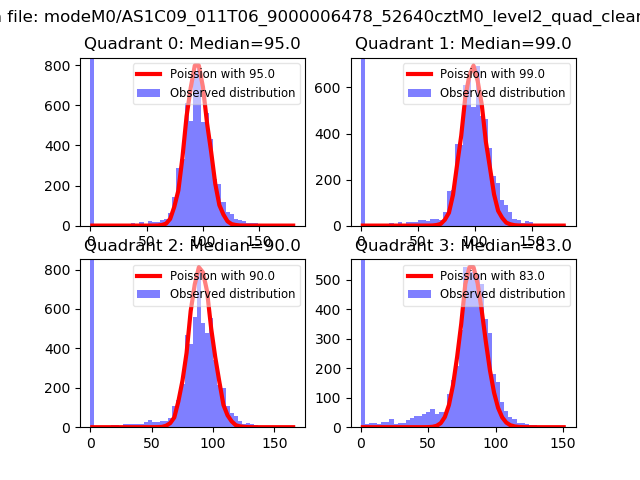 |
 |
| Quadrant-wise count rates Data is divided into 100 sec bins |
 |
|
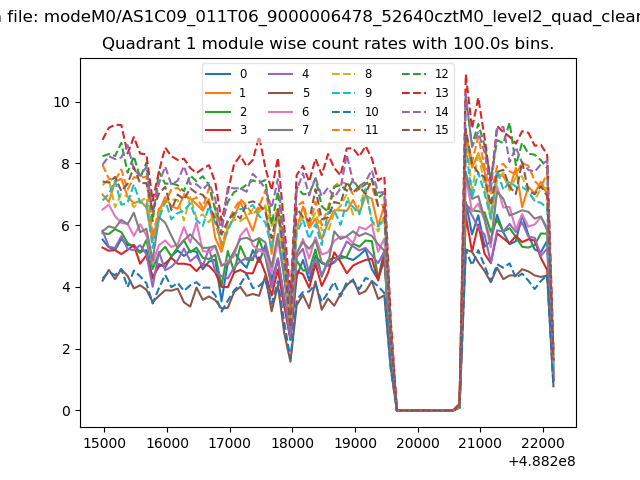
| Module-wise count rates for Quadrant A Data is divided into 100 sec bins |
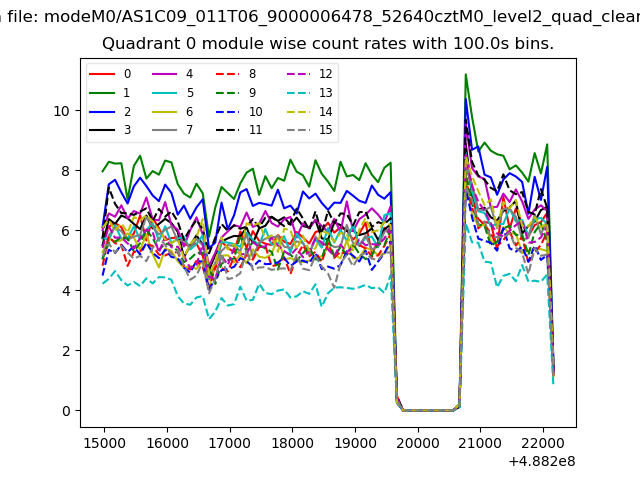 |
 |
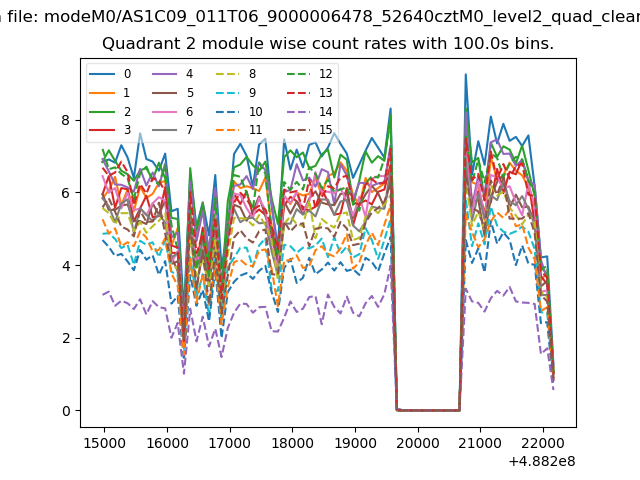
| Module-wise count rates for Quadrant B Data is divided into 100 sec bins |
 |
 |
| Module-wise count rates for Quadrant C Data is divided into 100 sec bins |
 |
 |
| Module-wise count rates for Quadrant D Data is divided into 100 sec bins |
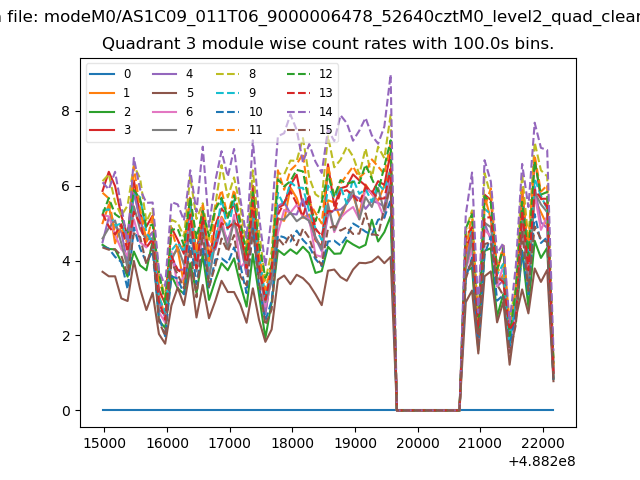 |
 |
| Parameter | Plot |
|---|---|
| CZT HV Monitor | 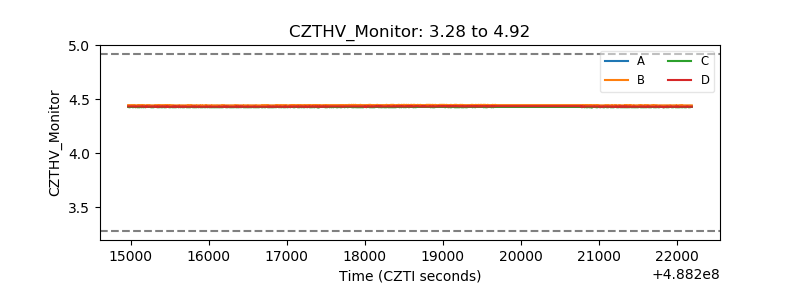 |
| D_VDD | 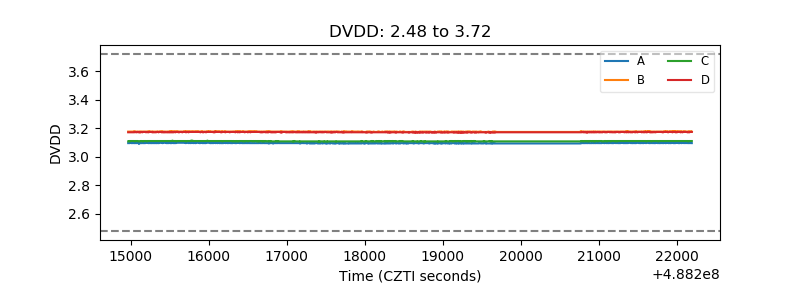 |
| Temperature 1 | 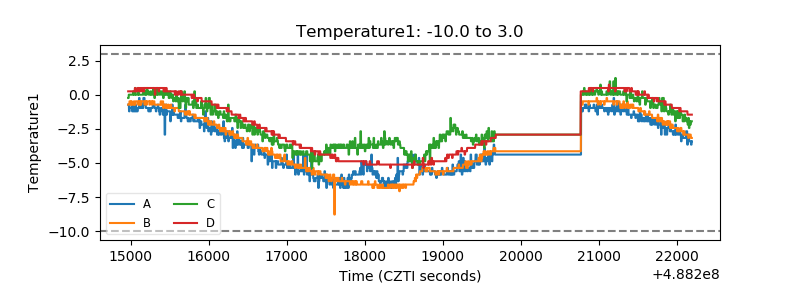 |
| Veto HV Monitor |  |
| Veto LLD | 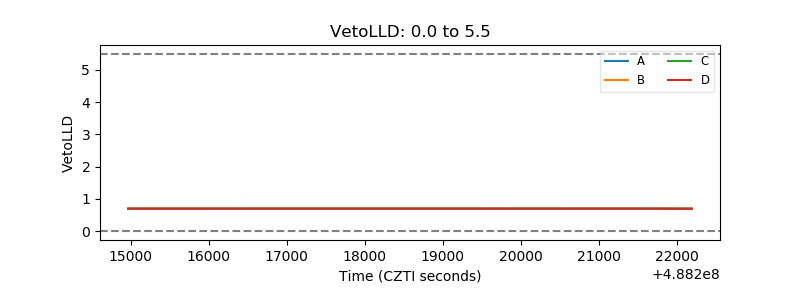 |
| Alpha Counter | 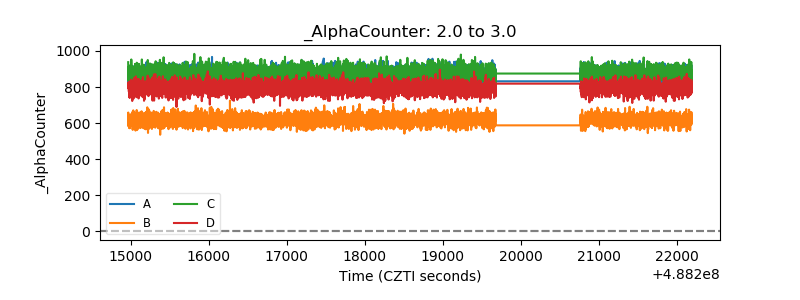 |
| _CPM_Rate | 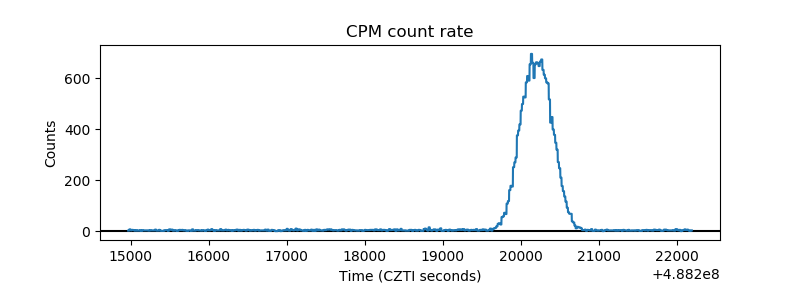 |
| CZT Counter | 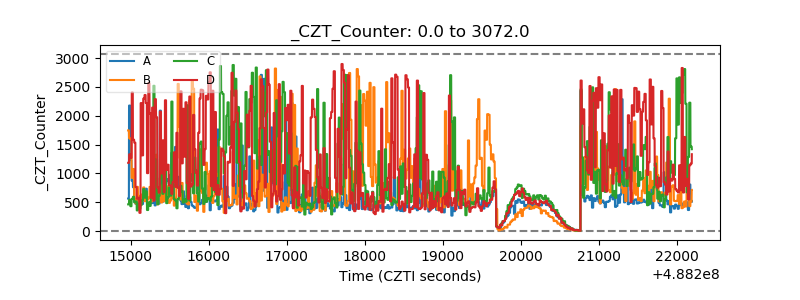 |
| +2.5 Volts monitor |  |
| +5 Volts monitor |  |
| _ROLL_ROT |  |
| _Roll_DEC | 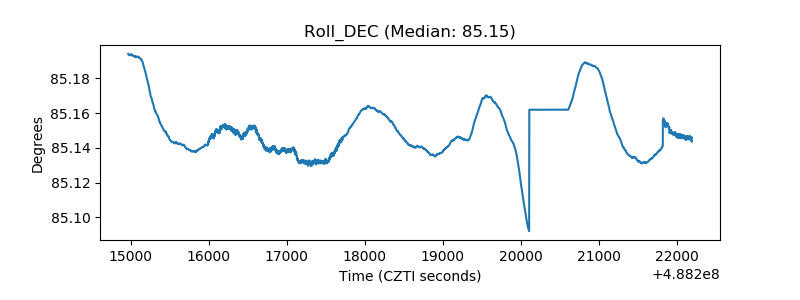 |
| _Roll_RA | 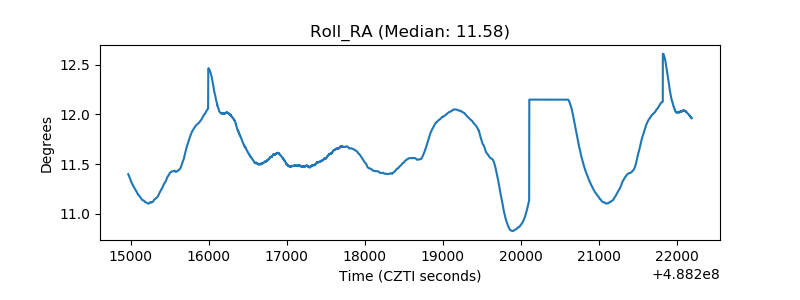 |
| Veto Counter | 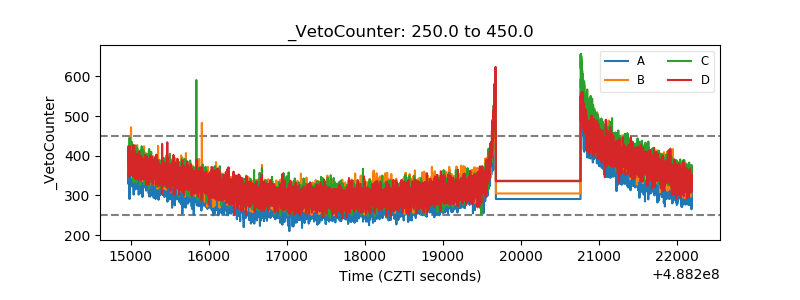 |