| Param | Original file | Final file |
|---|---|---|
| Filename | modeM0/AS1C09_011T06_9000006478_52644cztM0_level2.fits | modeM0/AS1C09_011T06_9000006478_52644cztM0_level2_quad_clean.evt |
| Size (bytes) | 335,018,880 | 39,444,480 |
| Size | 319.5 MB | 37.6 MB |
| Events in quadrant A | 1,861,048 | 287,815 |
| Events in quadrant B | 2,214,569 | 298,598 |
| Events in quadrant C | 4,604,182 | 165,963 |
| Events in quadrant D | 3,479,613 | 221,725 |
| Mode M0 | |||
|---|---|---|---|
| Quadrant | BADHDUFLAG | Total packets | Discarded packets |
| A | 0 | 7971 | 1 |
| B | 0 | 8818 | 1 |
| C | 0 | 15834 | 1 |
| D | 0 | 12544 | 1 |
| Mode M9 | |||
|---|---|---|---|
| Quadrant | BADHDUFLAG | Total packets | Discarded packets |
| A | 0 | 8 | 0 |
| B | 0 | 9 | 0 |
| C | 0 | 9 | 0 |
| D | 0 | 9 | 0 |
| Mode SS | |||
|---|---|---|---|
| Quadrant | BADHDUFLAG | Total packets | Discarded packets |
| A | 0 | 62 | 0 |
| B | 0 | 62 | 0 |
| C | 0 | 62 | 0 |
| D | 0 | 62 | 0 |
| Quadrant | Total seconds | Saturated seconds | Saturation percentage |
|---|---|---|---|
| A | 3094 | 89 | 2.876535% |
| B | 3094 | 162 | 5.235941% |
| C | 3094 | 1350 | 43.632838% |
| D | 3094 | 591 | 19.101487% |
Noise dominated data is calculated using 1-second bins in cleaned event files. If a bin has >2000 counts, and if more than 50% of those come from <1% of pixels, then it is considered to be noise-dominated and hence unusable.
| Quadrant | # 1 sec bins | Bins with >0 counts | Bins with >2000 counts | High rate bins dominated by noise | Noise dominated (total time) | Noise dominated (detector-on time) | Marked lightcurve |
|---|---|---|---|---|---|---|---|
| A | 3094 | 3094 | 77 | 77 | 2.49% | 2.49% | 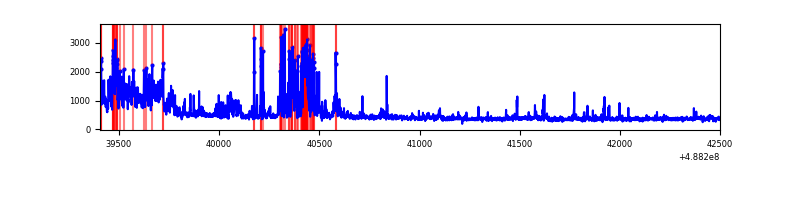 |
| B | 3094 | 3094 | 137 | 137 | 4.43% | 4.43% | 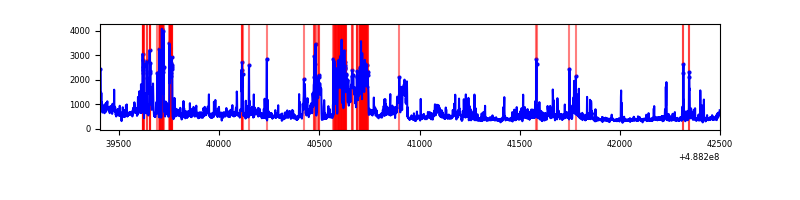 |
| C | 3094 | 3094 | 1173 | 1173 | 37.91% | 37.91% | 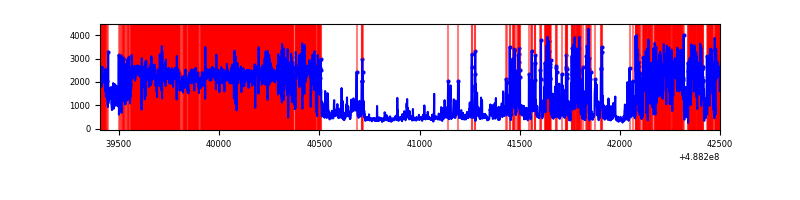 |
| D | 3094 | 3094 | 523 | 523 | 16.90% | 16.90% | 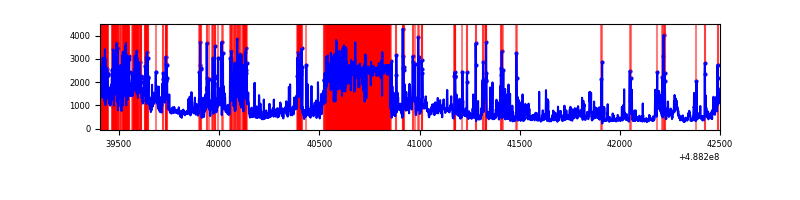 |
Top three noisy pixels from each quadrant. If the there are fewer than three noisy pixels in the level2.evt file, extra rows are filled as -1
| Pixel properties | Quadrant properties | ||||||
|---|---|---|---|---|---|---|---|
| Quadrant | DetID | PixID | Counts | Sigma | Mean | Median | Sigma |
| A | 5 | 243 | 214413 | 2834.06 | 295 | 288 | 75.6 |
| A | 3 | 14 | 210482 | 2782.03 | 295 | 288 | 75.6 |
| A | 8 | 246 | 105828 | 1396.88 | 295 | 288 | 75.6 |
| B | 10 | 128 | 693050 | 10668.86 | 296 | 286 | 64.9 |
| B | 5 | 185 | 76721 | 1177.13 | 296 | 286 | 64.9 |
| B | 10 | 13 | 47175 | 722.11 | 296 | 286 | 64.9 |
| C | 15 | 178 | 3035467 | 49466.22 | 212 | 210 | 61.4 |
| C | 15 | 248 | 531475 | 8658.14 | 212 | 210 | 61.4 |
| C | 13 | 3 | 100301 | 1631.2 | 212 | 210 | 61.4 |
| D | 15 | 93 | 784740 | 10043.53 | 264 | 251 | 78.1 |
| D | 8 | 176 | 751102 | 9612.88 | 264 | 251 | 78.1 |
| D | 1 | 7 | 163615 | 2091.49 | 264 | 251 | 78.1 |
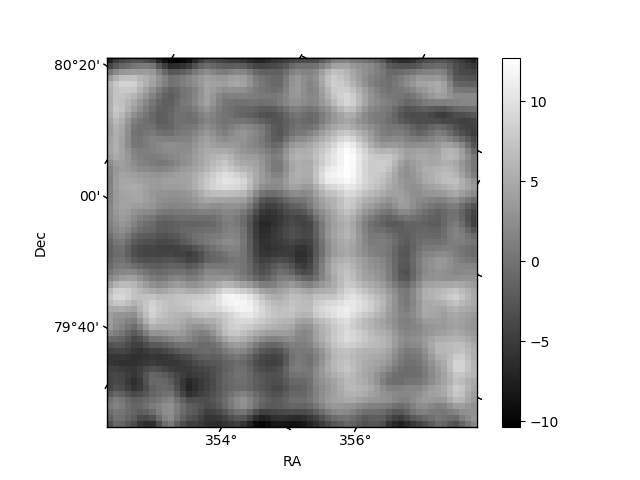
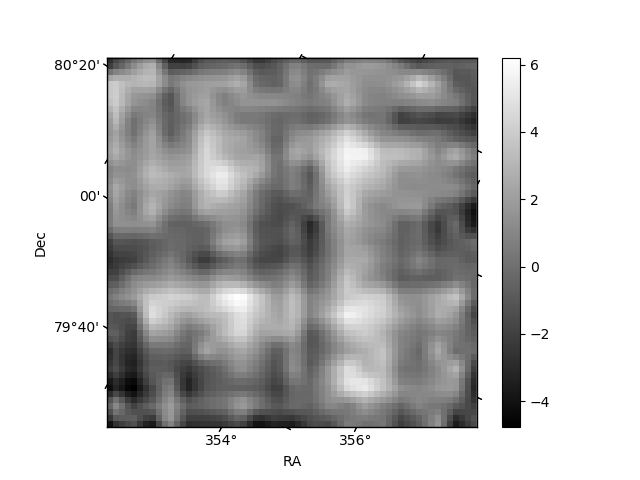
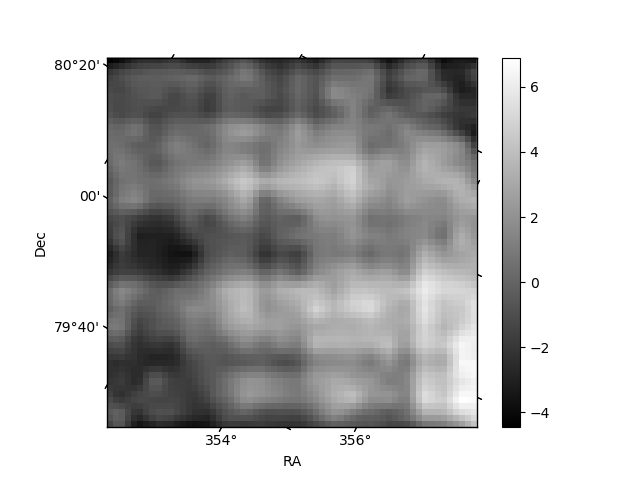
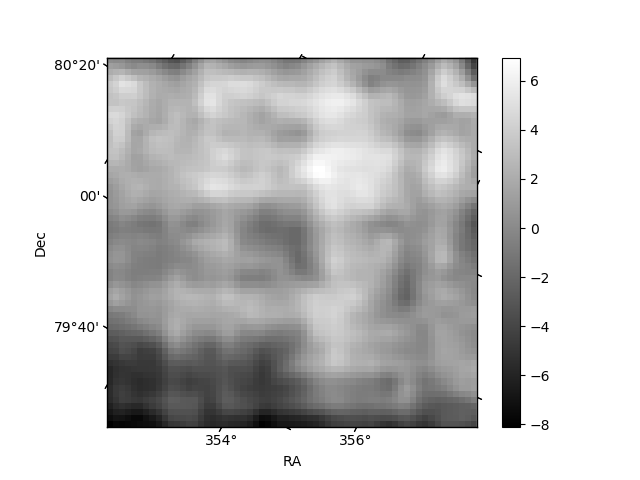
Histogram calculated using DETX and DETY for each event in the final _common_clean file
| Quadrant A | 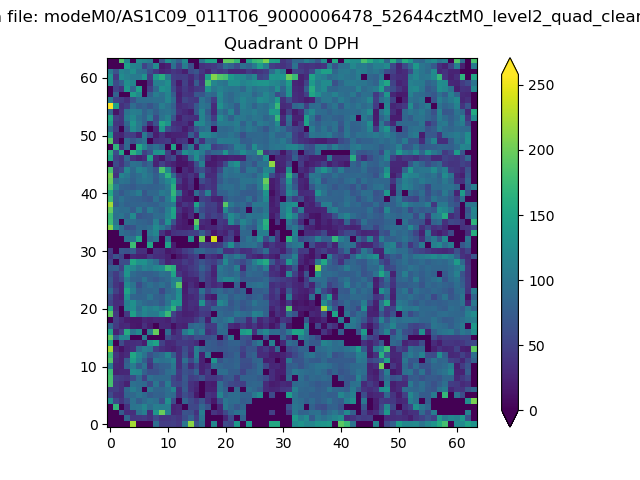 |
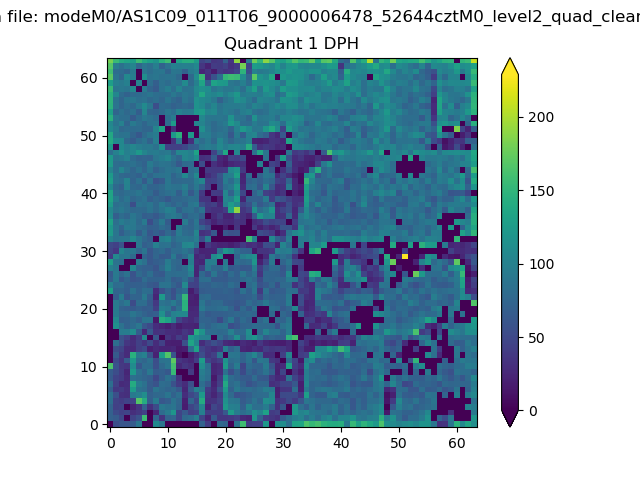 |
Quadrant B |
|---|---|---|---|
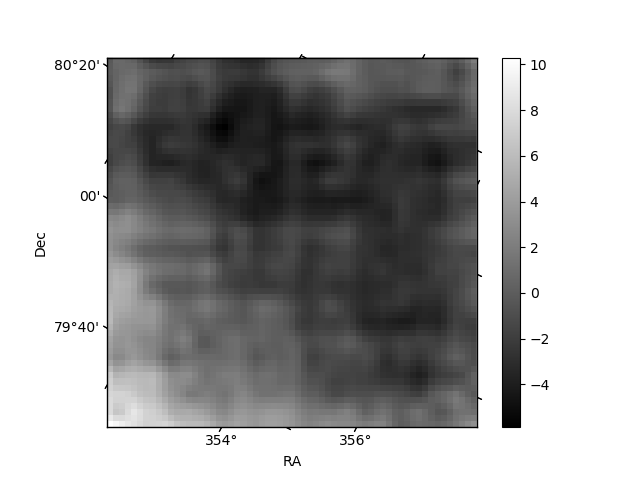
| Quadrant D | 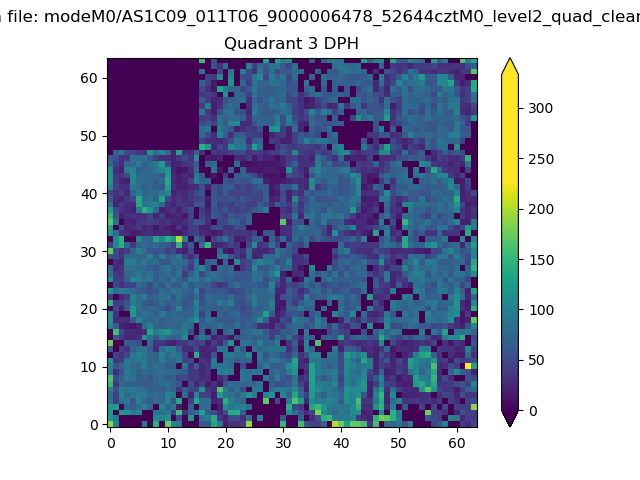 |
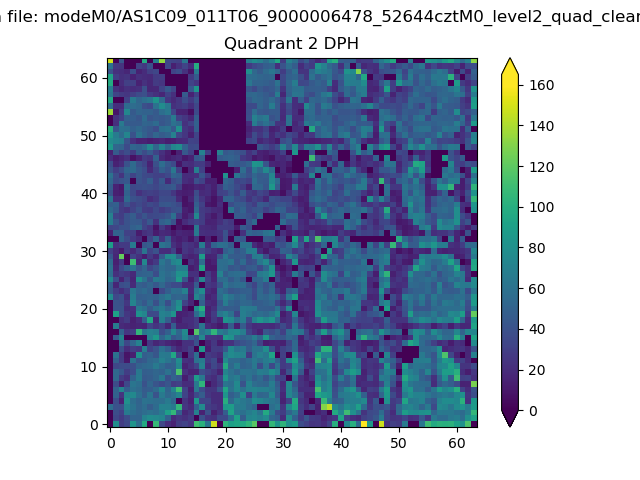 |
Quadrant C |
| Plot type | Count rate plots | Images |
|---|---|---|
| Comparison with Poisson distribution Blue bars denote a histogram of data divided into 1 sec bins. Red curve is a Poisson curve with rate = median count rate of data. |
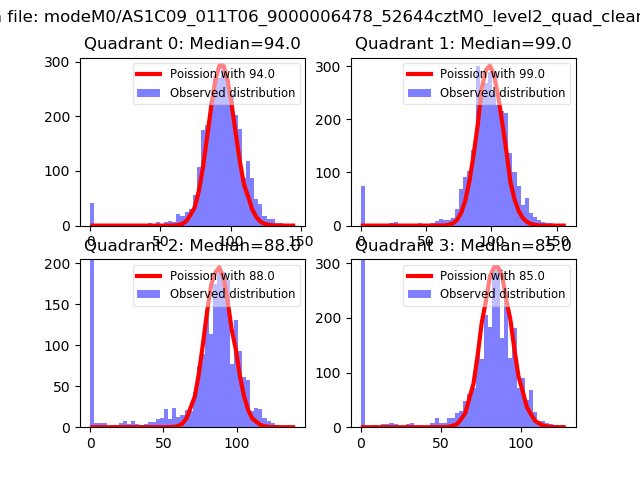 |
 |
| Quadrant-wise count rates Data is divided into 100 sec bins |
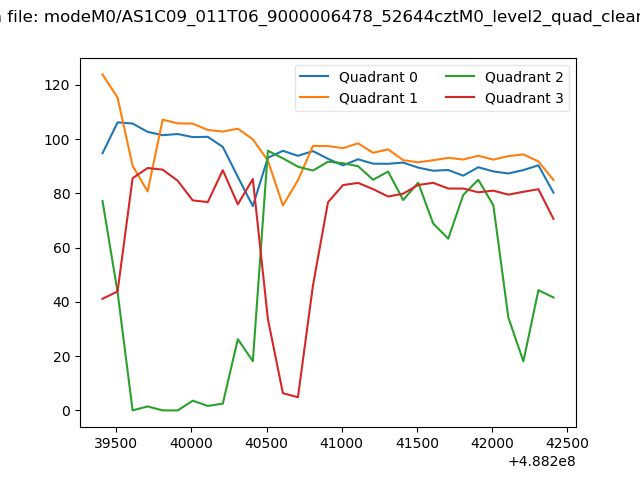 |
|
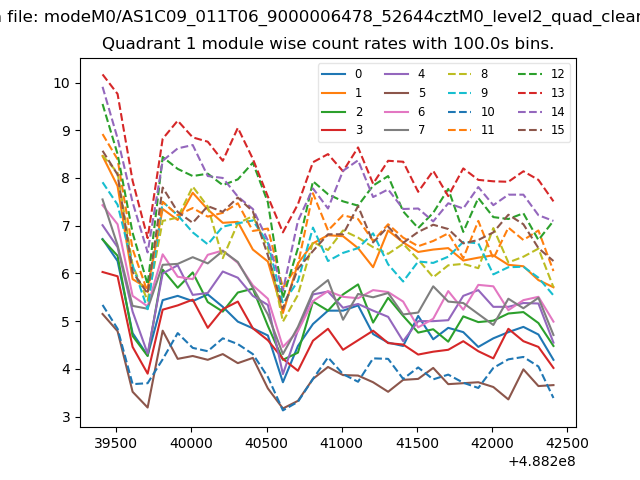
| Module-wise count rates for Quadrant A Data is divided into 100 sec bins |
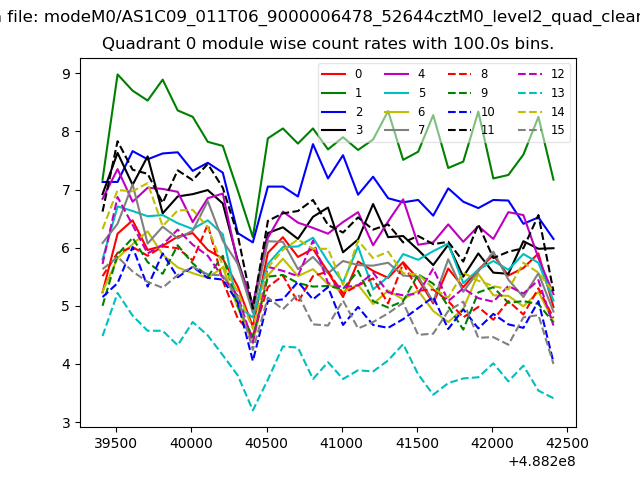 |
 |
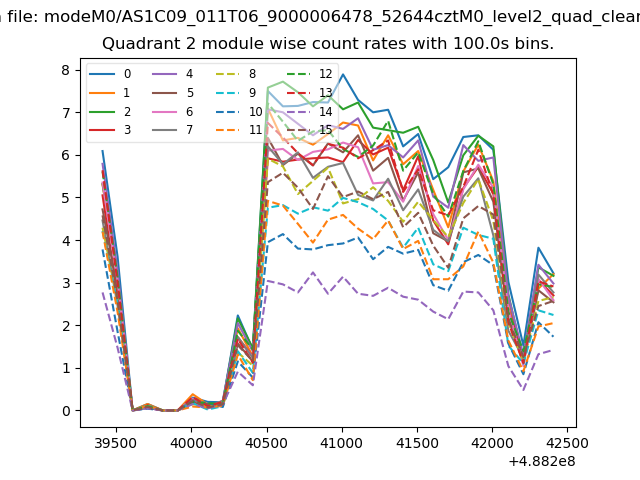
| Module-wise count rates for Quadrant B Data is divided into 100 sec bins |
 |
 |
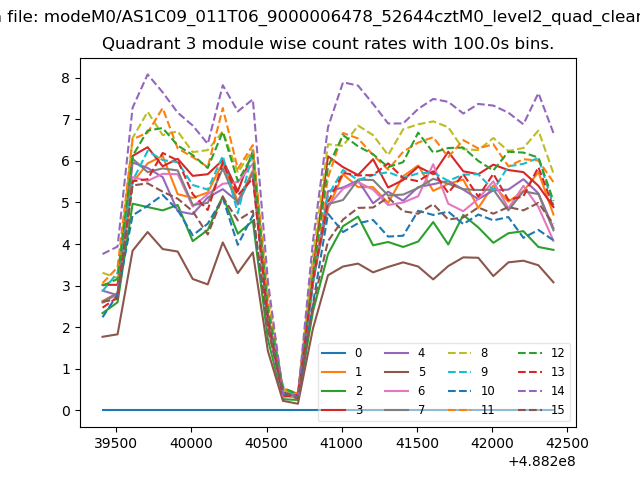
| Module-wise count rates for Quadrant C Data is divided into 100 sec bins |
 |
 |
| Module-wise count rates for Quadrant D Data is divided into 100 sec bins |
 |
 |
| Parameter | Plot |
|---|---|
| CZT HV Monitor | 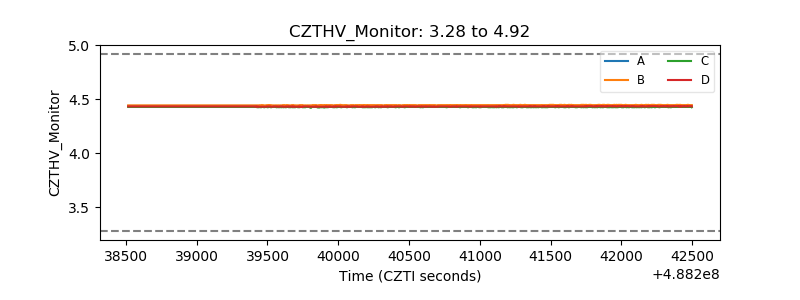 |
| D_VDD | 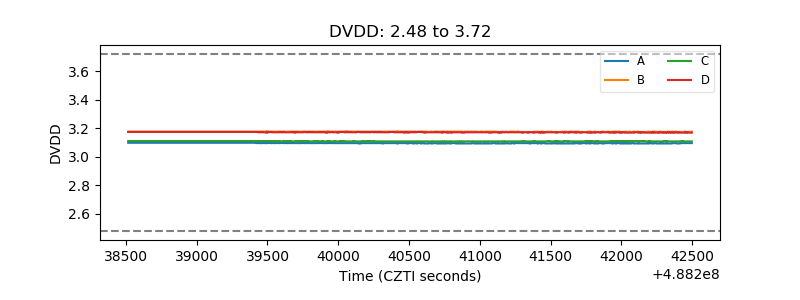 |
| Temperature 1 | 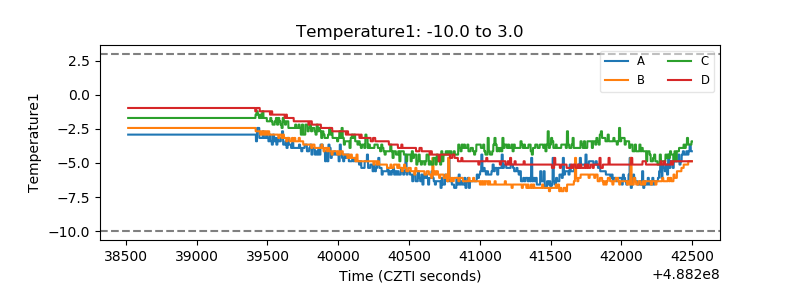 |
| Veto HV Monitor | 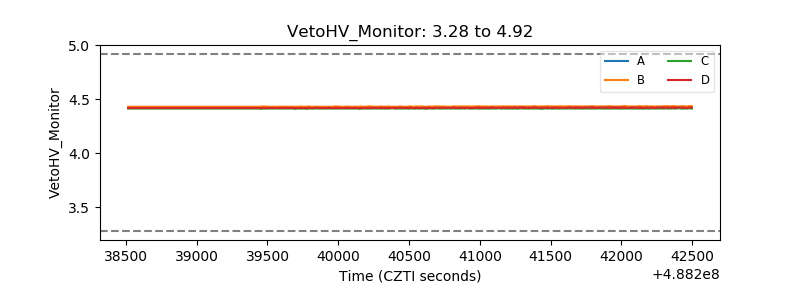 |
| Veto LLD | 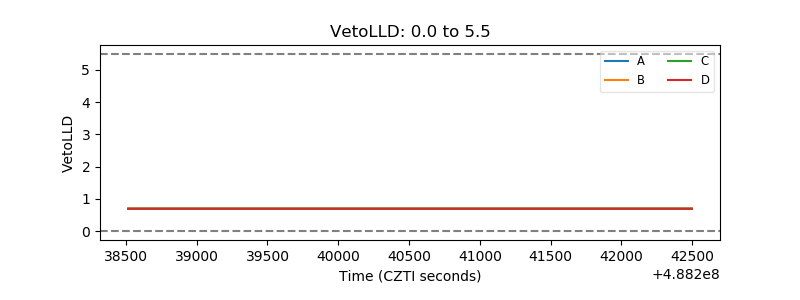 |
| Alpha Counter | 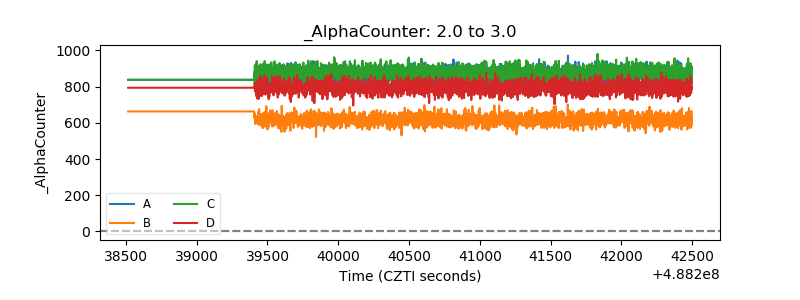 |
| _CPM_Rate | 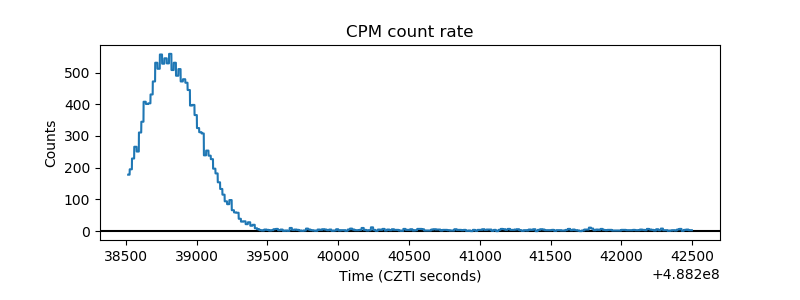 |
| CZT Counter | 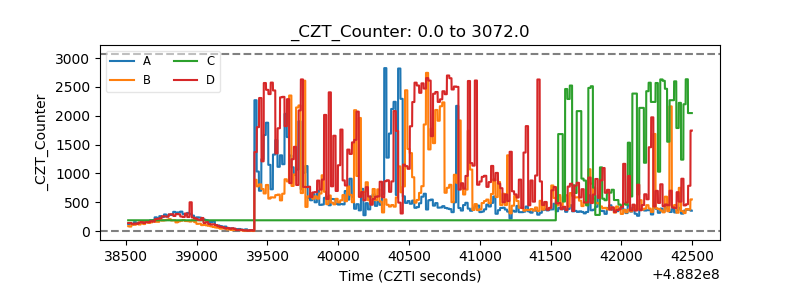 |
| +2.5 Volts monitor | 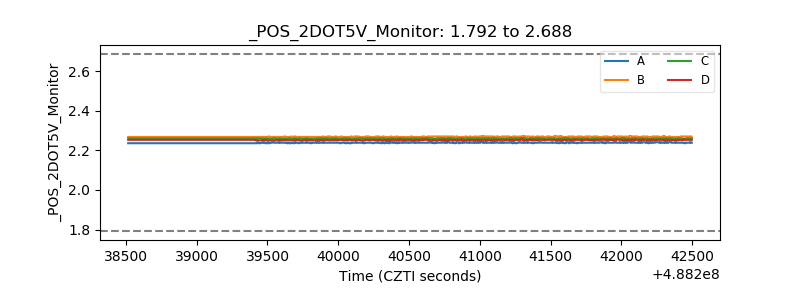 |
| +5 Volts monitor |  |
| _ROLL_ROT | 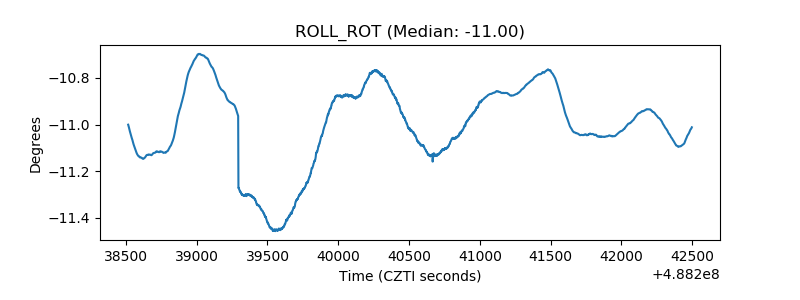 |
| _Roll_DEC | 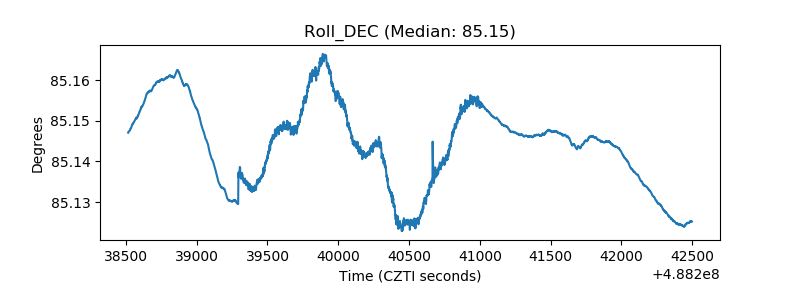 |
| _Roll_RA | 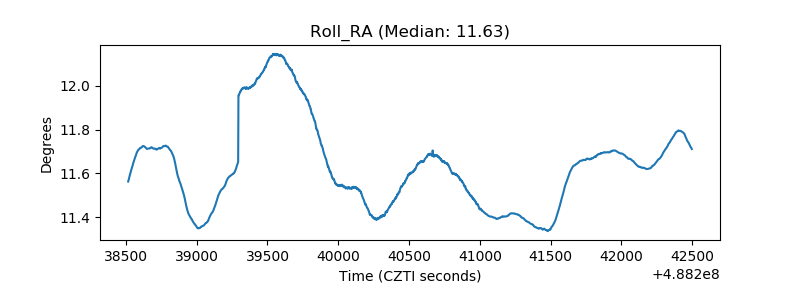 |
| Veto Counter | 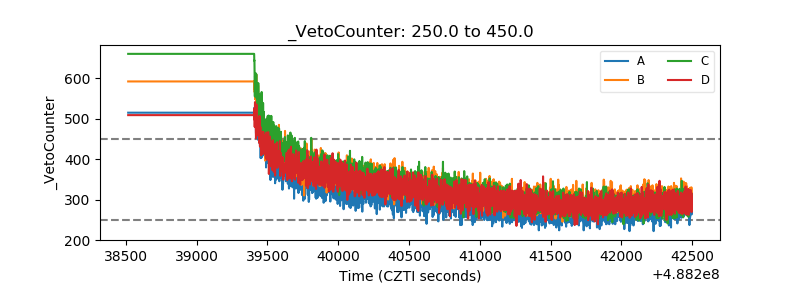 |