| Param | Original file | Final file |
|---|---|---|
| Filename | modeM0/AS1C09_011T07_9000006480_52680cztM0_level2.fits | modeM0/AS1C09_011T07_9000006480_52680cztM0_level2_quad_clean.evt |
| Size (bytes) | 2,555,850,240 | 186,071,040 |
| Size | 2.4 GB | 177.5 MB |
| Events in quadrant A | 11,662,502 | 1,511,057 |
| Events in quadrant B | 22,001,435 | 1,428,035 |
| Events in quadrant C | 20,774,647 | 1,202,633 |
| Events in quadrant D | 38,853,053 | 307,847 |
| Mode M9 | |||
|---|---|---|---|
| Quadrant | BADHDUFLAG | Total packets | Discarded packets |
| A | 0 | 14 | 0 |
| B | 0 | 14 | 0 |
| C | 0 | 14 | 0 |
| D | 0 | 14 | 0 |
| Mode SS | |||
|---|---|---|---|
| Quadrant | BADHDUFLAG | Total packets | Discarded packets |
| A | 0 | 350 | 0 |
| B | 0 | 350 | 0 |
| C | 0 | 350 | 0 |
| D | 0 | 350 | 0 |
| Mode M0 | |||
|---|---|---|---|
| Quadrant | BADHDUFLAG | Total packets | Discarded packets |
| A | 0 | 46551 | 3 |
| B | 0 | 77491 | 3 |
| C | 0 | 73636 | 8 |
| D | 0 | 127055 | 3 |
| Quadrant | Total seconds | Saturated seconds | Saturation percentage |
|---|---|---|---|
| A | 17153 | 598 | 3.486271% |
| B | 17153 | 3284 | 19.145339% |
| C | 17152 | 3235 | 18.860774% |
| D | 17152 | 13719 | 79.984841% |
Noise dominated data is calculated using 1-second bins in cleaned event files. If a bin has >2000 counts, and if more than 50% of those come from <1% of pixels, then it is considered to be noise-dominated and hence unusable.
| Quadrant | # 1 sec bins | Bins with >0 counts | Bins with >2000 counts | High rate bins dominated by noise | Noise dominated (total time) | Noise dominated (detector-on time) | Marked lightcurve |
|---|---|---|---|---|---|---|---|
| A | 18448 | 17157 | 316 | 316 | 1.71% | 1.84% | 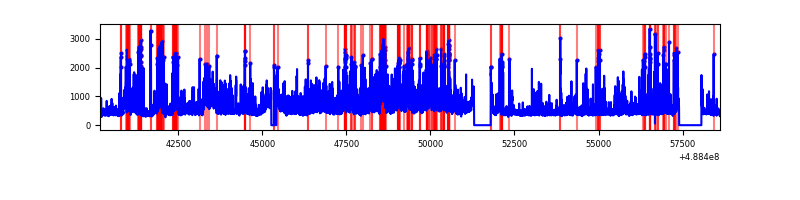 |
| B | 18448 | 17157 | 2477 | 2477 | 13.43% | 14.44% | 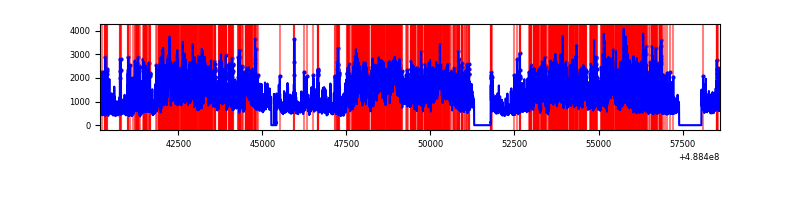 |
| C | 18447 | 17156 | 3083 | 3083 | 16.71% | 17.97% | 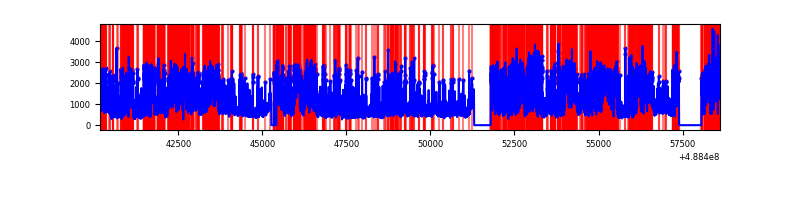 |
| D | 18447 | 17156 | 12250 | 12250 | 66.41% | 71.40% | 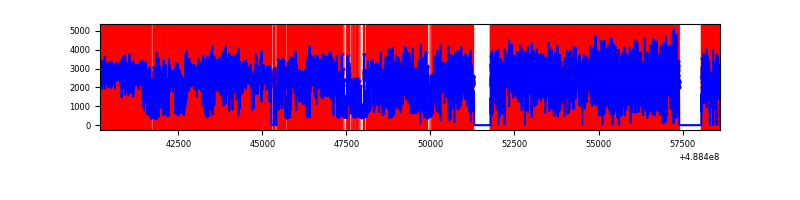 |
Top three noisy pixels from each quadrant. If the there are fewer than three noisy pixels in the level2.evt file, extra rows are filled as -1
| Pixel properties | Quadrant properties | ||||||
|---|---|---|---|---|---|---|---|
| Quadrant | DetID | PixID | Counts | Sigma | Mean | Median | Sigma |
| A | 3 | 14 | 2689234 | 6108.4 | 1767 | 1722 | 440.0 |
| A | 3 | 114 | 392949 | 889.21 | 1767 | 1722 | 440.0 |
| A | 15 | 174 | 263255 | 594.43 | 1767 | 1722 | 440.0 |
| B | 10 | 128 | 9158704 | 25922.31 | 1663 | 1604 | 353.3 |
| B | 12 | 32 | 1988704 | 5625.17 | 1663 | 1604 | 353.3 |
| B | 10 | 254 | 693213 | 1957.84 | 1663 | 1604 | 353.3 |
| C | 15 | 248 | 8851180 | 20058.03 | 1600 | 1585 | 441.2 |
| C | 15 | 234 | 1656070 | 3749.97 | 1600 | 1585 | 441.2 |
| C | 12 | 252 | 550817 | 1244.86 | 1600 | 1585 | 441.2 |
| D | 8 | 176 | 33368190 | 155140.26 | 736 | 701 | 215.1 |
| D | 2 | 153 | 803051 | 3730.48 | 736 | 701 | 215.1 |
| D | 1 | 7 | 509579 | 2366.0 | 736 | 701 | 215.1 |
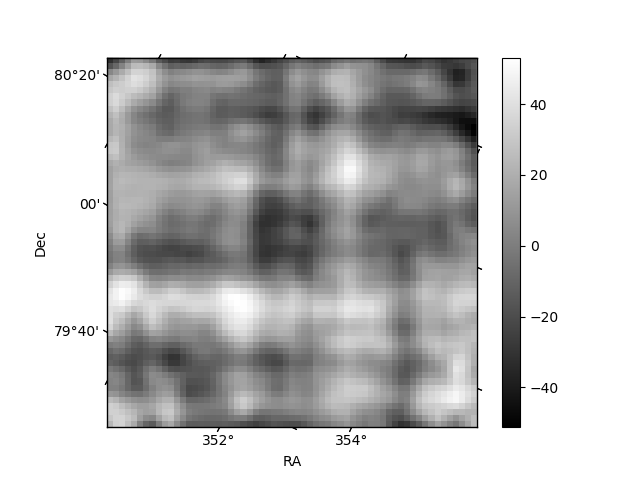
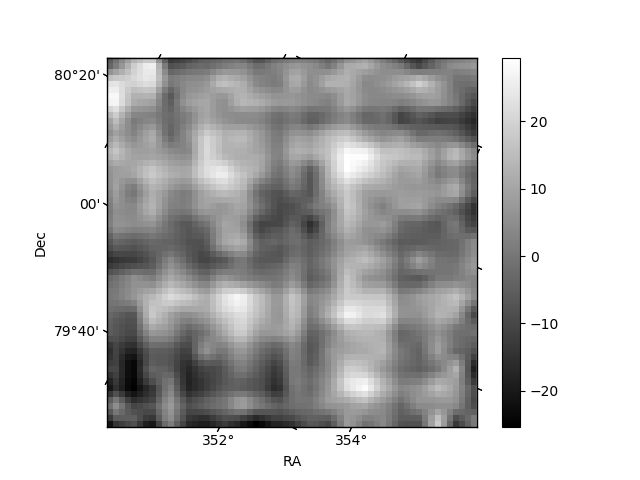
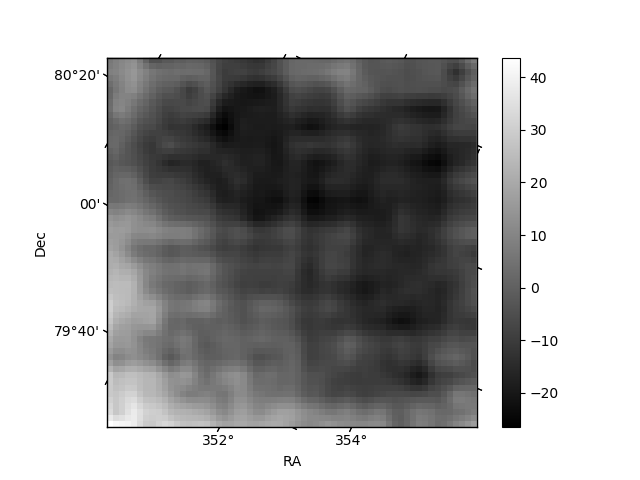
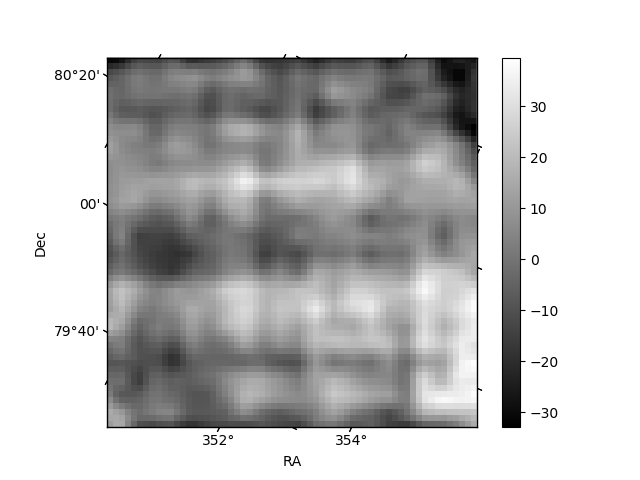
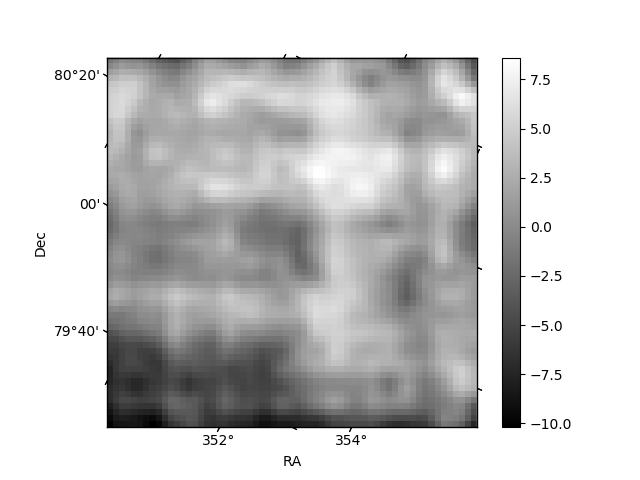
Histogram calculated using DETX and DETY for each event in the final _common_clean file
| Quadrant A | 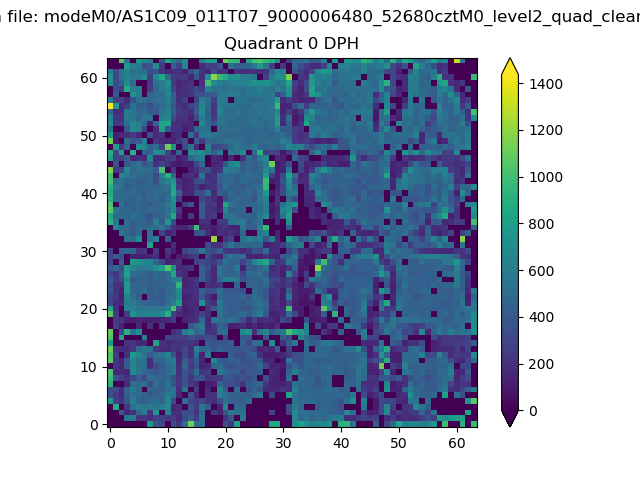 |
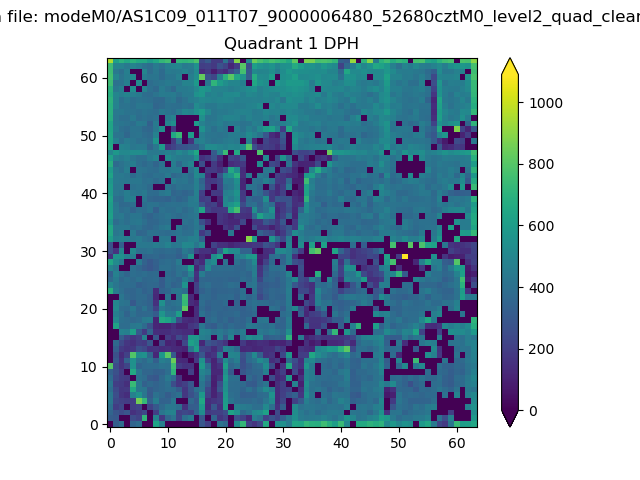 |
Quadrant B |
|---|---|---|---|
| Quadrant D | 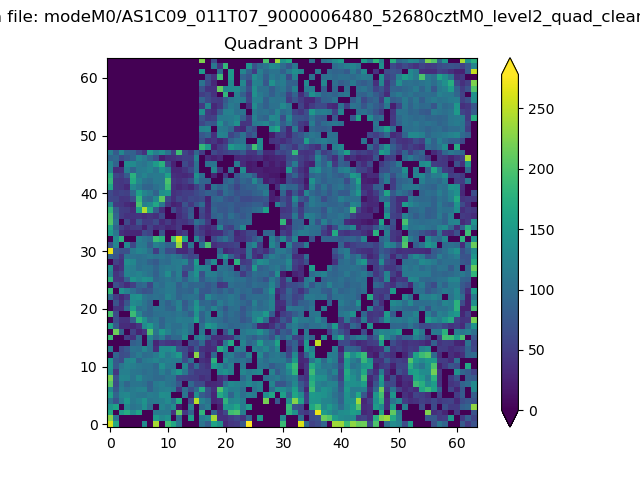 |
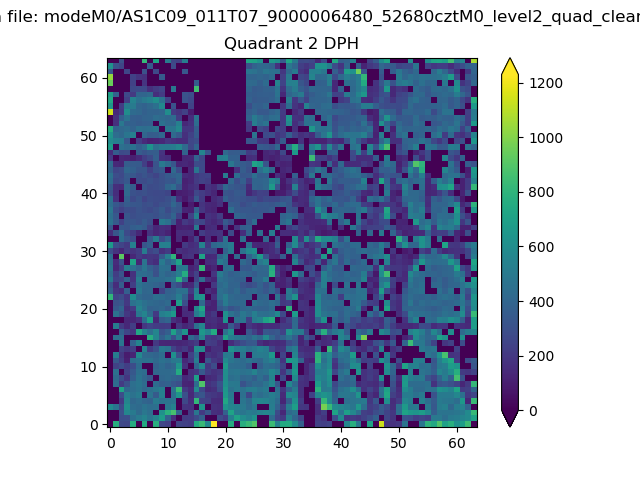 |
Quadrant C |
| Plot type | Count rate plots | Images |
|---|---|---|
| Comparison with Poisson distribution Blue bars denote a histogram of data divided into 1 sec bins. Red curve is a Poisson curve with rate = median count rate of data. |
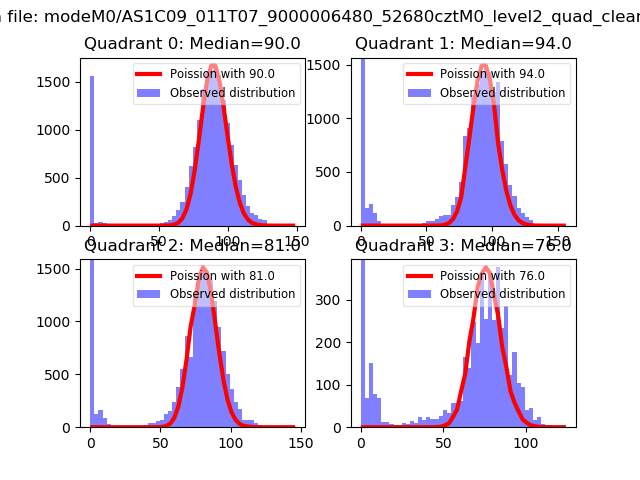 |
 |
| Quadrant-wise count rates Data is divided into 100 sec bins |
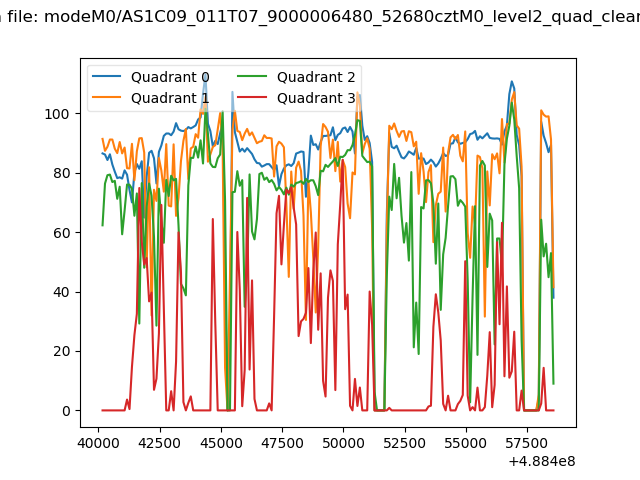 |
|
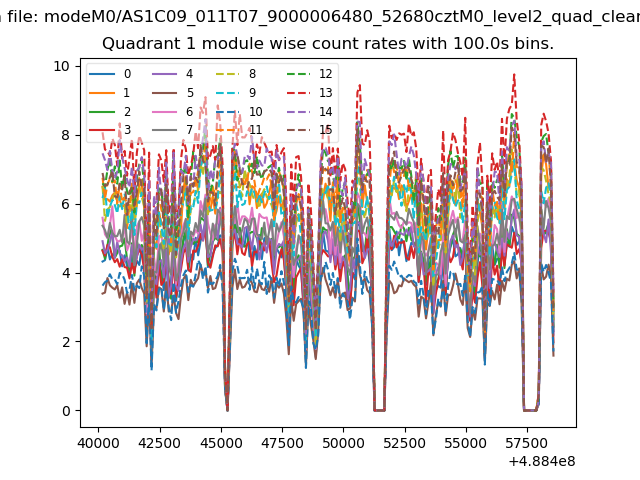
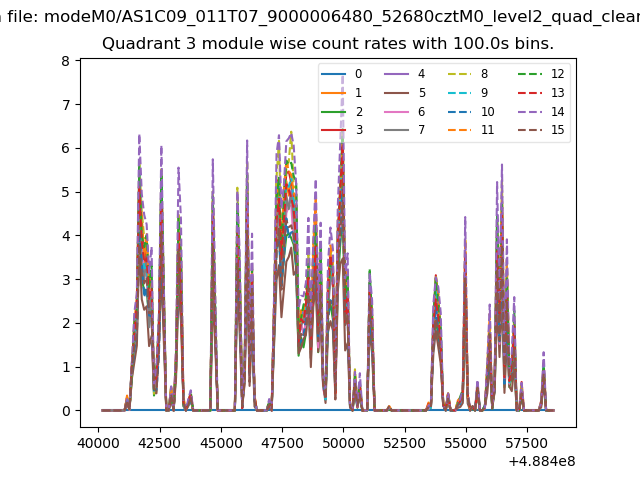
| Module-wise count rates for Quadrant A Data is divided into 100 sec bins |
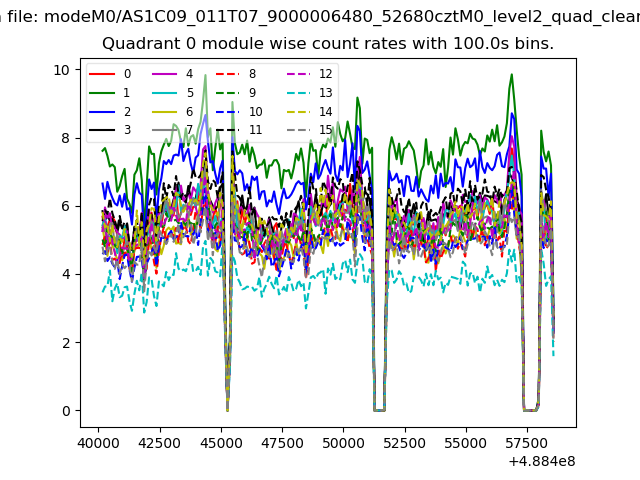 |
 |
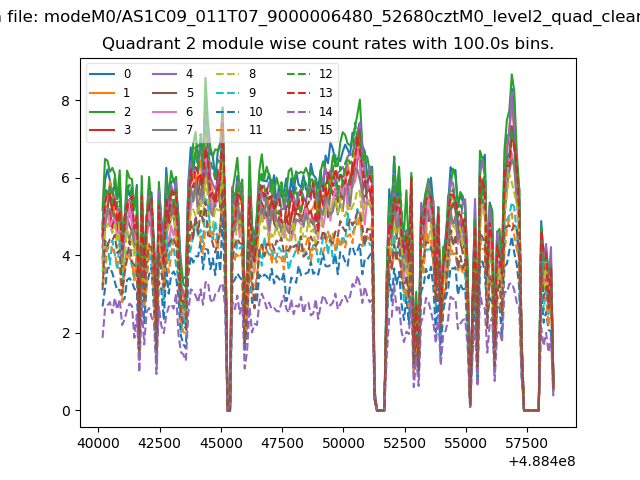
| Module-wise count rates for Quadrant B Data is divided into 100 sec bins |
 |
 |
| Module-wise count rates for Quadrant C Data is divided into 100 sec bins |
 |
 |
| Module-wise count rates for Quadrant D Data is divided into 100 sec bins |
 |
 |
| Parameter | Plot |
|---|---|
| CZT HV Monitor | 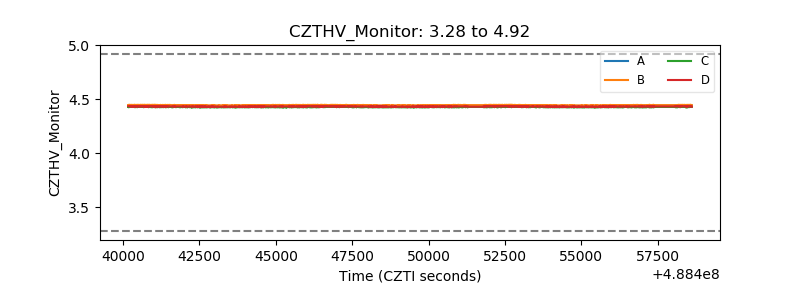 |
| D_VDD | 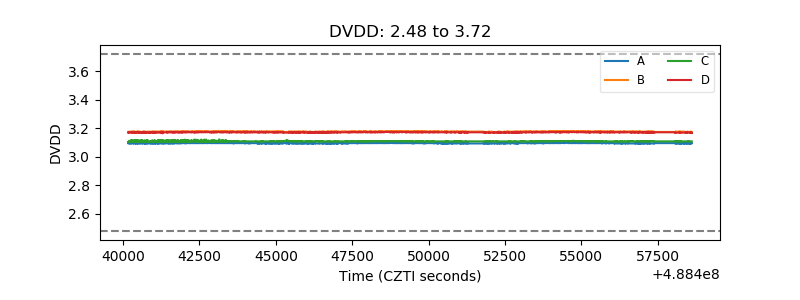 |
| Temperature 1 | 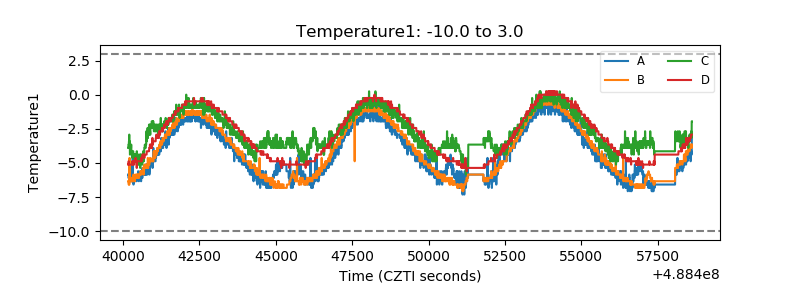 |
| Veto HV Monitor | 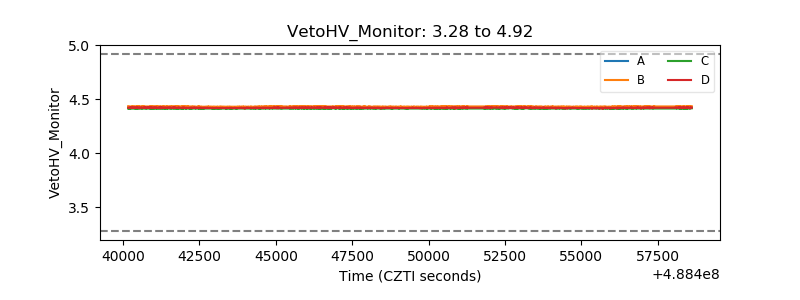 |
| Veto LLD | 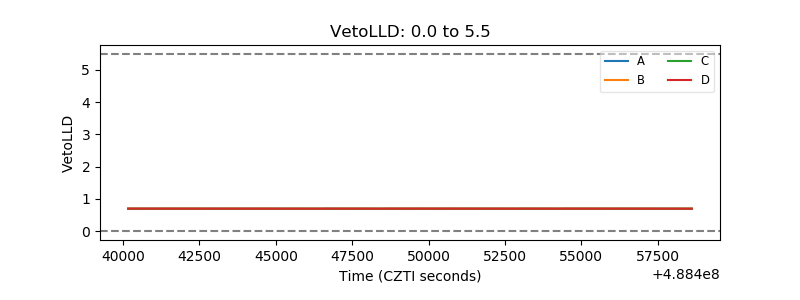 |
| Alpha Counter | 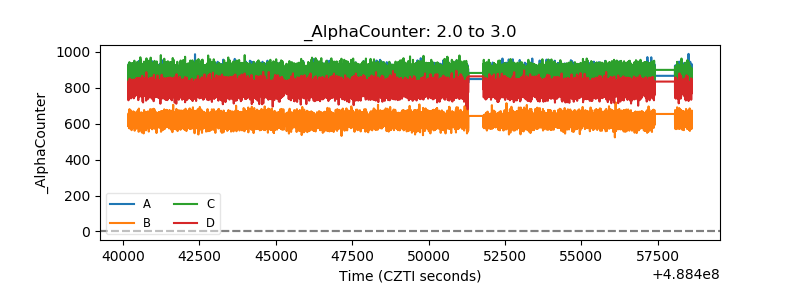 |
| _CPM_Rate | 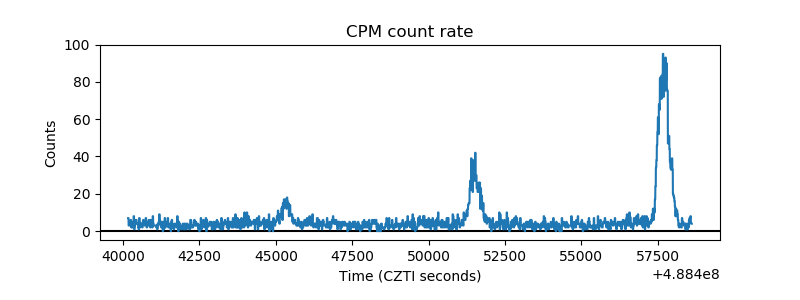 |
| CZT Counter | 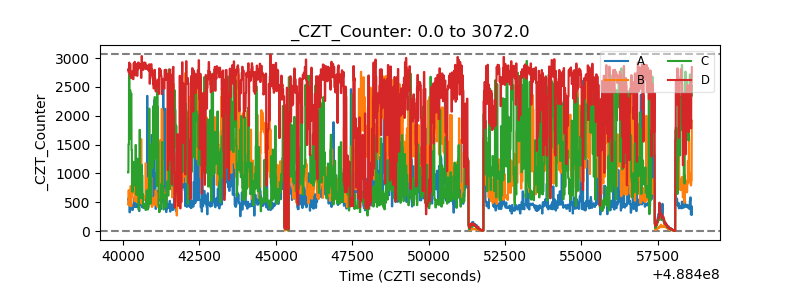 |
| +2.5 Volts monitor |  |
| +5 Volts monitor | 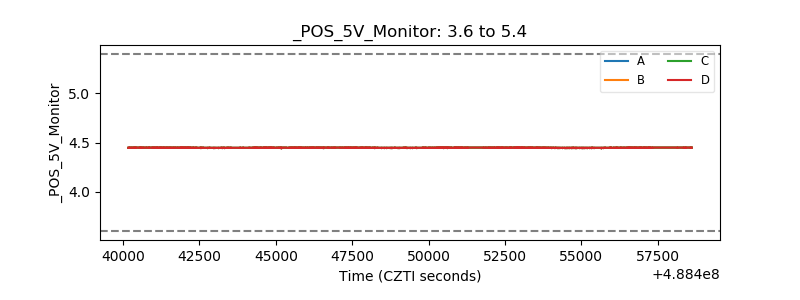 |
| _ROLL_ROT | 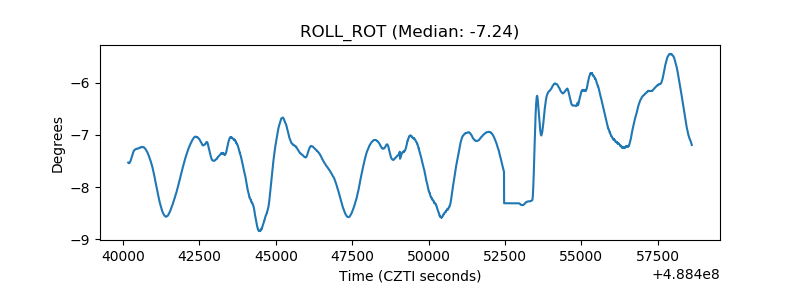 |
| _Roll_DEC | 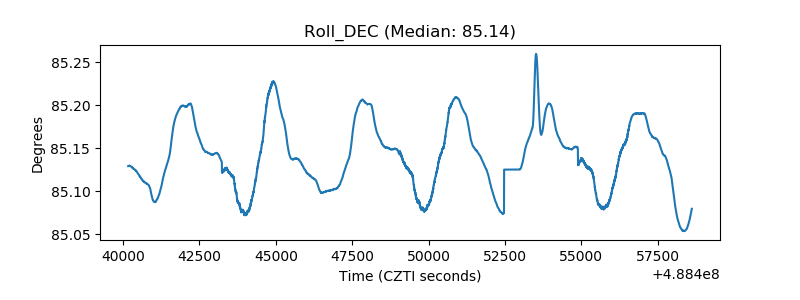 |
| _Roll_RA | 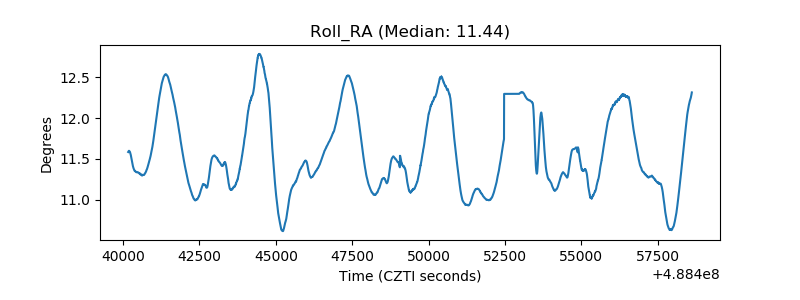 |
| Veto Counter | 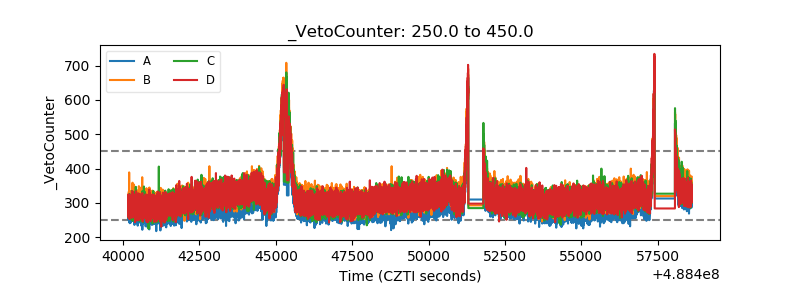 |