| Param | Original file | Final file |
|---|---|---|
| Filename | modeM0/AS1P01_140T01_9000000004cztM0_level2_bc.evt | modeM0/AS1P01_140T01_9000000004cztM0_level2_quad_clean.evt |
| Size (bytes) | 1,695,093,120 | 507,859,200 |
| Size | 1.6 GB | 484.3 MB |
| Events in quadrant A | 9,023,779 | 3,137,214 |
| Events in quadrant B | 10,681,901 | 3,169,615 |
| Events in quadrant C | 9,864,415 | 3,103,508 |
| Events in quadrant D | 18,715,342 | 2,899,614 |
| Mode M0 | |||
|---|---|---|---|
| Quadrant | BADHDUFLAG | Total packets | Discarded packets |
| A | 0 | 196685 | 0 |
| B | 0 | 197260 | 0 |
| C | 0 | 183857 | 0 |
| D | 0 | 226241 | 0 |
| Mode M9 | |||
|---|---|---|---|
| Quadrant | BADHDUFLAG | Total packets | Discarded packets |
| A | 0 | 158 | 0 |
| B | 0 | 157 | 0 |
| C | 0 | 158 | 0 |
| D | 0 | 157 | 0 |
| Mode SS | |||
|---|---|---|---|
| Quadrant | BADHDUFLAG | Total packets | Discarded packets |
| A | 0 | 922 | 0 |
| B | 0 | 914 | 0 |
| C | 0 | 916 | 0 |
| D | 0 | 918 | 0 |
| Quadrant | Total seconds | Saturated seconds | Saturation percentage |
|---|---|---|---|
| A | 44763 | 229 | 0.511583% |
| B | 44726 | 123 | 0.275008% |
| C | 44782 | 131 | 0.292528% |
| D | 44689 | 2225 | 4.978854% |
Noise dominated data is calculated using 1-second bins in cleaned event files. If a bin has >2000 counts, and if more than 50% of those come from <1% of pixels, then it is considered to be noise-dominated and hence unusable.
| Quadrant | # 1 sec bins | Bins with >0 counts | Bins with >2000 counts | High rate bins dominated by noise | Noise dominated (total time) | Noise dominated (detector-on time) | Marked lightcurve |
|---|---|---|---|---|---|---|---|
| A | 83995 | 44940 | 60 | 60 | 0.07% | 0.13% | 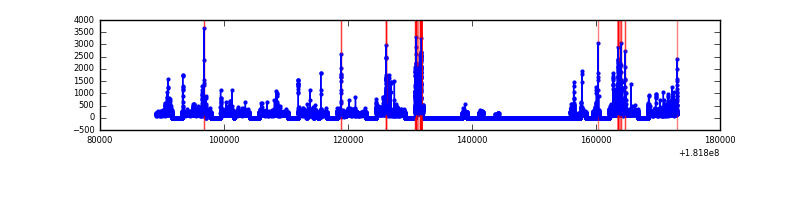 |
| B | 83995 | 44882 | 17 | 17 | 0.02% | 0.04% | 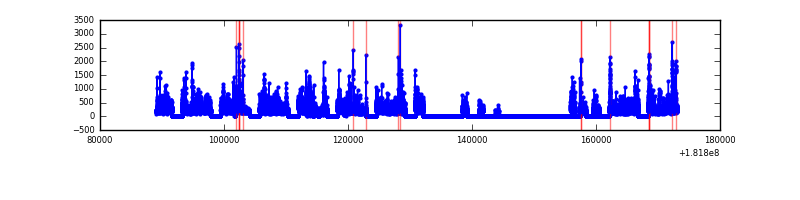 |
| C | 83995 | 44957 | 63 | 63 | 0.08% | 0.14% | 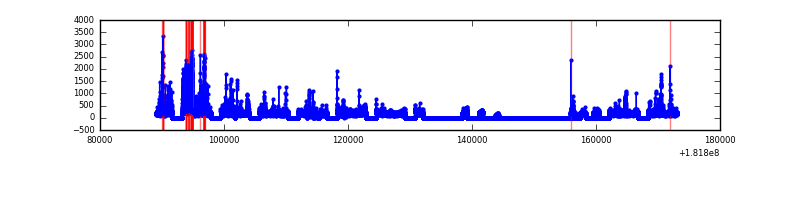 |
| D | 83995 | 44820 | 425 | 425 | 0.51% | 0.95% | 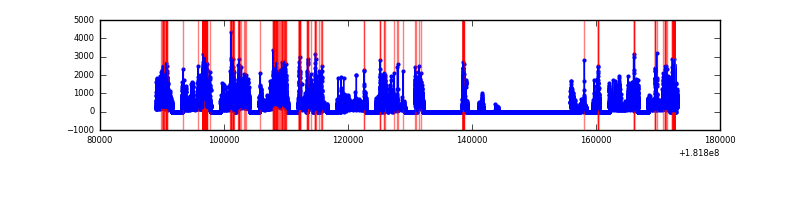 |
Top three noisy pixels from each quadrant. If the there are fewer than three noisy pixels in the level2.evt file, extra rows are filled as -1
| Pixel properties | Quadrant properties | ||||||
|---|---|---|---|---|---|---|---|
| Quadrant | DetID | PixID | Counts | Sigma | Mean | Median | Sigma |
| A | 15 | 22 | 371045 | 942.78 | 1870 | 1826 | 391.6 |
| A | 0 | 86 | 224330 | 568.15 | 1870 | 1826 | 391.6 |
| A | 13 | 17 | 134842 | 339.65 | 1870 | 1826 | 391.6 |
| B | 8 | 236 | 543806 | 1562.29 | 1922 | 1858 | 346.9 |
| B | 2 | 2 | 334792 | 959.76 | 1922 | 1858 | 346.9 |
| B | 10 | 199 | 227534 | 650.56 | 1922 | 1858 | 346.9 |
| C | 3 | 32 | 1546494 | 3873.18 | 1860 | 1828 | 398.8 |
| C | 0 | 186 | 148001 | 366.52 | 1860 | 1828 | 398.8 |
| C | 0 | 203 | 117512 | 290.07 | 1860 | 1828 | 398.8 |
| D | 0 | 243 | 2086056 | 4876.98 | 1831 | 1754 | 427.4 |
| D | 13 | 69 | 1273839 | 2976.51 | 1831 | 1754 | 427.4 |
| D | 14 | 53 | 487656 | 1136.94 | 1831 | 1754 | 427.4 |
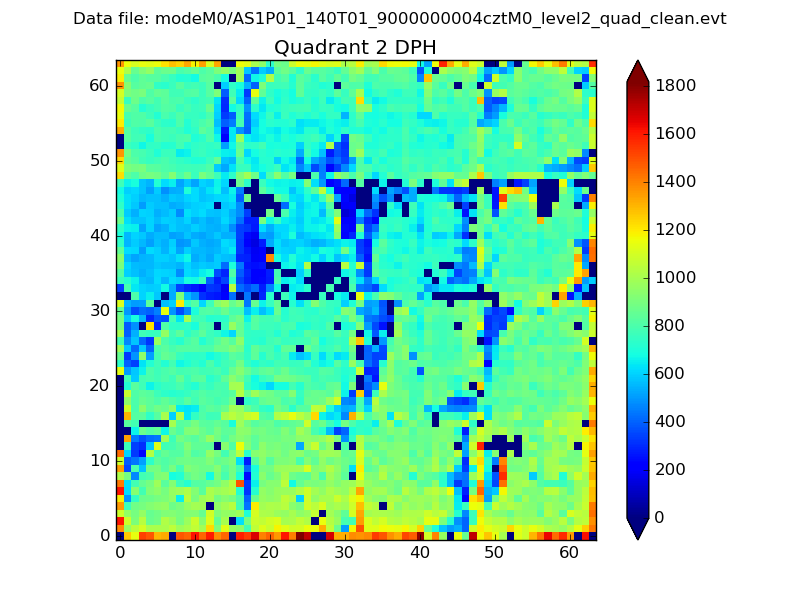
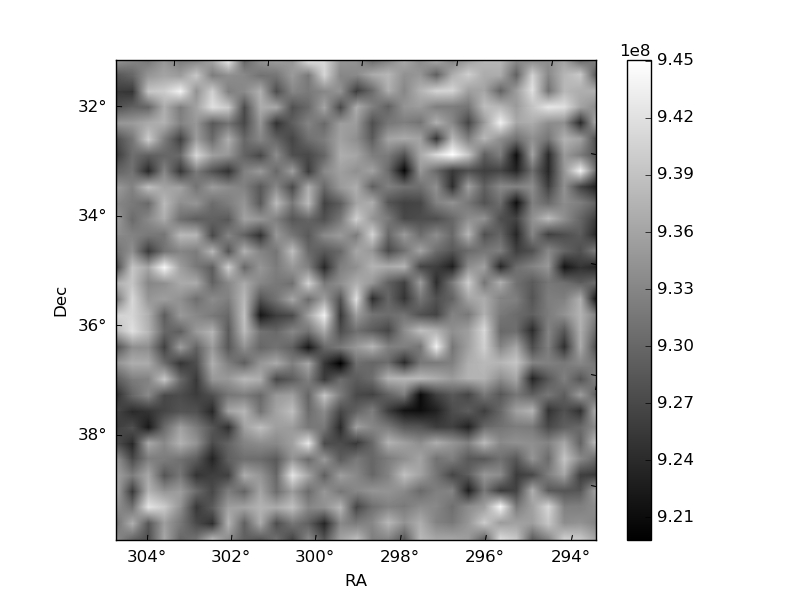
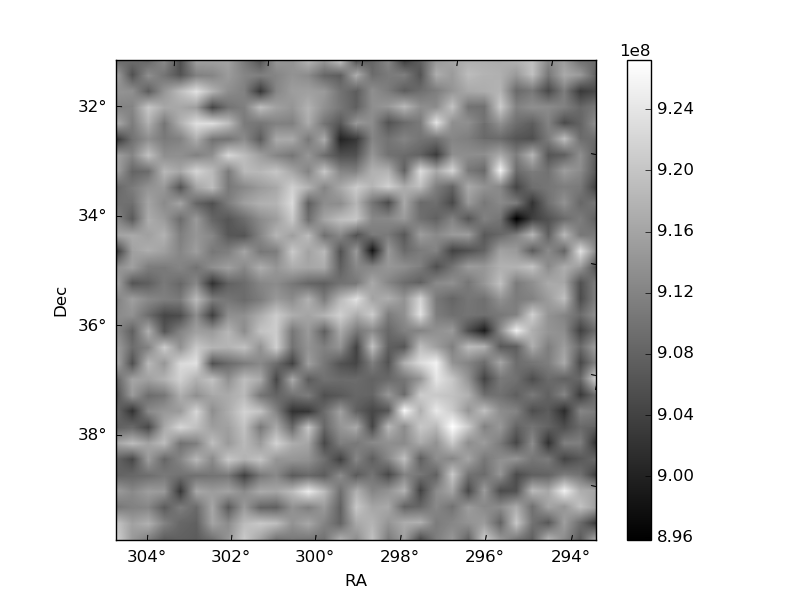
Histogram calculated using DETX and DETY for each event in the final _common_clean file
| Quadrant A | 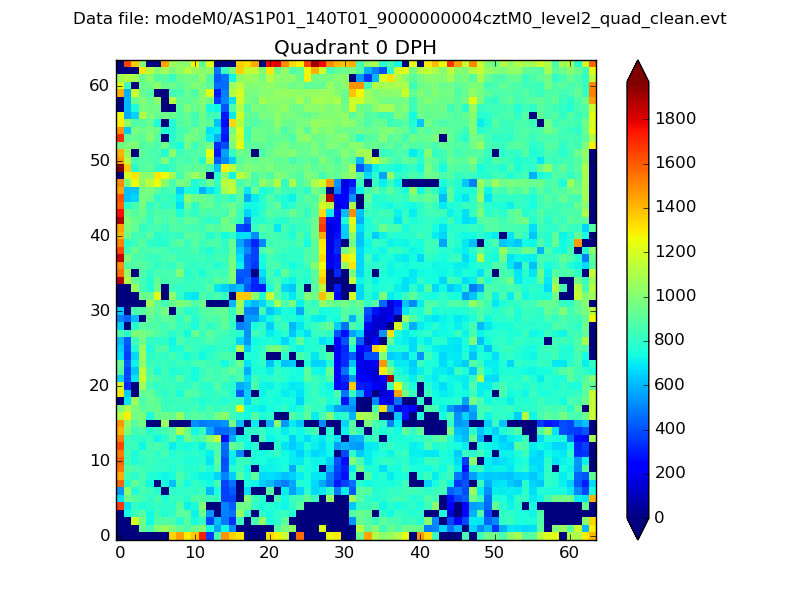 |
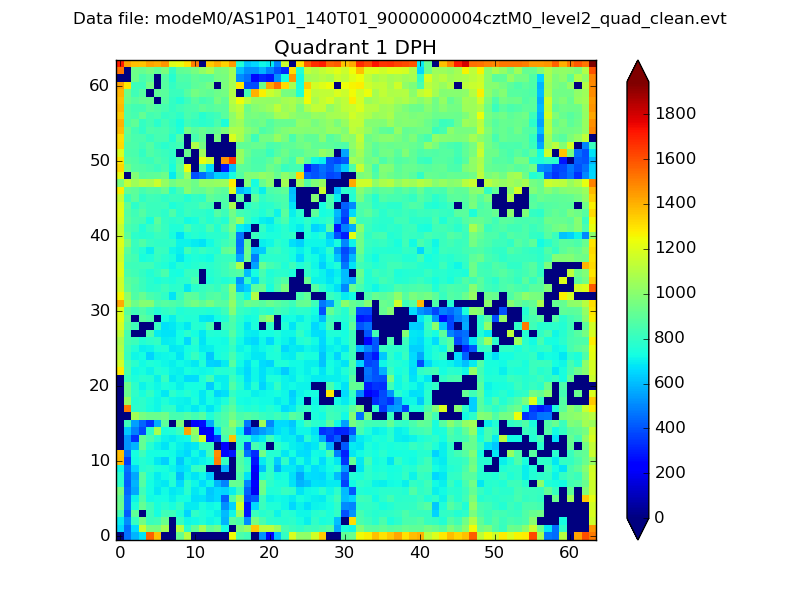 |
Quadrant B |
|---|---|---|---|
| Quadrant D | 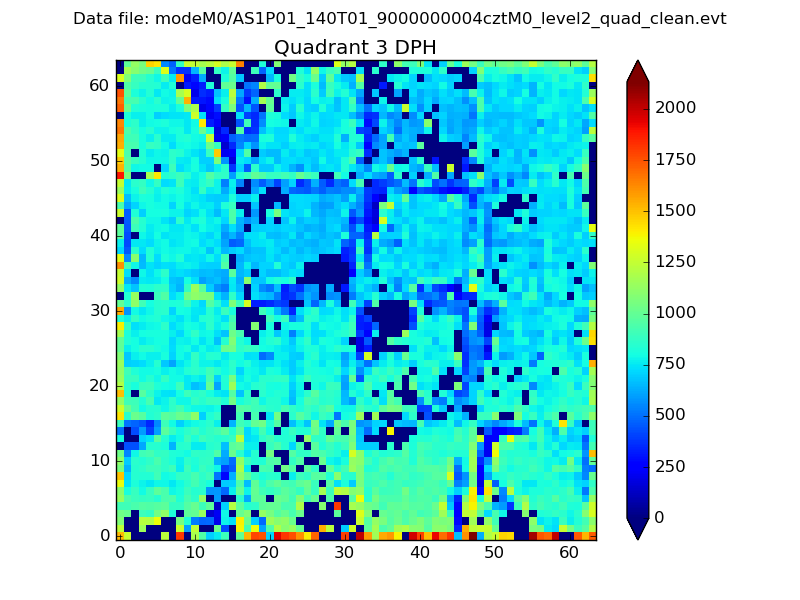 |
 |
Quadrant C |
| Plot type | Count rate plots | Images |
|---|---|---|
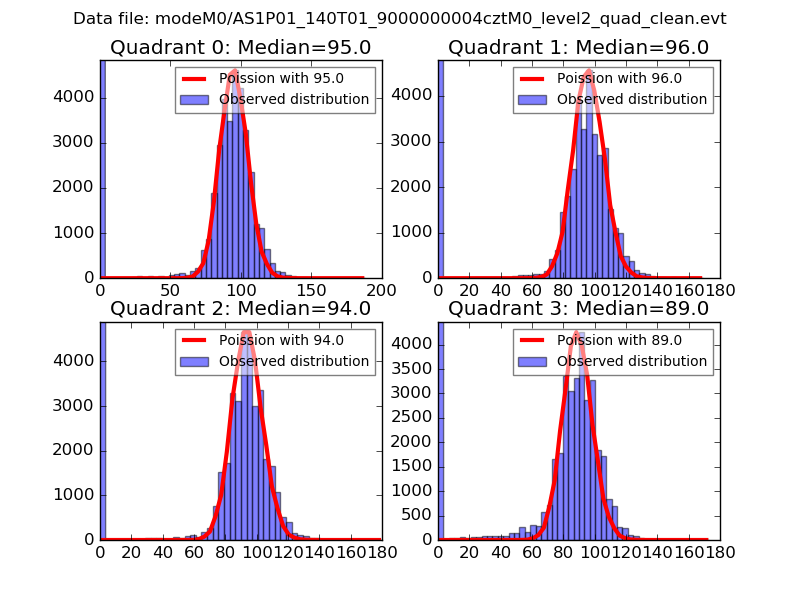
| Comparison with Poisson distribution Blue bars denote a histogram of data divided into 1 sec bins. Red curve is a Poisson curve with rate = median count rate of data. |
 |
 |
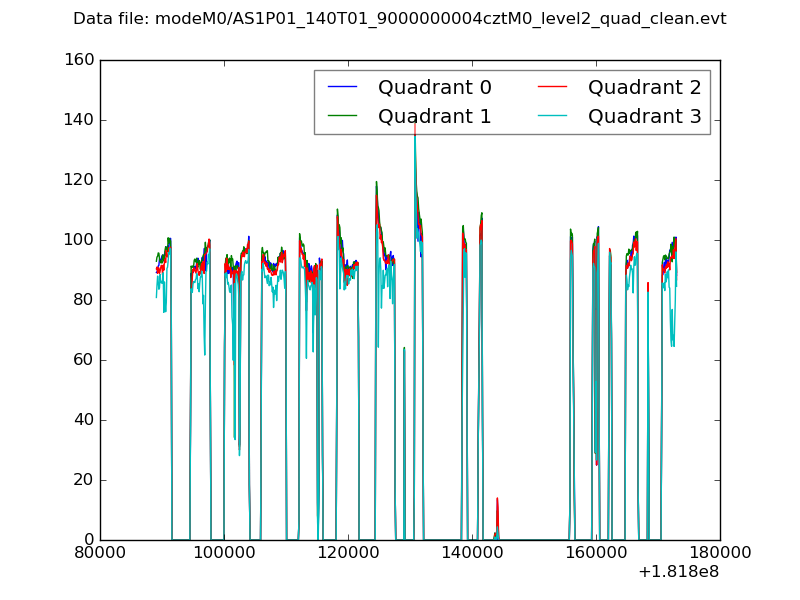
| Quadrant-wise count rates Data is divided into 100 sec bins |
 |
|
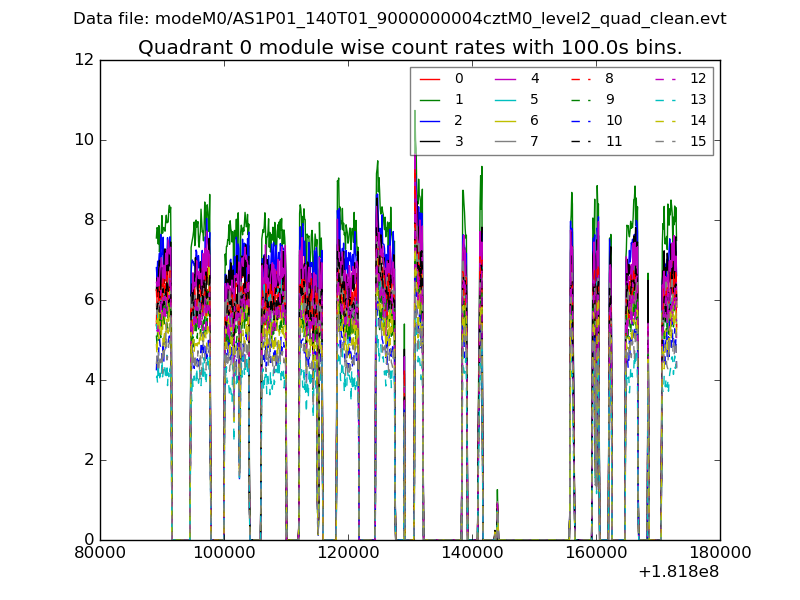
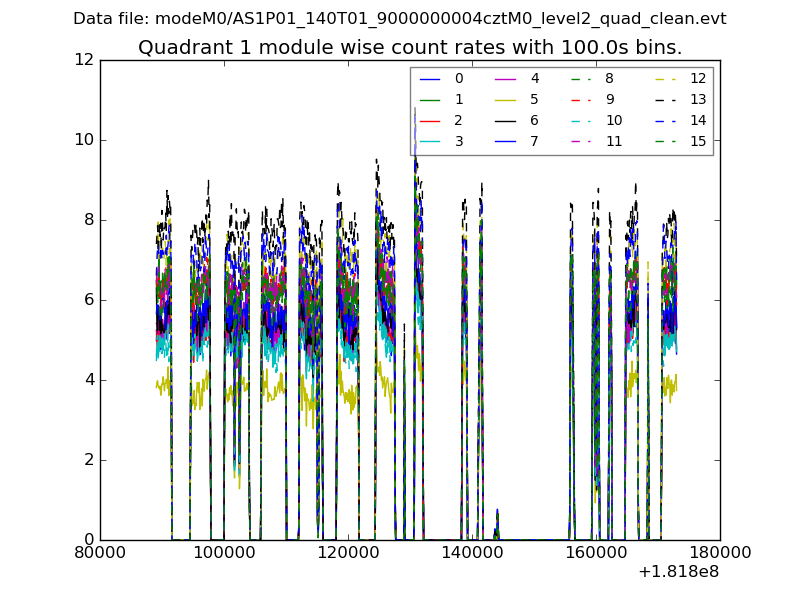
| Module-wise count rates for Quadrant A Data is divided into 100 sec bins |
 |
 |
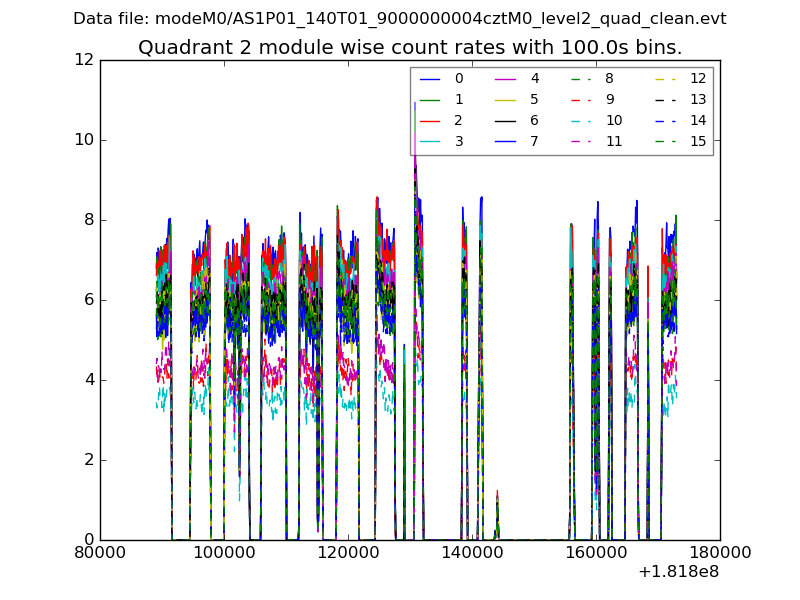
| Module-wise count rates for Quadrant B Data is divided into 100 sec bins |
 |
 |
| Module-wise count rates for Quadrant C Data is divided into 100 sec bins |
 |
 |
| Module-wise count rates for Quadrant D Data is divided into 100 sec bins |
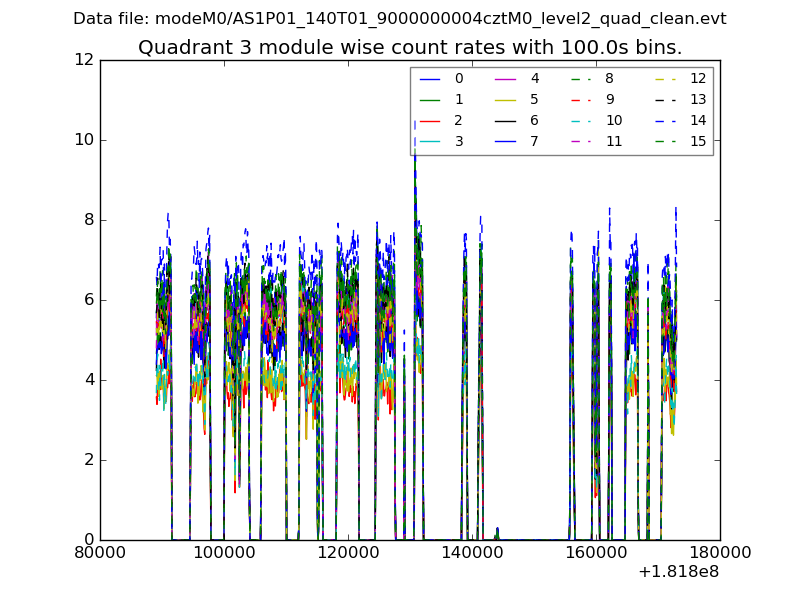 |
 |
| Parameter | Plot |
|---|---|
| CZT HV Monitor | 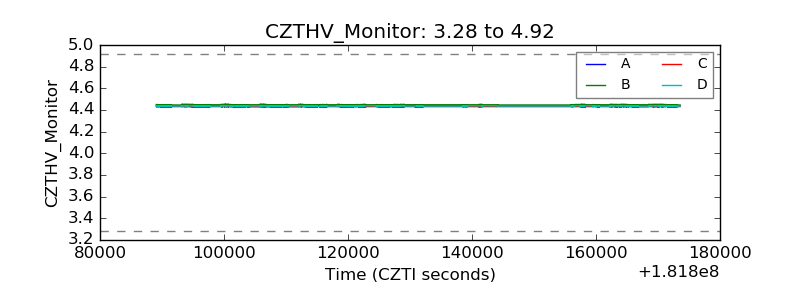 |
| D_VDD | 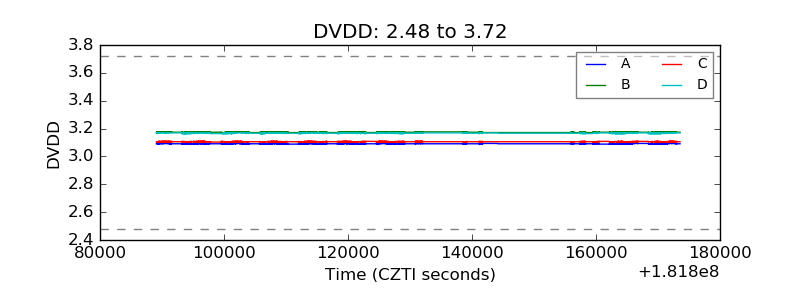 |
| Temperature 1 | 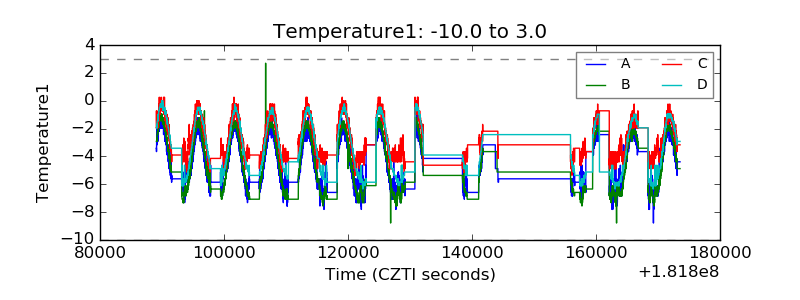 |
| Veto HV Monitor | 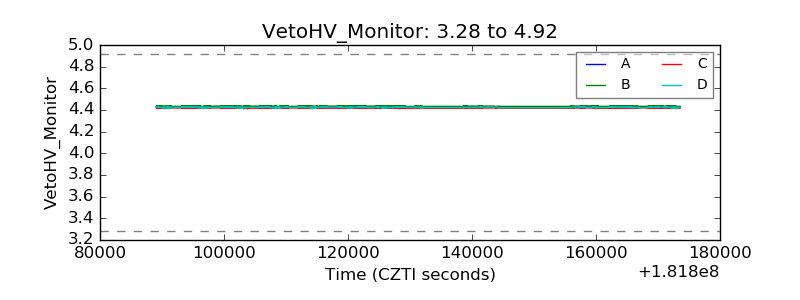 |
| Veto LLD | 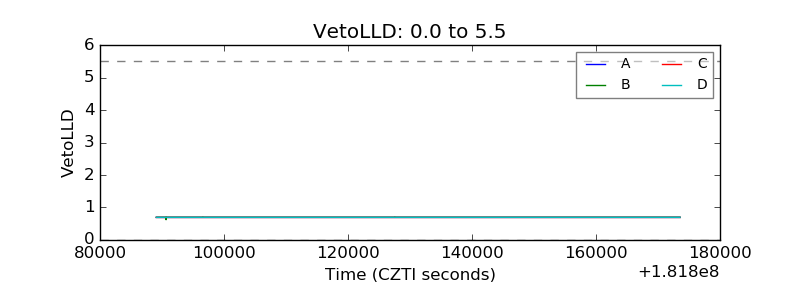 |
| Alpha Counter | 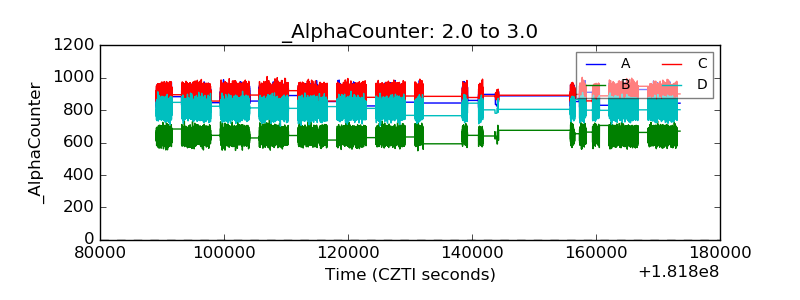 |
| _CPM_Rate | 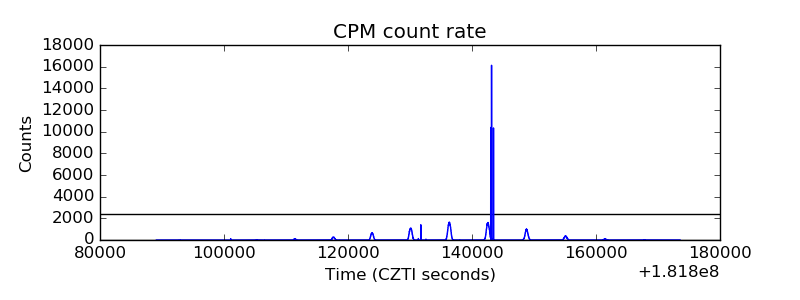 |
| CZT Counter | 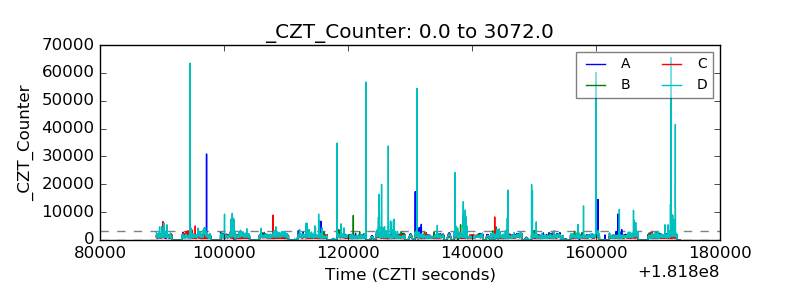 |
| +2.5 Volts monitor | 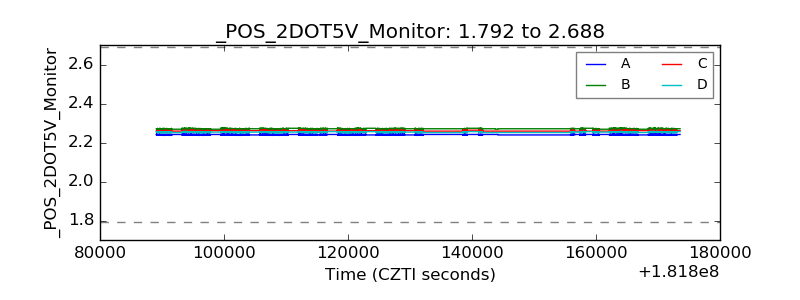 |
| +5 Volts monitor | 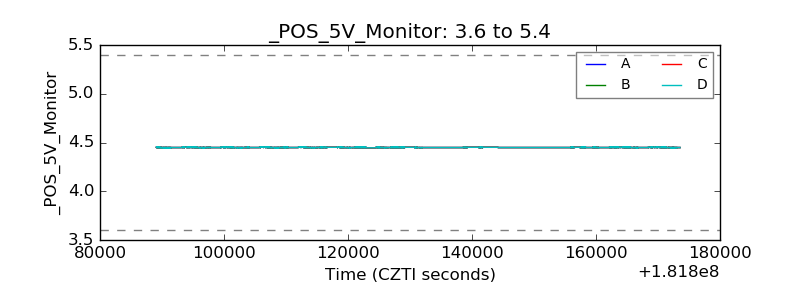 |
| _ROLL_ROT | 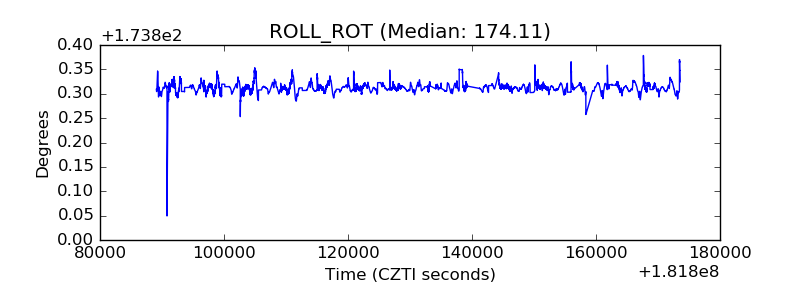 |
| _Roll_DEC | 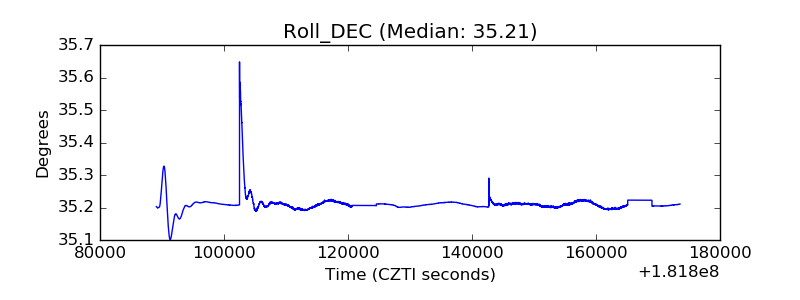 |
| _Roll_RA | 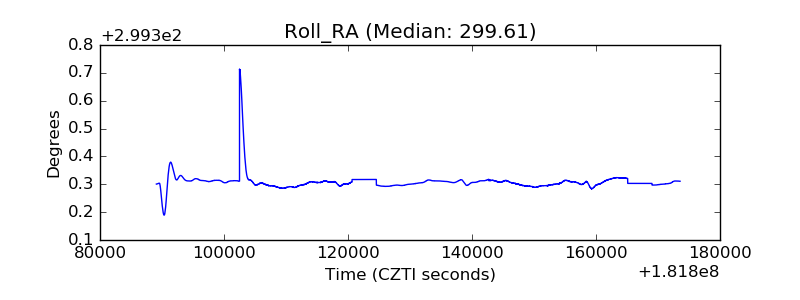 |
| Veto Counter | 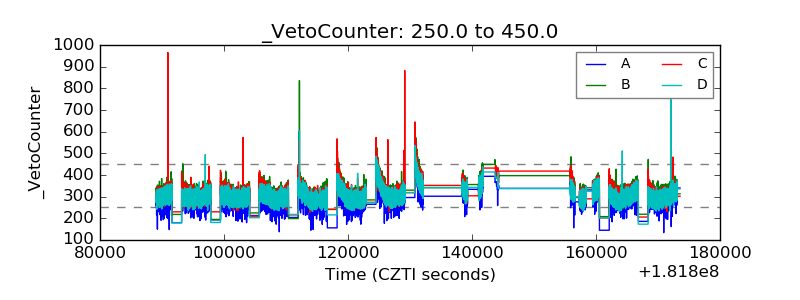 |