| Param | Original file | Final file |
|---|---|---|
| Filename | modeM0/AS1P01_134T01_9000000008cztM0_level2_bc.evt | modeM0/AS1P01_134T01_9000000008cztM0_level2_quad_clean.evt |
| Size (bytes) | 395,400,960 | 114,160,320 |
| Size | 377.1 MB | 108.9 MB |
| Events in quadrant A | 2,424,137 | 652,151 |
| Events in quadrant B | 2,896,883 | 660,088 |
| Events in quadrant C | 2,286,764 | 654,646 |
| Events in quadrant D | 3,521,492 | 639,884 |
| Mode SS | |||
|---|---|---|---|
| Quadrant | BADHDUFLAG | Total packets | Discarded packets |
| A | 0 | 248 | 0 |
| B | 0 | 248 | 0 |
| C | 0 | 248 | 0 |
| D | 0 | 248 | 0 |
| Mode M0 | |||
|---|---|---|---|
| Quadrant | BADHDUFLAG | Total packets | Discarded packets |
| A | 0 | 53176 | 0 |
| B | 0 | 55065 | 0 |
| C | 0 | 50156 | 0 |
| D | 0 | 53543 | 0 |
| Mode M9 | |||
|---|---|---|---|
| Quadrant | BADHDUFLAG | Total packets | Discarded packets |
| A | 0 | 33 | 0 |
| B | 0 | 33 | 0 |
| C | 0 | 33 | 0 |
| D | 0 | 33 | 0 |
| Quadrant | Total seconds | Saturated seconds | Saturation percentage |
|---|---|---|---|
| A | 12305 | 44 | 0.357578% |
| B | 12305 | 157 | 1.275904% |
| C | 12305 | 15 | 0.121902% |
| D | 12305 | 356 | 2.893133% |
Noise dominated data is calculated using 1-second bins in cleaned event files. If a bin has >2000 counts, and if more than 50% of those come from <1% of pixels, then it is considered to be noise-dominated and hence unusable.
| Quadrant | # 1 sec bins | Bins with >0 counts | Bins with >2000 counts | High rate bins dominated by noise | Noise dominated (total time) | Noise dominated (detector-on time) | Marked lightcurve |
|---|---|---|---|---|---|---|---|
| A | 15517 | 12305 | 12 | 12 | 0.08% | 0.10% |  |
| B | 15517 | 12305 | 28 | 28 | 0.18% | 0.23% |  |
| C | 15517 | 12305 | 2 | 2 | 0.01% | 0.02% |  |
| D | 15517 | 12305 | 15 | 15 | 0.10% | 0.12% |  |
Top three noisy pixels from each quadrant. If the there are fewer than three noisy pixels in the level2.evt file, extra rows are filled as -1
| Pixel properties | Quadrant properties | ||||||
|---|---|---|---|---|---|---|---|
| Quadrant | DetID | PixID | Counts | Sigma | Mean | Median | Sigma |
| A | 0 | 96 | 157879 | 1436.33 | 521 | 509 | 109.6 |
| A | 14 | 171 | 46987 | 424.21 | 521 | 509 | 109.6 |
| A | 14 | 10 | 34551 | 310.7 | 521 | 509 | 109.6 |
| B | 10 | 199 | 252709 | 2574.11 | 534 | 518 | 98.0 |
| B | 8 | 5 | 227239 | 2314.14 | 534 | 518 | 98.0 |
| B | 5 | 216 | 157090 | 1598.13 | 534 | 518 | 98.0 |
| C | 0 | 186 | 44031 | 388.98 | 518 | 508 | 111.9 |
| C | 8 | 31 | 42278 | 373.31 | 518 | 508 | 111.9 |
| C | 0 | 202 | 35467 | 312.44 | 518 | 508 | 111.9 |
| D | 2 | 121 | 599660 | 4926.9 | 510 | 493 | 121.6 |
| D | 13 | 223 | 141805 | 1162.0 | 510 | 493 | 121.6 |
| D | 7 | 87 | 56653 | 461.8 | 510 | 493 | 121.6 |
Histogram calculated using DETX and DETY for each event in the final _common_clean file
| Quadrant A | 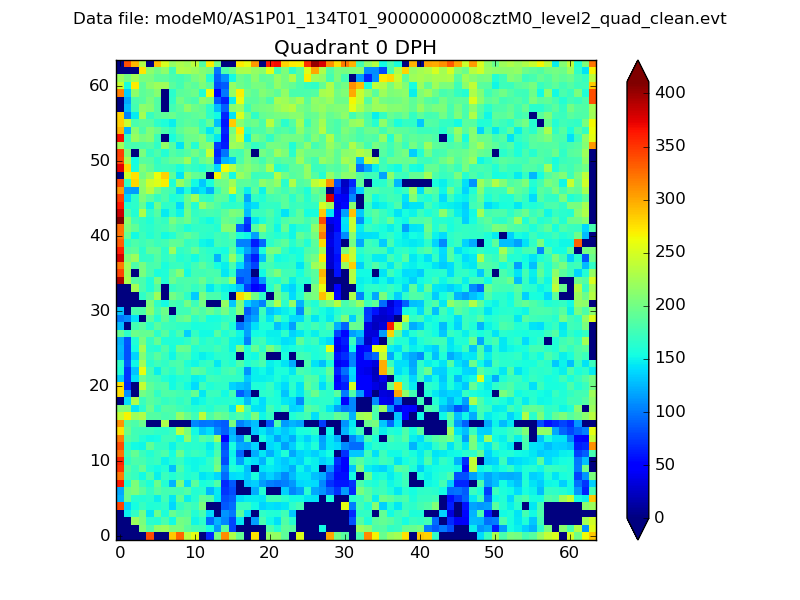 |
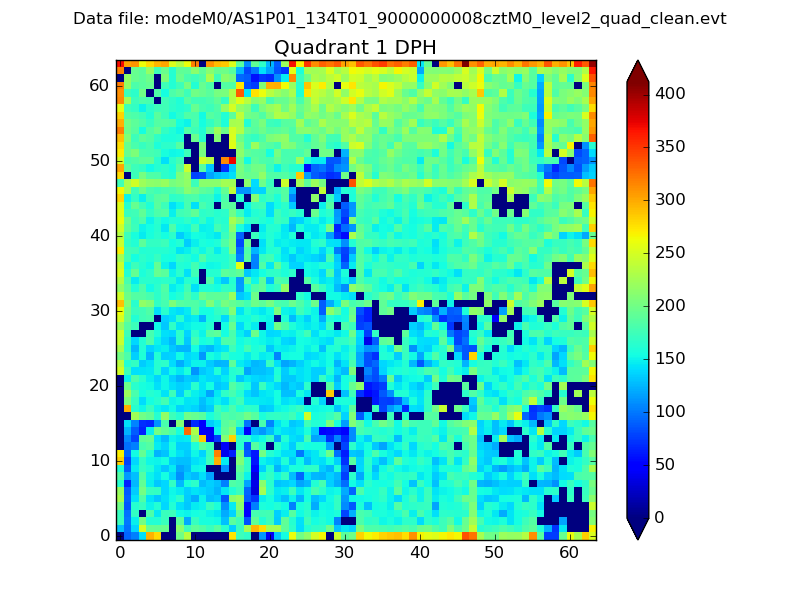 |
Quadrant B |
|---|---|---|---|
| Quadrant D |  |
 |
Quadrant C |
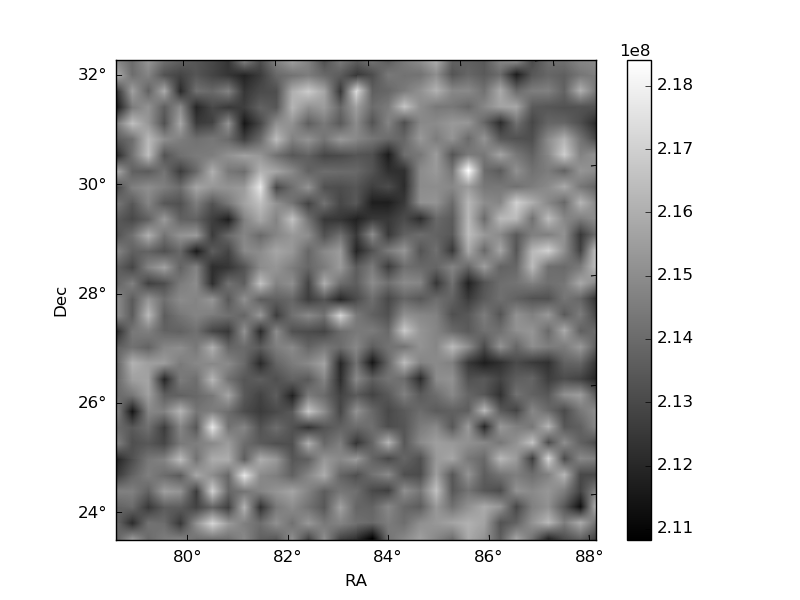
| Plot type | Count rate plots | Images |
|---|---|---|
| Comparison with Poisson distribution Blue bars denote a histogram of data divided into 1 sec bins. Red curve is a Poisson curve with rate = median count rate of data. |
 |
 |
| Quadrant-wise count rates Data is divided into 100 sec bins |
 |
|
| Module-wise count rates for Quadrant A Data is divided into 100 sec bins |
 |
 |
| Module-wise count rates for Quadrant B Data is divided into 100 sec bins |
 |
 |
| Module-wise count rates for Quadrant C Data is divided into 100 sec bins |
 |
 |
| Module-wise count rates for Quadrant D Data is divided into 100 sec bins |
 |
 |
| Parameter | Plot |
|---|---|
| CZT HV Monitor | 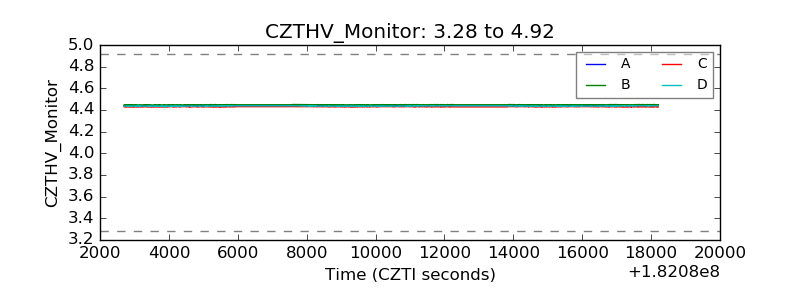 |
| D_VDD |  |
| Temperature 1 |  |
| Veto HV Monitor |  |
| Veto LLD | 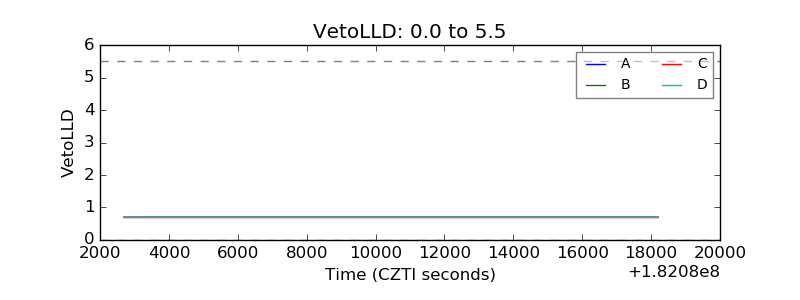 |
| Alpha Counter |  |
| _CPM_Rate | 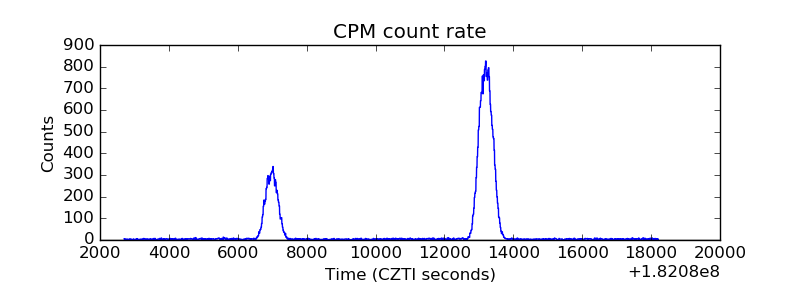 |
| CZT Counter | 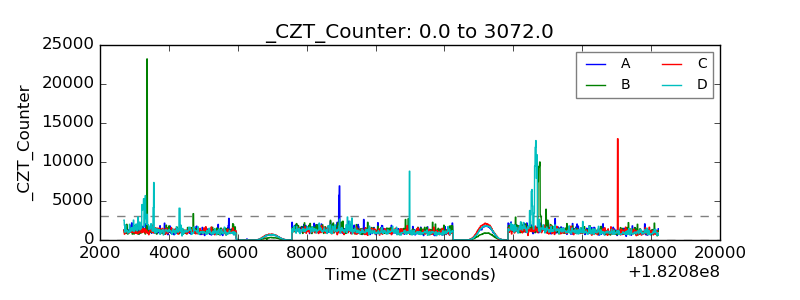 |
| +2.5 Volts monitor |  |
| +5 Volts monitor |  |
| _ROLL_ROT | 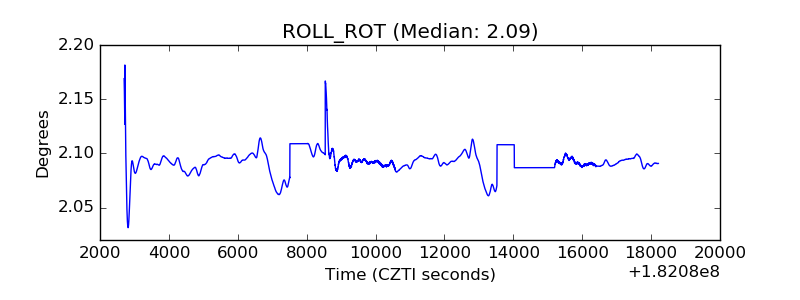 |
| _Roll_DEC | 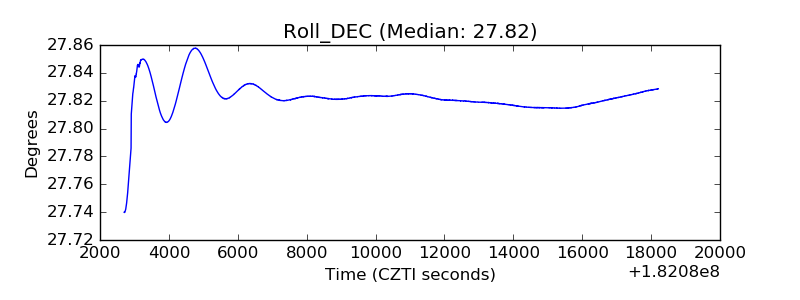 |
| _Roll_RA |  |
| Veto Counter |  |