| Param | Original file | Final file |
|---|---|---|
| Filename | modeM0/AS1P01_120T01_9000000016cztM0_level2_bc.evt | modeM0/AS1P01_120T01_9000000016cztM0_level2_quad_clean.evt |
| Size (bytes) | 871,404,480 | 276,960,960 |
| Size | 831.0 MB | 264.1 MB |
| Events in quadrant A | 4,113,743 | 1,753,539 |
| Events in quadrant B | 7,485,685 | 1,781,218 |
| Events in quadrant C | 4,140,182 | 1,791,441 |
| Events in quadrant D | 9,287,444 | 1,688,734 |
| Mode M0 | |||
|---|---|---|---|
| Quadrant | BADHDUFLAG | Total packets | Discarded packets |
| A | 0 | 85609 | 0 |
| B | 0 | 95049 | 0 |
| C | 0 | 81190 | 0 |
| D | 0 | 94688 | 0 |
| Mode M9 | |||
|---|---|---|---|
| Quadrant | BADHDUFLAG | Total packets | Discarded packets |
| A | 0 | 65 | 0 |
| B | 0 | 65 | 0 |
| C | 0 | 65 | 0 |
| D | 0 | 65 | 0 |
| Mode SS | |||
|---|---|---|---|
| Quadrant | BADHDUFLAG | Total packets | Discarded packets |
| A | 0 | 418 | 0 |
| B | 0 | 414 | 0 |
| C | 0 | 412 | 0 |
| D | 0 | 414 | 0 |
| Quadrant | Total seconds | Saturated seconds | Saturation percentage |
|---|---|---|---|
| A | 19941 | 13 | 0.065192% |
| B | 19923 | 1034 | 5.189981% |
| C | 19944 | 27 | 0.135379% |
| D | 19915 | 764 | 3.836304% |
Noise dominated data is calculated using 1-second bins in cleaned event files. If a bin has >2000 counts, and if more than 50% of those come from <1% of pixels, then it is considered to be noise-dominated and hence unusable.
| Quadrant | # 1 sec bins | Bins with >0 counts | Bins with >2000 counts | High rate bins dominated by noise | Noise dominated (total time) | Noise dominated (detector-on time) | Marked lightcurve |
|---|---|---|---|---|---|---|---|
| A | 48132 | 20071 | 0 | 0 | 0.00% | 0.00% |  |
| B | 48132 | 20057 | 561 | 561 | 1.17% | 2.80% |  |
| C | 48132 | 20074 | 3 | 3 | 0.01% | 0.01% |  |
| D | 48132 | 20043 | 499 | 499 | 1.04% | 2.49% | 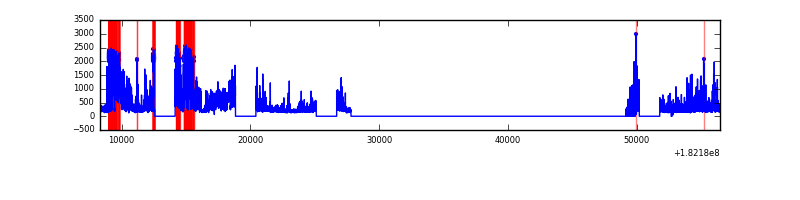 |
Top three noisy pixels from each quadrant. If the there are fewer than three noisy pixels in the level2.evt file, extra rows are filled as -1
| Pixel properties | Quadrant properties | ||||||
|---|---|---|---|---|---|---|---|
| Quadrant | DetID | PixID | Counts | Sigma | Mean | Median | Sigma |
| A | 13 | 145 | 75974 | 375.21 | 946 | 932 | 200.0 |
| A | 13 | 17 | 58835 | 289.52 | 946 | 932 | 200.0 |
| A | 15 | 127 | 44939 | 220.04 | 946 | 932 | 200.0 |
| B | 0 | 247 | 3404812 | 20374.76 | 959 | 937 | 167.1 |
| B | 8 | 5 | 50044 | 293.94 | 959 | 937 | 167.1 |
| B | 0 | 217 | 40869 | 239.02 | 959 | 937 | 167.1 |
| C | 0 | 202 | 145321 | 710.49 | 951 | 943 | 203.2 |
| C | 1 | 192 | 98634 | 480.74 | 951 | 943 | 203.2 |
| C | 10 | 33 | 38083 | 182.77 | 951 | 943 | 203.2 |
| D | 12 | 249 | 4156031 | 19762.23 | 924 | 902 | 210.3 |
| D | 1 | 4 | 141900 | 670.6 | 924 | 902 | 210.3 |
| D | 10 | 229 | 120532 | 568.97 | 924 | 902 | 210.3 |
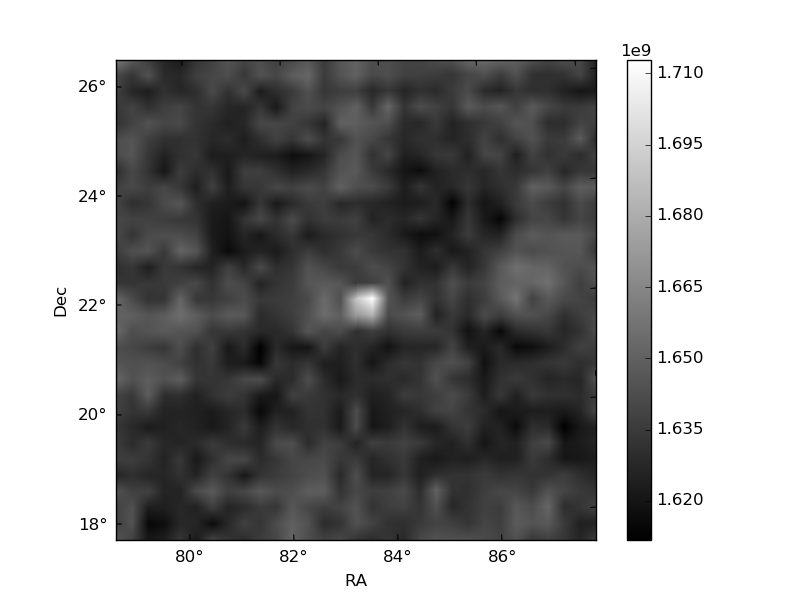
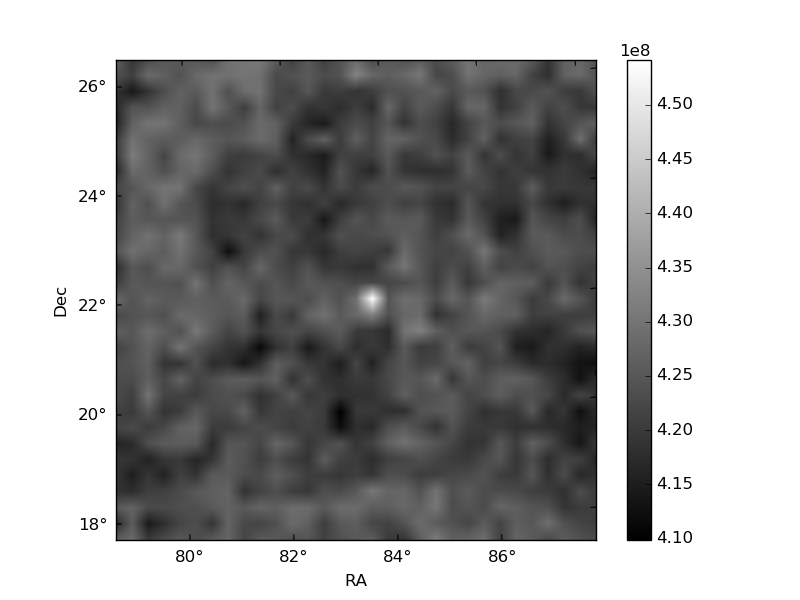
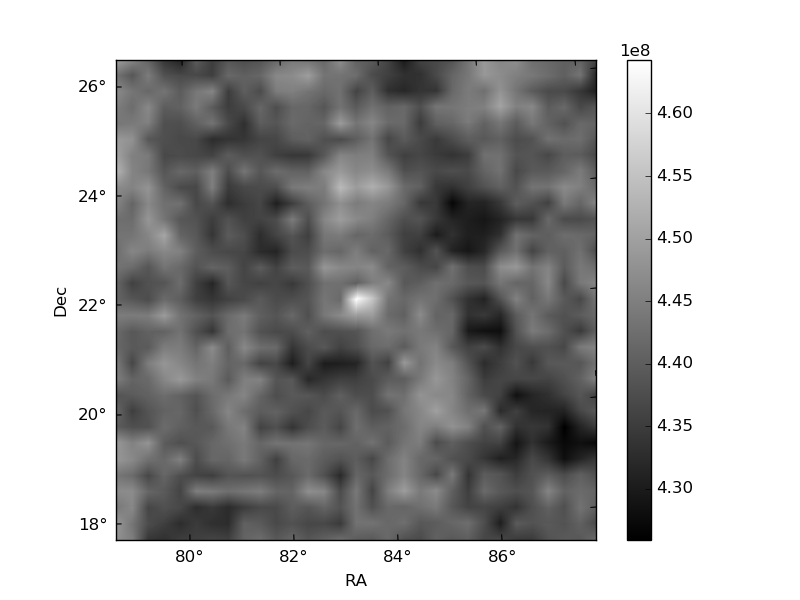
Histogram calculated using DETX and DETY for each event in the final _common_clean file
| Quadrant A | 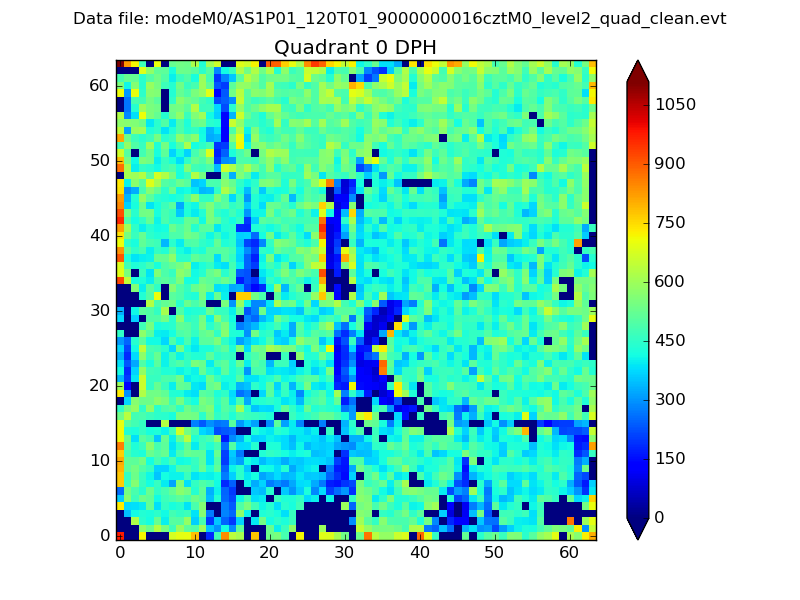 |
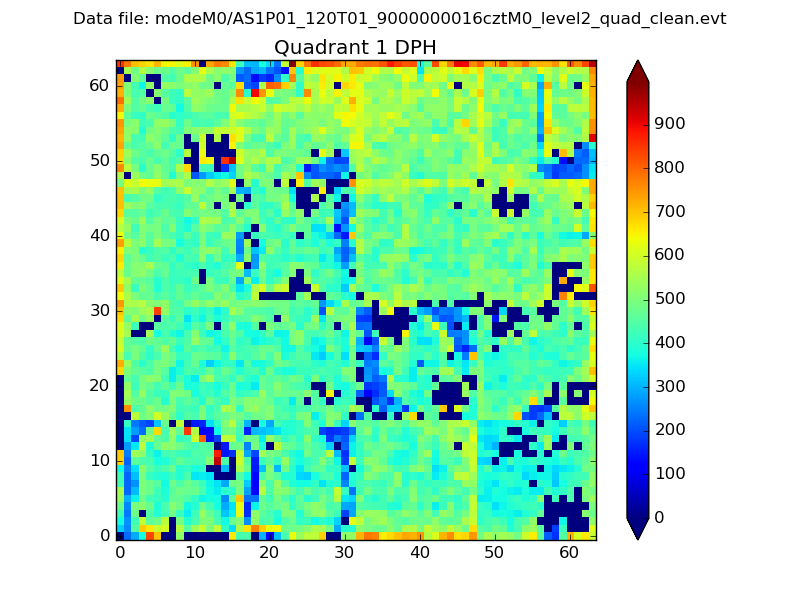 |
Quadrant B |
|---|---|---|---|
| Quadrant D |  |
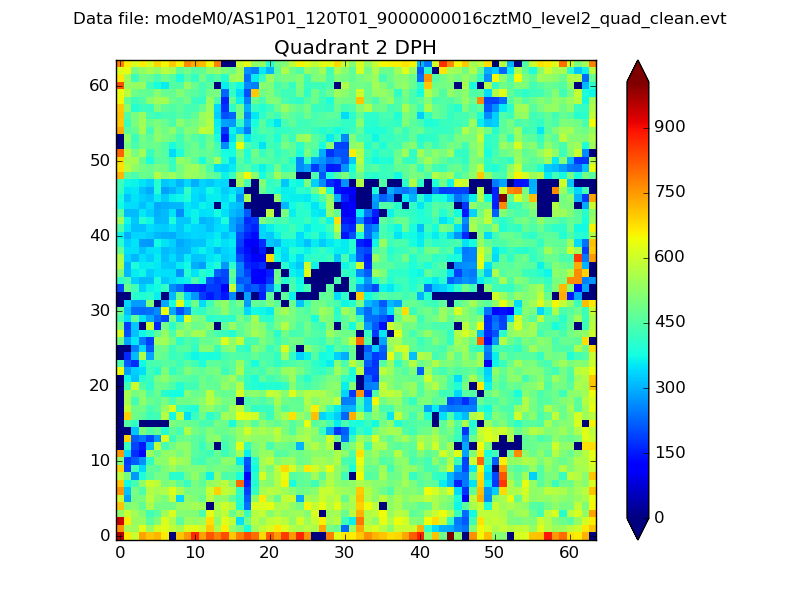 |
Quadrant C |
| Plot type | Count rate plots | Images |
|---|---|---|
| Comparison with Poisson distribution Blue bars denote a histogram of data divided into 1 sec bins. Red curve is a Poisson curve with rate = median count rate of data. |
 |
 |
| Quadrant-wise count rates Data is divided into 100 sec bins |
 |
|
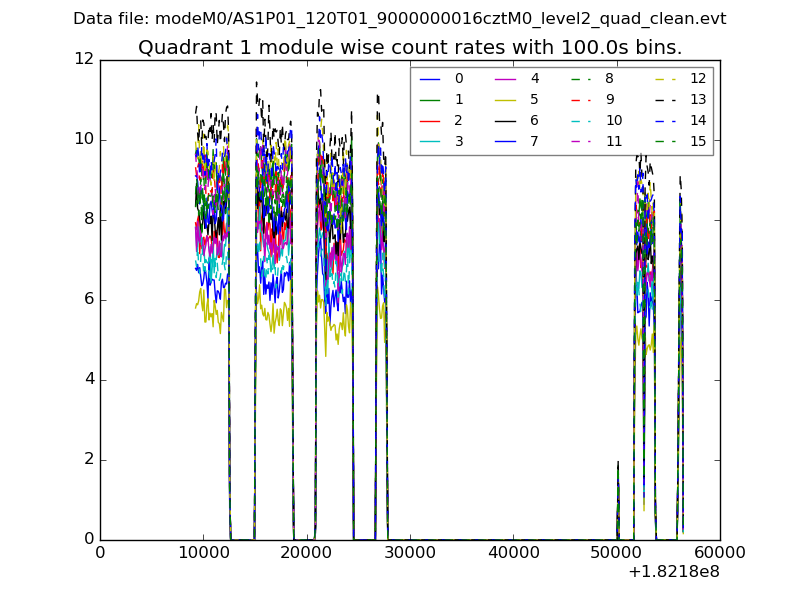
| Module-wise count rates for Quadrant A Data is divided into 100 sec bins |
 |
 |
| Module-wise count rates for Quadrant B Data is divided into 100 sec bins |
 |
 |
| Module-wise count rates for Quadrant C Data is divided into 100 sec bins |
 |
 |
| Module-wise count rates for Quadrant D Data is divided into 100 sec bins |
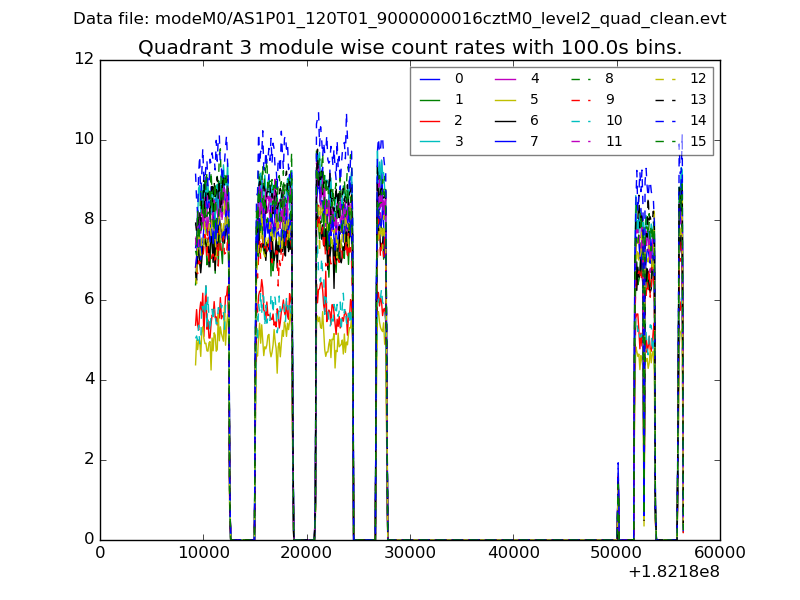 |
 |
| Parameter | Plot |
|---|---|
| CZT HV Monitor |  |
| D_VDD |  |
| Temperature 1 |  |
| Veto HV Monitor |  |
| Veto LLD | 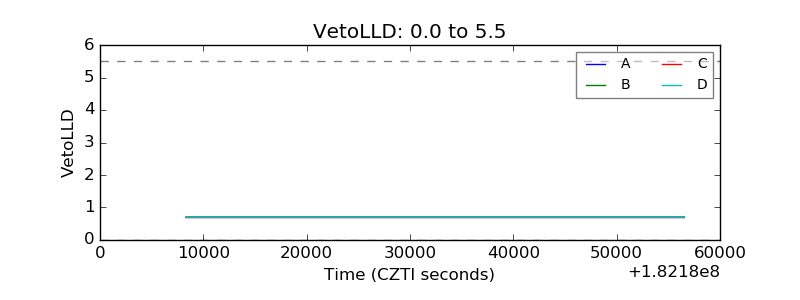 |
| Alpha Counter |  |
| _CPM_Rate |  |
| CZT Counter |  |
| +2.5 Volts monitor |  |
| +5 Volts monitor |  |
| _ROLL_ROT | 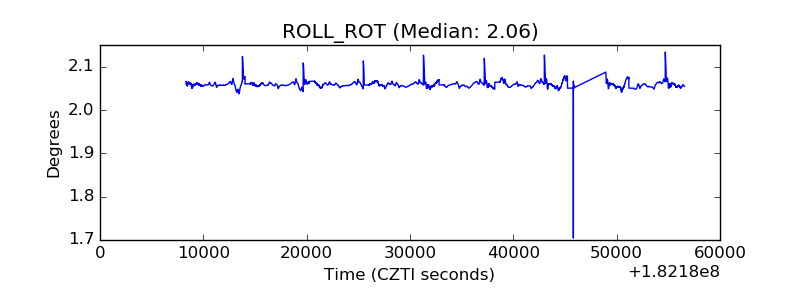 |
| _Roll_DEC |  |
| _Roll_RA |  |
| Veto Counter |  |