| Param | Original file | Final file |
|---|---|---|
| Filename | modeM0/AS1P01_118T01_9000000020cztM0_level2_bc.evt | modeM0/AS1P01_118T01_9000000020cztM0_level2_quad_clean.evt |
| Size (bytes) | 977,613,120 | 312,523,200 |
| Size | 932.3 MB | 298.0 MB |
| Events in quadrant A | 11,423,645 | 1,914,918 |
| Events in quadrant B | 5,209,646 | 1,961,477 |
| Events in quadrant C | 4,556,410 | 1,952,971 |
| Events in quadrant D | 6,678,231 | 1,884,244 |
| Mode M0 | |||
|---|---|---|---|
| Quadrant | BADHDUFLAG | Total packets | Discarded packets |
| A | 0 | 129804 | 0 |
| B | 0 | 108602 | 0 |
| C | 0 | 100477 | 0 |
| D | 0 | 104056 | 0 |
| Mode M9 | |||
|---|---|---|---|
| Quadrant | BADHDUFLAG | Total packets | Discarded packets |
| A | 0 | 107 | 0 |
| B | 0 | 107 | 0 |
| C | 0 | 107 | 0 |
| D | 0 | 107 | 0 |
| Mode SS | |||
|---|---|---|---|
| Quadrant | BADHDUFLAG | Total packets | Discarded packets |
| A | 0 | 528 | 0 |
| B | 0 | 528 | 0 |
| C | 0 | 528 | 0 |
| D | 0 | 528 | 0 |
| Quadrant | Total seconds | Saturated seconds | Saturation percentage |
|---|---|---|---|
| A | 25512 | 654 | 2.563500% |
| B | 25464 | 48 | 0.188501% |
| C | 25512 | 61 | 0.239103% |
| D | 25389 | 87 | 0.342668% |
Noise dominated data is calculated using 1-second bins in cleaned event files. If a bin has >2000 counts, and if more than 50% of those come from <1% of pixels, then it is considered to be noise-dominated and hence unusable.
| Quadrant | # 1 sec bins | Bins with >0 counts | Bins with >2000 counts | High rate bins dominated by noise | Noise dominated (total time) | Noise dominated (detector-on time) | Marked lightcurve |
|---|---|---|---|---|---|---|---|
| A | 36311 | 25511 | 251 | 251 | 0.69% | 0.98% | 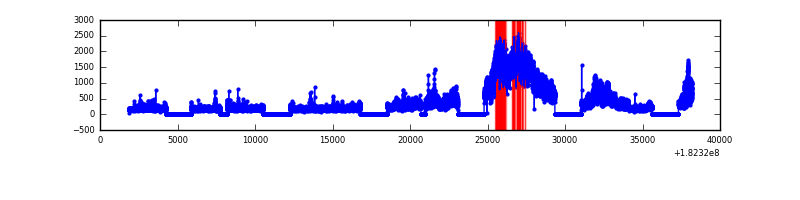 |
| B | 36311 | 25464 | 6 | 6 | 0.02% | 0.02% | 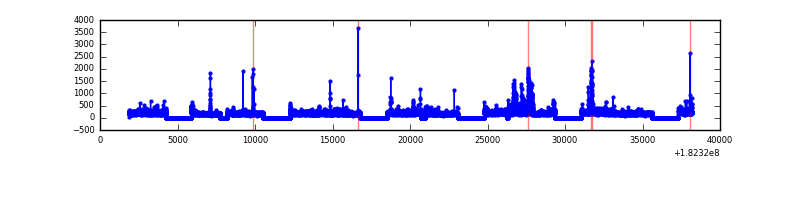 |
| C | 36310 | 25509 | 0 | 0 | 0.00% | 0.00% |  |
| D | 36311 | 25391 | 22 | 22 | 0.06% | 0.09% |  |
Top three noisy pixels from each quadrant. If the there are fewer than three noisy pixels in the level2.evt file, extra rows are filled as -1
| Pixel properties | Quadrant properties | ||||||
|---|---|---|---|---|---|---|---|
| Quadrant | DetID | PixID | Counts | Sigma | Mean | Median | Sigma |
| A | 15 | 127 | 6916184 | 30648.83 | 1073 | 1049 | 225.6 |
| A | 0 | 253 | 81317 | 355.76 | 1073 | 1049 | 225.6 |
| A | 12 | 189 | 37295 | 160.65 | 1073 | 1049 | 225.6 |
| B | 14 | 50 | 346517 | 1699.95 | 1105 | 1068 | 203.2 |
| B | 5 | 46 | 145617 | 711.32 | 1105 | 1068 | 203.2 |
| B | 0 | 183 | 64568 | 312.48 | 1105 | 1068 | 203.2 |
| C | 0 | 186 | 111183 | 485.53 | 1067 | 1044 | 226.8 |
| C | 1 | 1 | 71286 | 309.65 | 1067 | 1044 | 226.8 |
| C | 3 | 159 | 68198 | 296.04 | 1067 | 1044 | 226.8 |
| D | 1 | 4 | 910108 | 3796.85 | 1062 | 1027 | 239.4 |
| D | 13 | 117 | 139126 | 576.78 | 1062 | 1027 | 239.4 |
| D | 1 | 5 | 118677 | 491.38 | 1062 | 1027 | 239.4 |
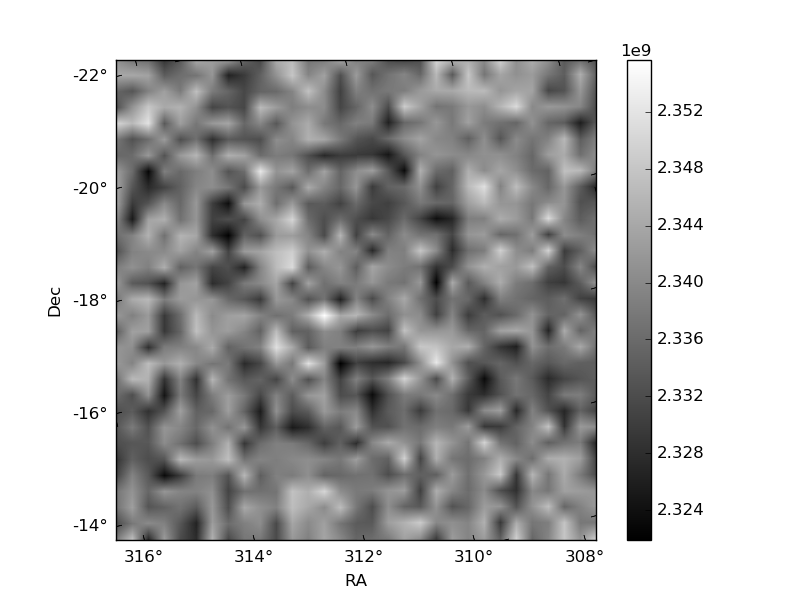
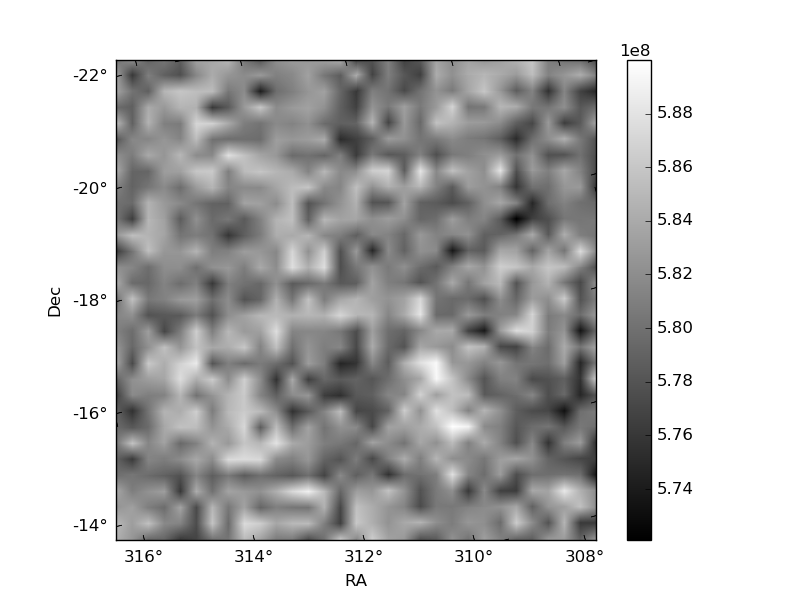
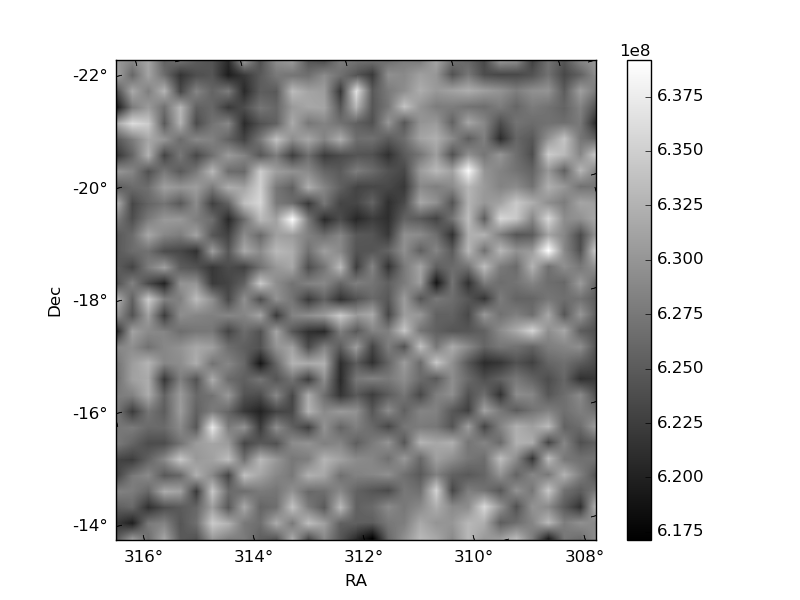
Histogram calculated using DETX and DETY for each event in the final _common_clean file
| Quadrant A |  |
 |
Quadrant B |
|---|---|---|---|
| Quadrant D | 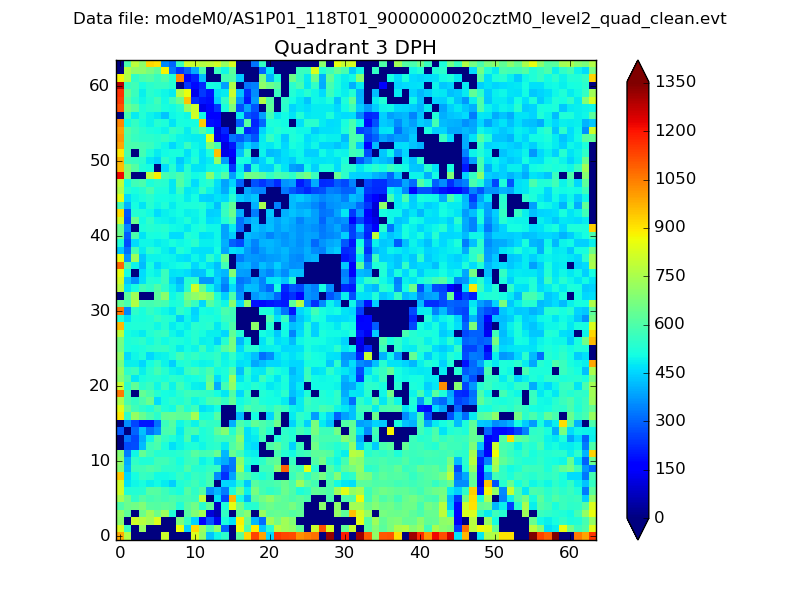 |
 |
Quadrant C |
| Plot type | Count rate plots | Images |
|---|---|---|
| Comparison with Poisson distribution Blue bars denote a histogram of data divided into 1 sec bins. Red curve is a Poisson curve with rate = median count rate of data. |
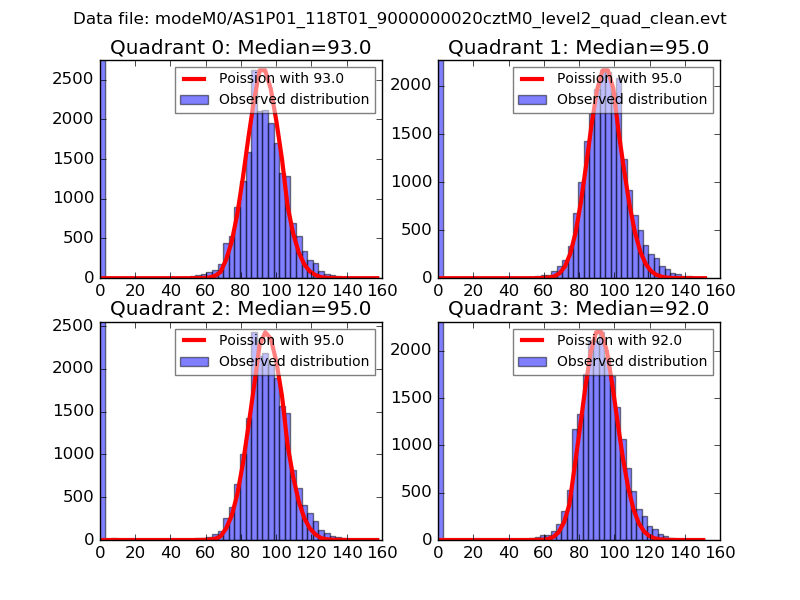 |
 |
| Quadrant-wise count rates Data is divided into 100 sec bins |
 |
|
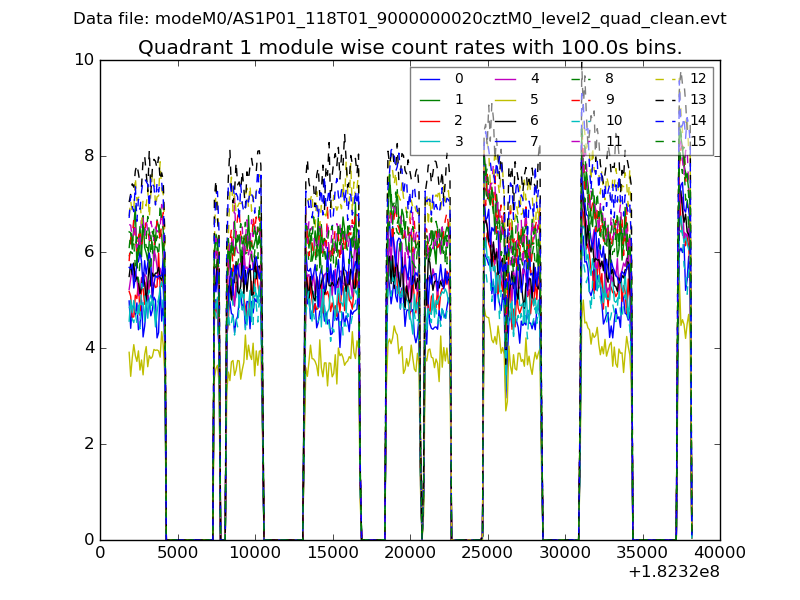
| Module-wise count rates for Quadrant A Data is divided into 100 sec bins |
 |
 |
| Module-wise count rates for Quadrant B Data is divided into 100 sec bins |
 |
 |
| Module-wise count rates for Quadrant C Data is divided into 100 sec bins |
 |
 |
| Module-wise count rates for Quadrant D Data is divided into 100 sec bins |
 |
 |
| Parameter | Plot |
|---|---|
| CZT HV Monitor |  |
| D_VDD | 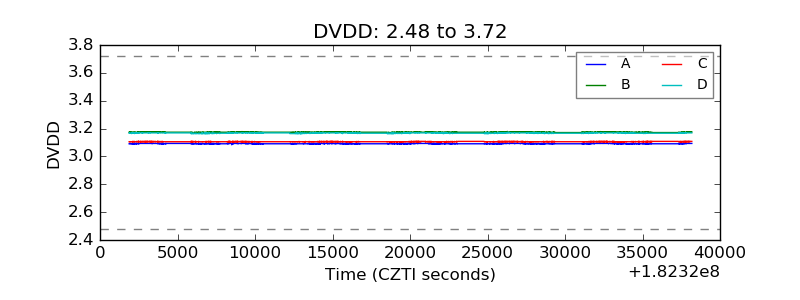 |
| Temperature 1 |  |
| Veto HV Monitor |  |
| Veto LLD |  |
| Alpha Counter |  |
| _CPM_Rate |  |
| CZT Counter |  |
| +2.5 Volts monitor |  |
| +5 Volts monitor |  |
| _ROLL_ROT |  |
| _Roll_DEC |  |
| _Roll_RA |  |
| Veto Counter |  |