| Param | Original file | Final file |
|---|---|---|
| Filename | modeM0/AS1P01_118T02_9000000022cztM0_level2_bc.evt | modeM0/AS1P01_118T02_9000000022cztM0_level2_quad_clean.evt |
| Size (bytes) | 1,147,008,960 | 285,163,200 |
| Size | 1.1 GB | 272.0 MB |
| Events in quadrant A | 7,750,780 | 1,618,630 |
| Events in quadrant B | 6,986,256 | 1,628,681 |
| Events in quadrant C | 7,116,607 | 1,595,128 |
| Events in quadrant D | 10,659,810 | 1,555,104 |
| Mode M0 | |||
|---|---|---|---|
| Quadrant | BADHDUFLAG | Total packets | Discarded packets |
| A | 0 | 140633 | 0 |
| B | 0 | 137841 | 0 |
| C | 0 | 133150 | 0 |
| D | 0 | 135632 | 0 |
| Mode SS | |||
|---|---|---|---|
| Quadrant | BADHDUFLAG | Total packets | Discarded packets |
| A | 0 | 664 | 0 |
| B | 0 | 664 | 0 |
| C | 0 | 664 | 0 |
| D | 0 | 662 | 0 |
| Mode M9 | |||
|---|---|---|---|
| Quadrant | BADHDUFLAG | Total packets | Discarded packets |
| A | 0 | 120 | 0 |
| B | 0 | 120 | 0 |
| C | 0 | 120 | 0 |
| D | 0 | 120 | 0 |
| Quadrant | Total seconds | Saturated seconds | Saturation percentage |
|---|---|---|---|
| A | 32584 | 185 | 0.567763% |
| B | 32582 | 17 | 0.052176% |
| C | 32586 | 386 | 1.184558% |
| D | 32590 | 206 | 0.632096% |
Noise dominated data is calculated using 1-second bins in cleaned event files. If a bin has >2000 counts, and if more than 50% of those come from <1% of pixels, then it is considered to be noise-dominated and hence unusable.
| Quadrant | # 1 sec bins | Bins with >0 counts | Bins with >2000 counts | High rate bins dominated by noise | Noise dominated (total time) | Noise dominated (detector-on time) | Marked lightcurve |
|---|---|---|---|---|---|---|---|
| A | 45439 | 32596 | 52 | 52 | 0.11% | 0.16% |  |
| B | 45439 | 32589 | 1 | 1 | 0.00% | 0.00% | 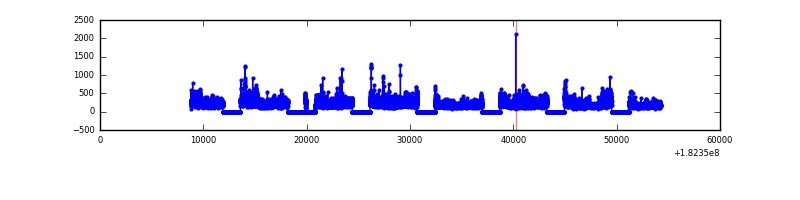 |
| C | 45439 | 32595 | 77 | 77 | 0.17% | 0.24% |  |
| D | 45439 | 32601 | 82 | 82 | 0.18% | 0.25% |  |
Top three noisy pixels from each quadrant. If the there are fewer than three noisy pixels in the level2.evt file, extra rows are filled as -1
| Pixel properties | Quadrant properties | ||||||
|---|---|---|---|---|---|---|---|
| Quadrant | DetID | PixID | Counts | Sigma | Mean | Median | Sigma |
| A | 15 | 127 | 699422 | 2407.32 | 1372 | 1336 | 290.0 |
| A | 5 | 244 | 691170 | 2378.87 | 1372 | 1336 | 290.0 |
| A | 0 | 96 | 470141 | 1616.66 | 1372 | 1336 | 290.0 |
| B | 5 | 46 | 1146856 | 4545.05 | 1409 | 1362 | 252.0 |
| B | 7 | 251 | 83494 | 325.88 | 1409 | 1362 | 252.0 |
| B | 15 | 219 | 46841 | 180.45 | 1409 | 1362 | 252.0 |
| C | 3 | 159 | 1365728 | 4834.83 | 1346 | 1317 | 282.2 |
| C | 1 | 1 | 174840 | 614.88 | 1346 | 1317 | 282.2 |
| C | 9 | 241 | 70319 | 244.51 | 1346 | 1317 | 282.2 |
| D | 1 | 4 | 4215096 | 13910.76 | 1352 | 1307 | 302.9 |
| D | 13 | 117 | 132890 | 434.39 | 1352 | 1307 | 302.9 |
| D | 9 | 7 | 105681 | 344.56 | 1352 | 1307 | 302.9 |
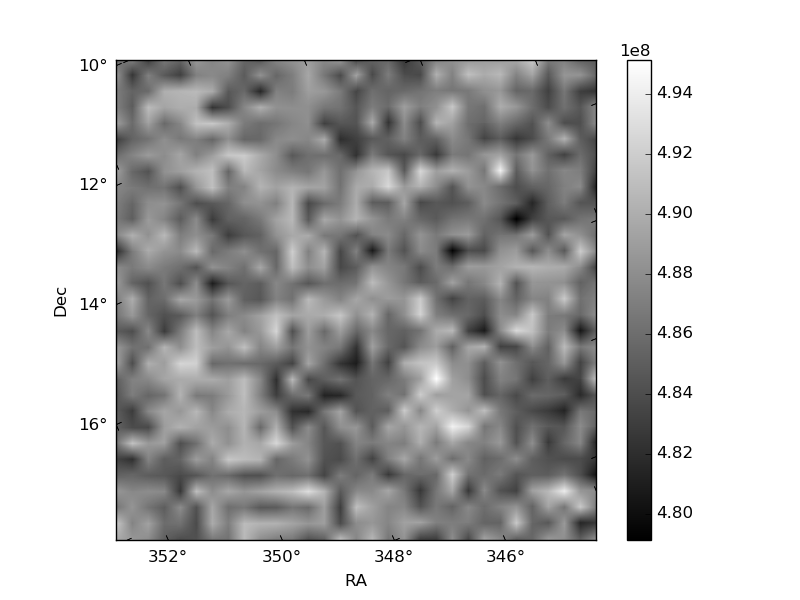
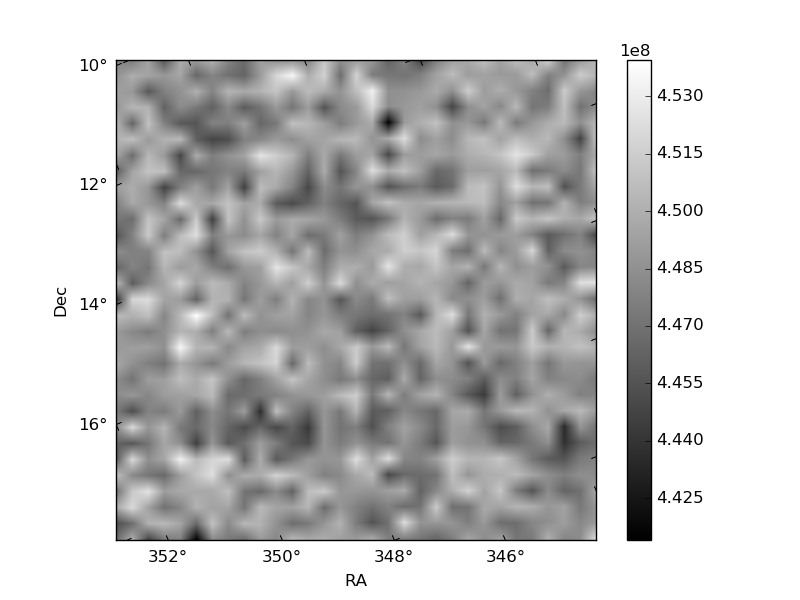
Histogram calculated using DETX and DETY for each event in the final _common_clean file
| Quadrant A | 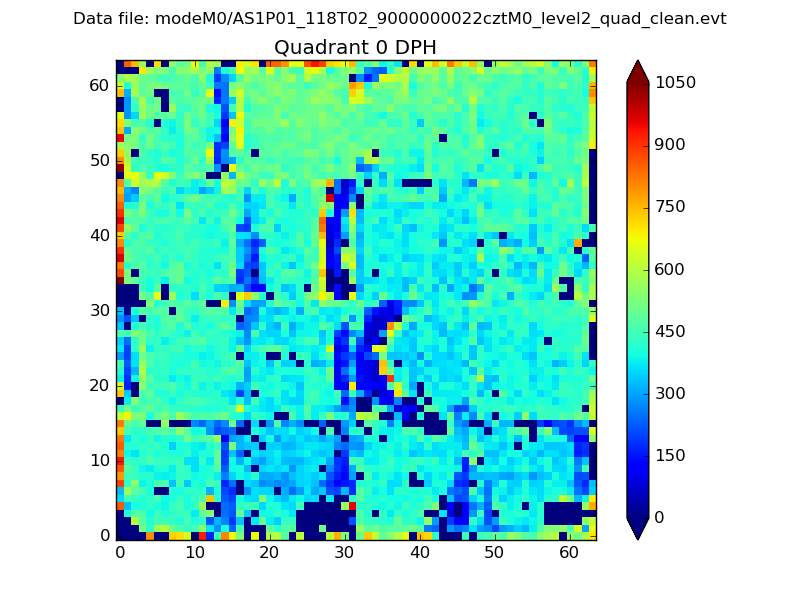 |
 |
Quadrant B |
|---|---|---|---|
| Quadrant D |  |
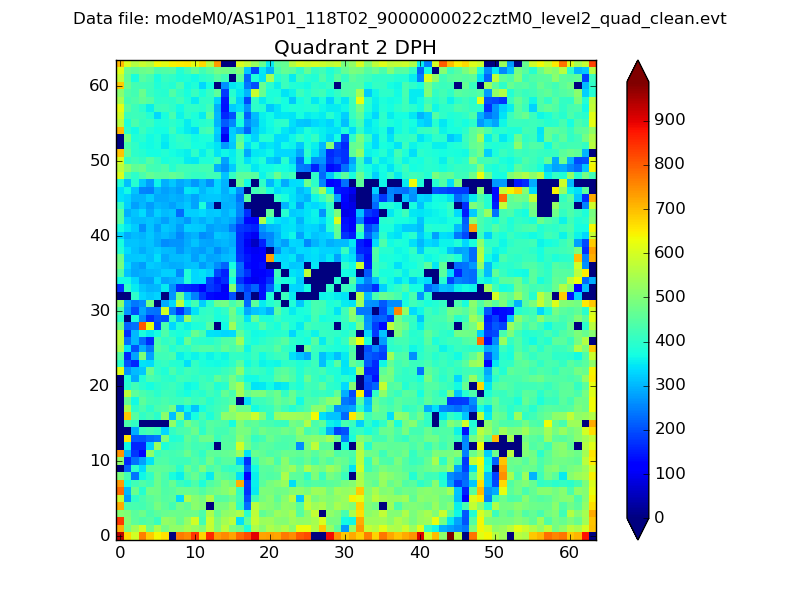 |
Quadrant C |
| Plot type | Count rate plots | Images |
|---|---|---|
| Comparison with Poisson distribution Blue bars denote a histogram of data divided into 1 sec bins. Red curve is a Poisson curve with rate = median count rate of data. |
 |
 |
| Quadrant-wise count rates Data is divided into 100 sec bins |
 |
|
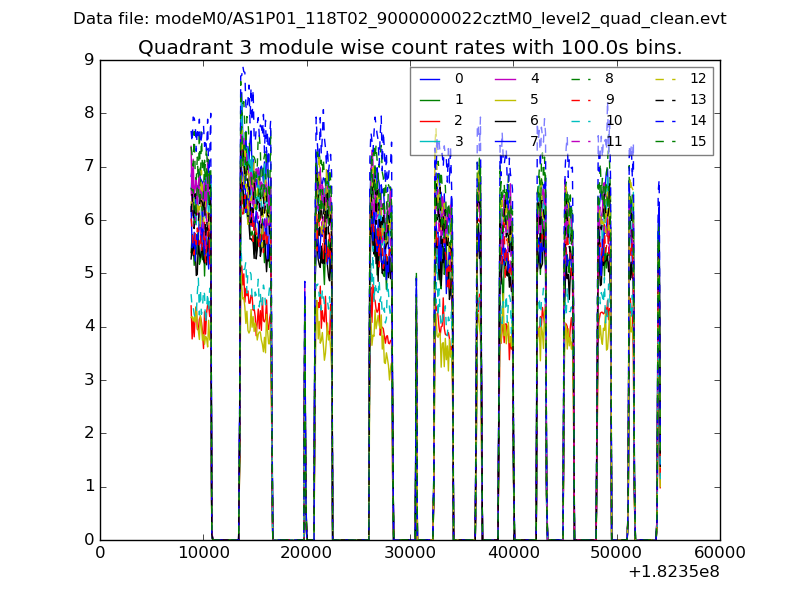
| Module-wise count rates for Quadrant A Data is divided into 100 sec bins |
 |
 |
| Module-wise count rates for Quadrant B Data is divided into 100 sec bins |
 |
 |
| Module-wise count rates for Quadrant C Data is divided into 100 sec bins |
 |
 |
| Module-wise count rates for Quadrant D Data is divided into 100 sec bins |
 |
 |
| Parameter | Plot |
|---|---|
| CZT HV Monitor |  |
| D_VDD |  |
| Temperature 1 |  |
| Veto HV Monitor |  |
| Veto LLD |  |
| Alpha Counter |  |
| _CPM_Rate | 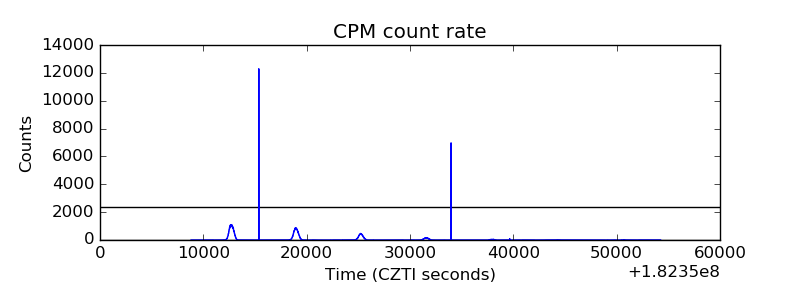 |
| CZT Counter |  |
| +2.5 Volts monitor |  |
| +5 Volts monitor |  |
| _ROLL_ROT |  |
| _Roll_DEC |  |
| _Roll_RA |  |
| Veto Counter |  |