| Param | Original file | Final file |
|---|---|---|
| Filename | modeM0/AS1P01_123T01_9000000024cztM0_level2_bc.evt | modeM0/AS1P01_123T01_9000000024cztM0_level2_quad_clean.evt |
| Size (bytes) | 2,534,302,080 | 929,903,040 |
| Size | 2.4 GB | 886.8 MB |
| Events in quadrant A | 11,585,371 | 6,001,504 |
| Events in quadrant B | 15,835,974 | 6,010,176 |
| Events in quadrant C | 11,729,843 | 6,113,270 |
| Events in quadrant D | 33,252,666 | 5,662,306 |
| Mode M9 | |||
|---|---|---|---|
| Quadrant | BADHDUFLAG | Total packets | Discarded packets |
| A | 0 | 241 | 0 |
| B | 0 | 241 | 0 |
| C | 0 | 241 | 0 |
| D | 0 | 241 | 0 |
| Mode SS | |||
|---|---|---|---|
| Quadrant | BADHDUFLAG | Total packets | Discarded packets |
| A | 0 | 1304 | 0 |
| B | 0 | 1304 | 0 |
| C | 0 | 1304 | 0 |
| D | 0 | 1304 | 0 |
| Mode M0 | |||
|---|---|---|---|
| Quadrant | BADHDUFLAG | Total packets | Discarded packets |
| A | 0 | 268702 | 0 |
| B | 0 | 281229 | 0 |
| C | 0 | 251442 | 0 |
| D | 0 | 317445 | 0 |
| Quadrant | Total seconds | Saturated seconds | Saturation percentage |
|---|---|---|---|
| A | 63864 | 119 | 0.186333% |
| B | 63864 | 428 | 0.670174% |
| C | 63863 | 28 | 0.043844% |
| D | 63864 | 3108 | 4.866592% |
Noise dominated data is calculated using 1-second bins in cleaned event files. If a bin has >2000 counts, and if more than 50% of those come from <1% of pixels, then it is considered to be noise-dominated and hence unusable.
| Quadrant | # 1 sec bins | Bins with >0 counts | Bins with >2000 counts | High rate bins dominated by noise | Noise dominated (total time) | Noise dominated (detector-on time) | Marked lightcurve |
|---|---|---|---|---|---|---|---|
| A | 87886 | 63864 | 9 | 9 | 0.01% | 0.01% | 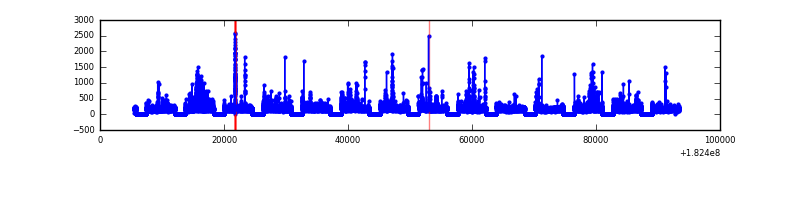 |
| B | 87886 | 63865 | 168 | 168 | 0.19% | 0.26% | 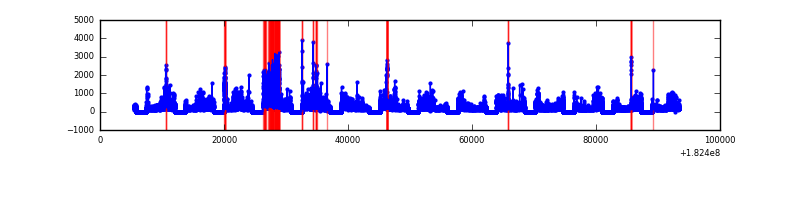 |
| C | 87886 | 63865 | 9 | 9 | 0.01% | 0.01% | 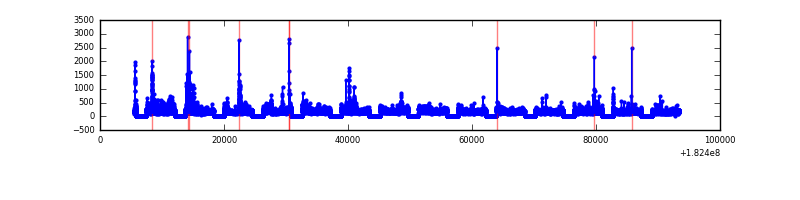 |
| D | 87886 | 63837 | 797 | 797 | 0.91% | 1.25% | 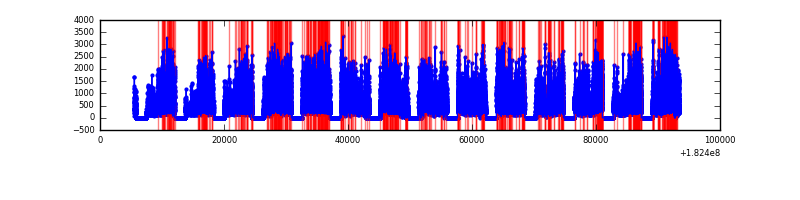 |
Top three noisy pixels from each quadrant. If the there are fewer than three noisy pixels in the level2.evt file, extra rows are filled as -1
| Pixel properties | Quadrant properties | ||||||
|---|---|---|---|---|---|---|---|
| Quadrant | DetID | PixID | Counts | Sigma | Mean | Median | Sigma |
| A | 5 | 244 | 229094 | 404.37 | 2662 | 2602 | 560.1 |
| A | 12 | 150 | 200528 | 353.37 | 2662 | 2602 | 560.1 |
| A | 15 | 250 | 157434 | 276.43 | 2662 | 2602 | 560.1 |
| B | 5 | 46 | 1588268 | 3228.91 | 2722 | 2633 | 491.1 |
| B | 7 | 220 | 1204548 | 2447.52 | 2722 | 2633 | 491.1 |
| B | 7 | 251 | 855781 | 1737.31 | 2722 | 2633 | 491.1 |
| C | 1 | 1 | 659440 | 1147.45 | 2684 | 2637 | 572.4 |
| C | 9 | 188 | 91081 | 154.51 | 2684 | 2637 | 572.4 |
| C | 9 | 54 | 49644 | 82.12 | 2684 | 2637 | 572.4 |
| D | 1 | 4 | 18301818 | 30859.66 | 2593 | 2509 | 593.0 |
| D | 2 | 85 | 738403 | 1241.0 | 2593 | 2509 | 593.0 |
| D | 10 | 154 | 510566 | 856.78 | 2593 | 2509 | 593.0 |
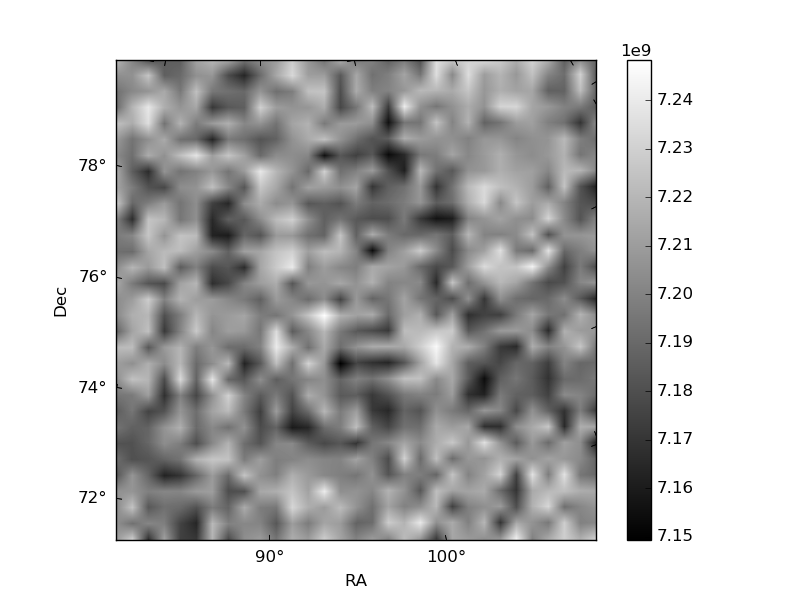
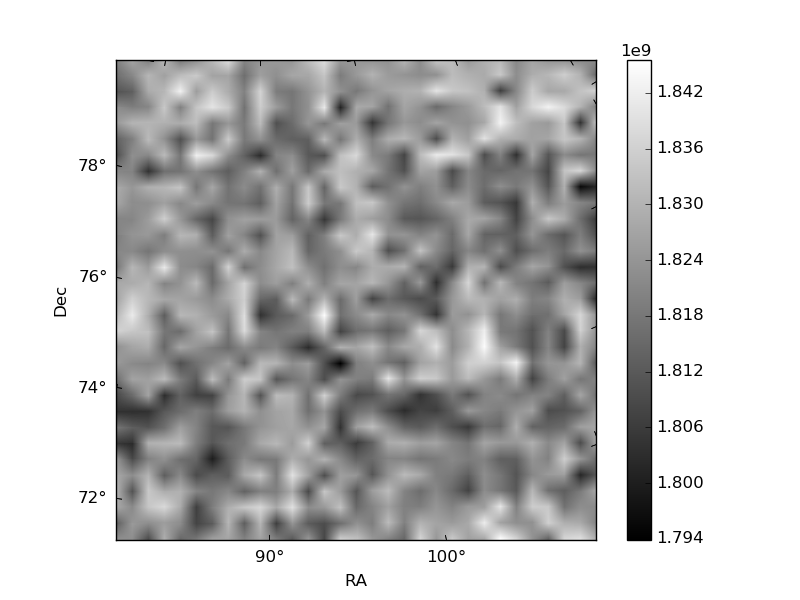
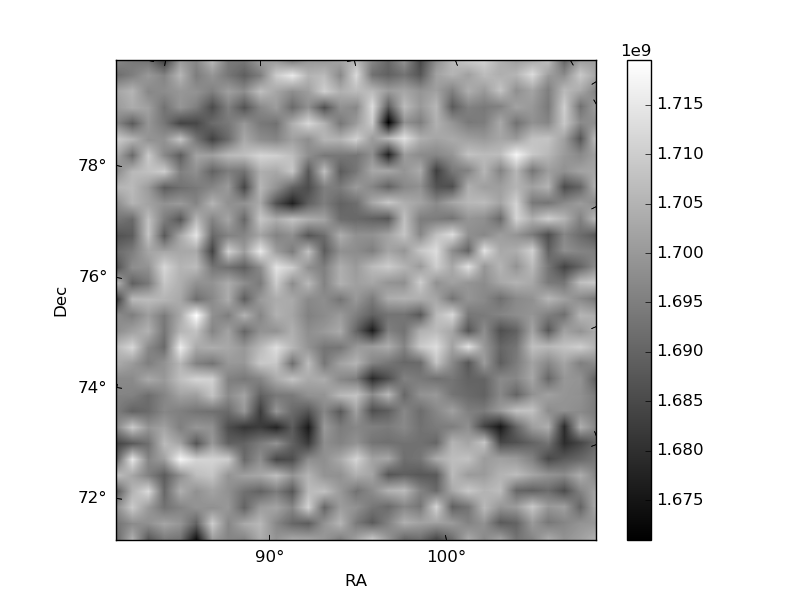
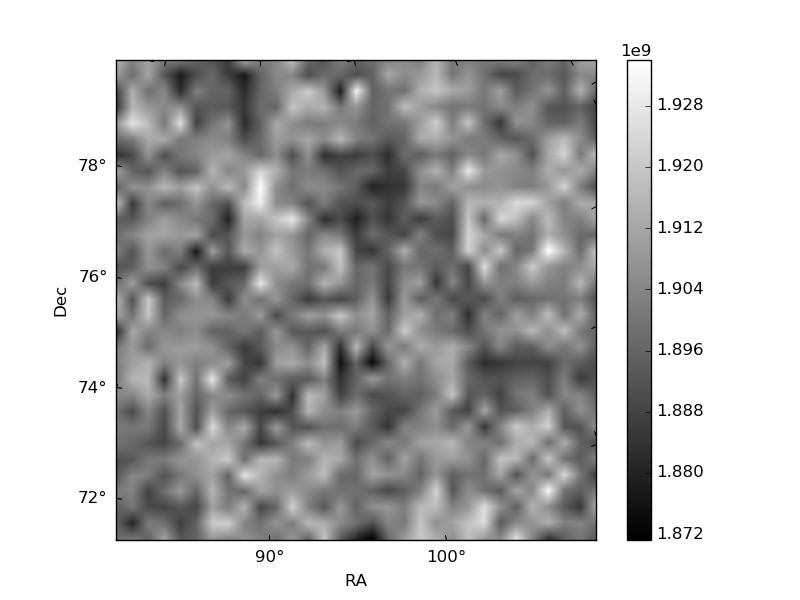
Histogram calculated using DETX and DETY for each event in the final _common_clean file
| Quadrant A | 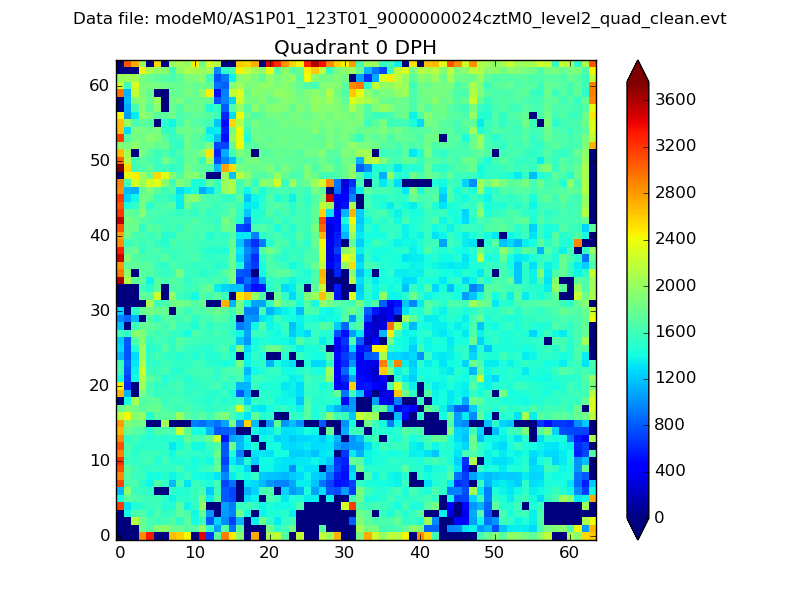 |
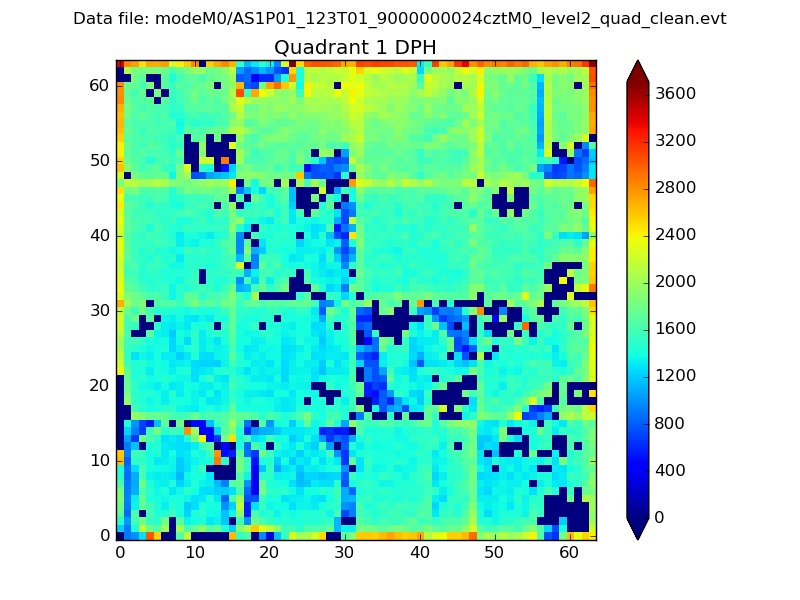 |
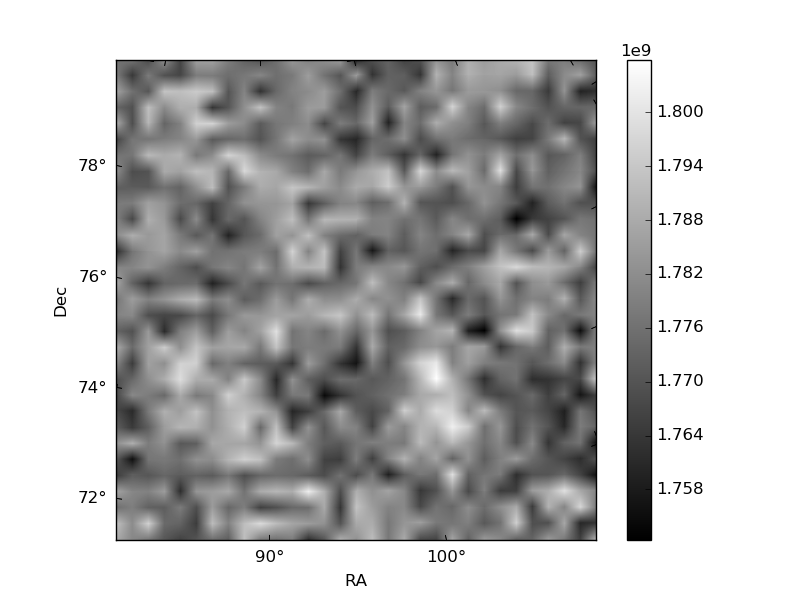
Quadrant B |
|---|---|---|---|
| Quadrant D | 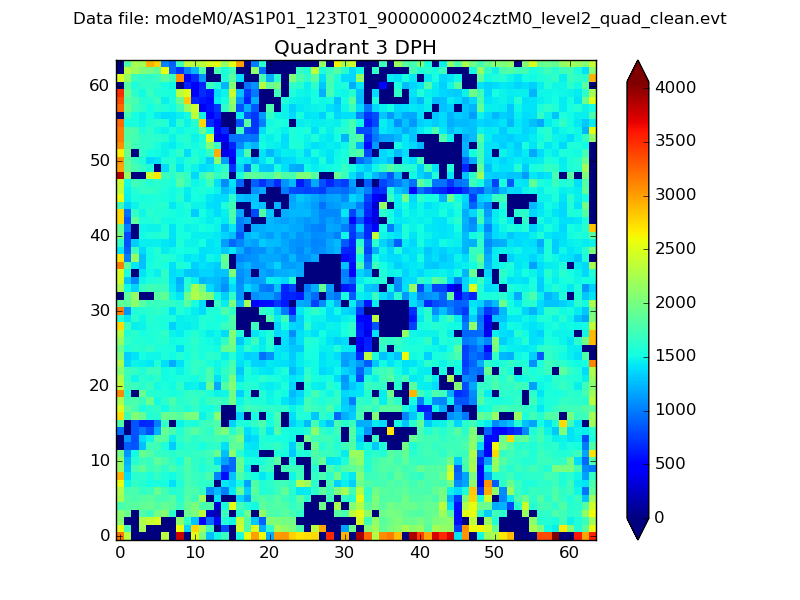 |
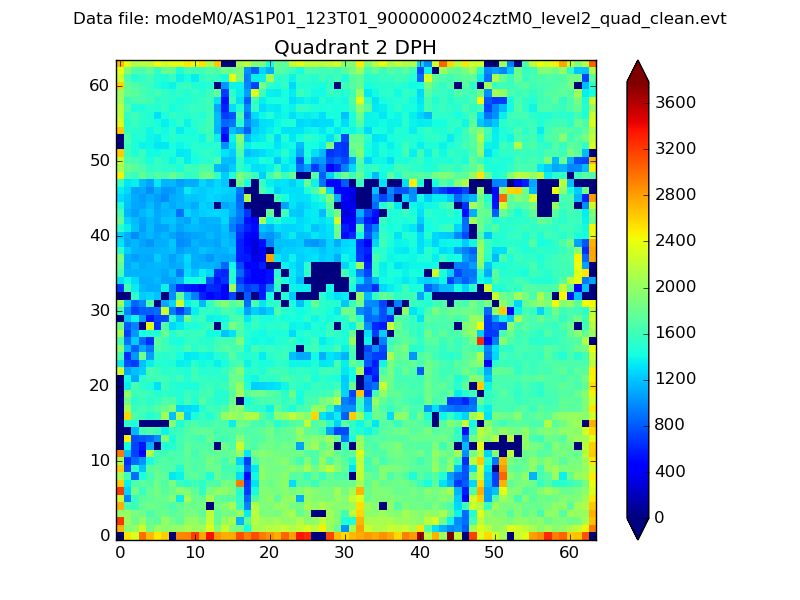 |
Quadrant C |
| Plot type | Count rate plots | Images |
|---|---|---|
| Comparison with Poisson distribution Blue bars denote a histogram of data divided into 1 sec bins. Red curve is a Poisson curve with rate = median count rate of data. |
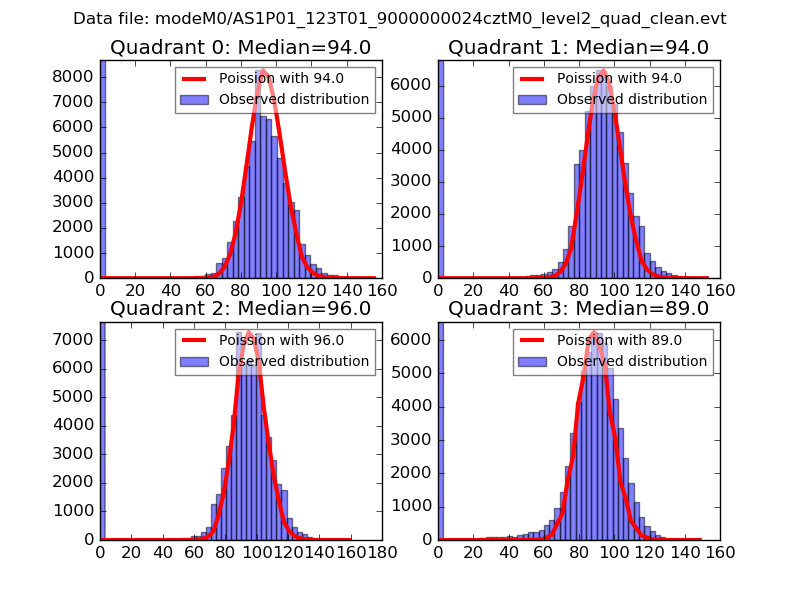 |
 |
| Quadrant-wise count rates Data is divided into 100 sec bins |
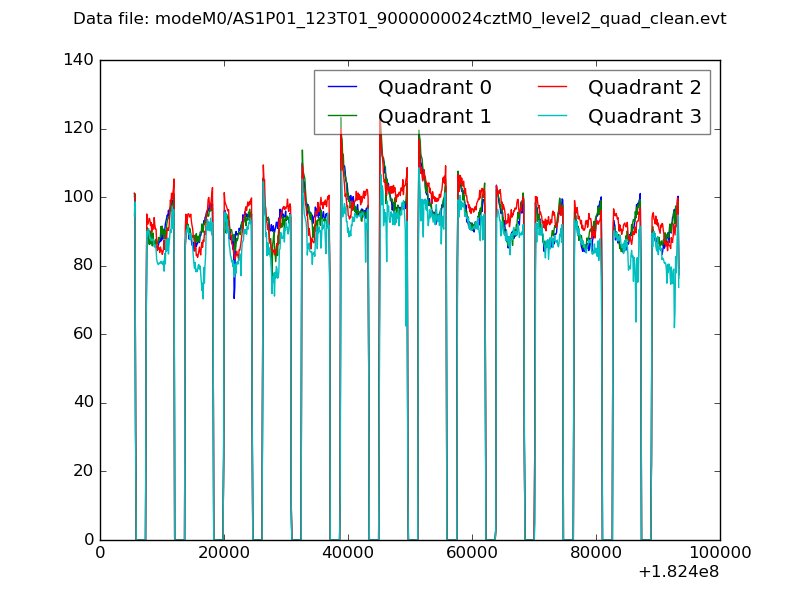 |
|
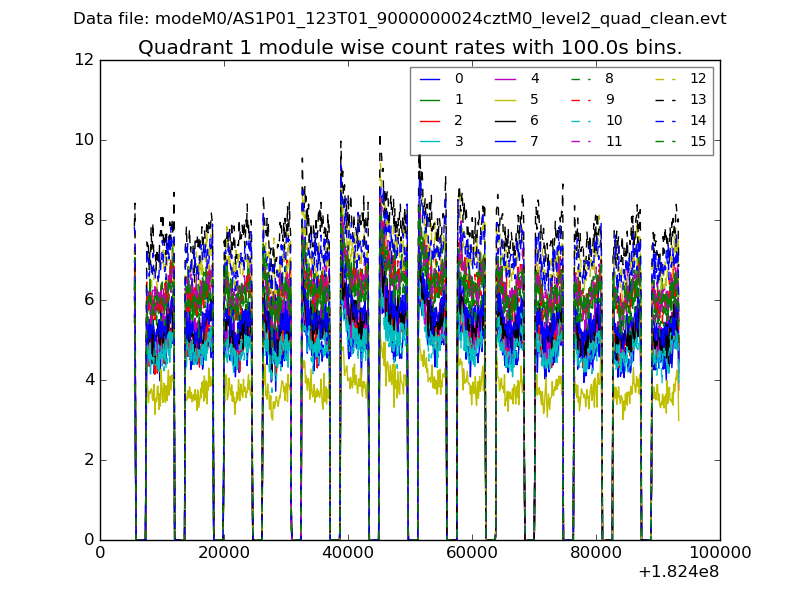
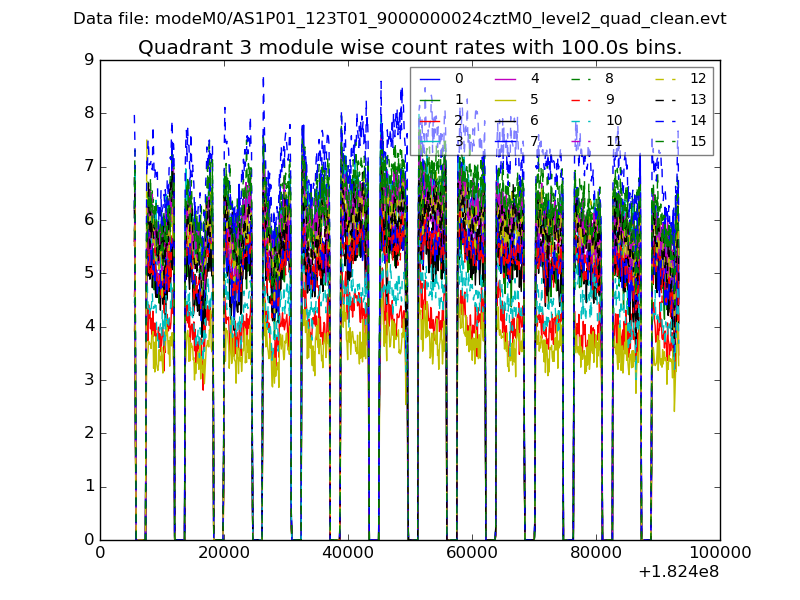
| Module-wise count rates for Quadrant A Data is divided into 100 sec bins |
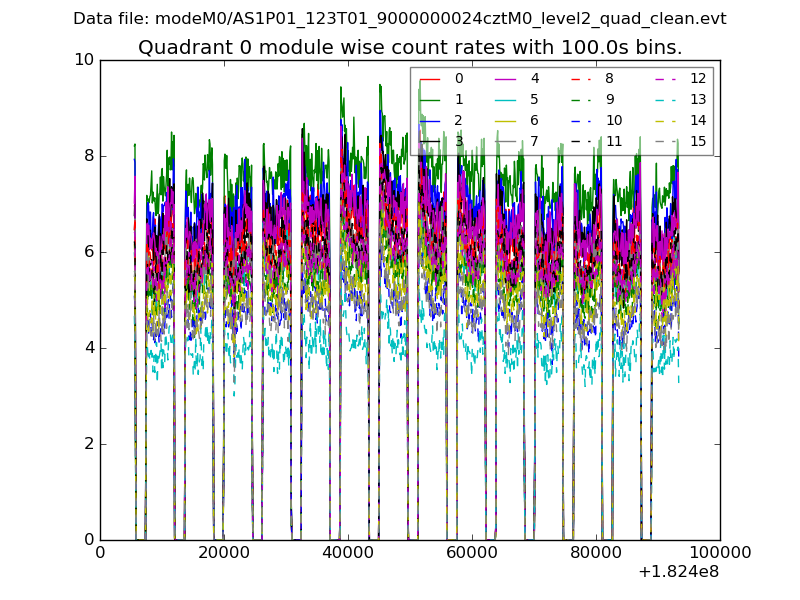 |
 |
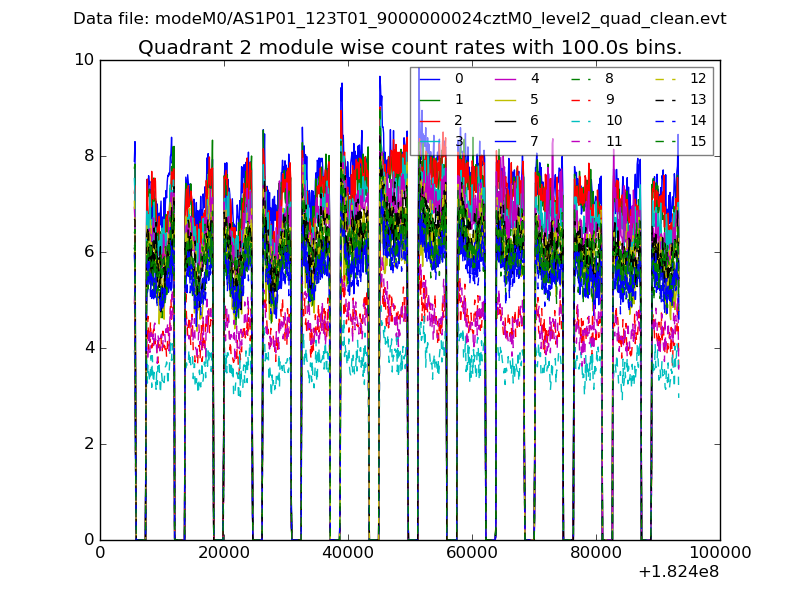
| Module-wise count rates for Quadrant B Data is divided into 100 sec bins |
 |
 |
| Module-wise count rates for Quadrant C Data is divided into 100 sec bins |
 |
 |
| Module-wise count rates for Quadrant D Data is divided into 100 sec bins |
 |
 |
| Parameter | Plot |
|---|---|
| CZT HV Monitor | 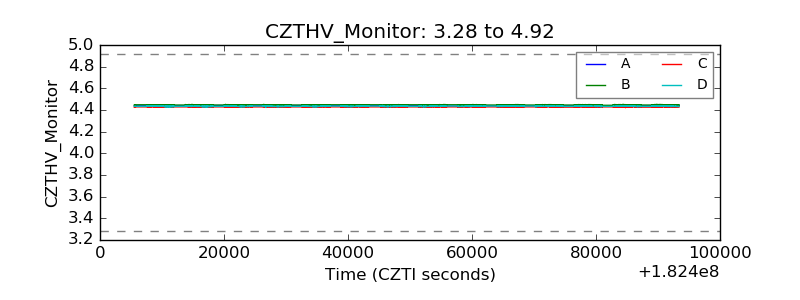 |
| D_VDD | 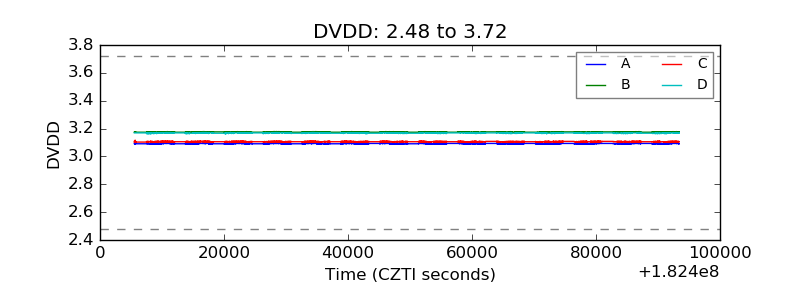 |
| Temperature 1 | 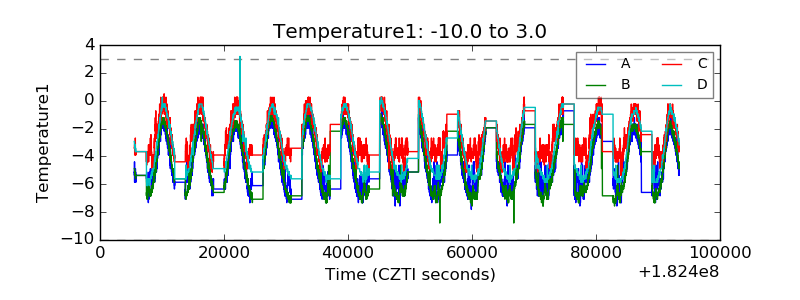 |
| Veto HV Monitor | 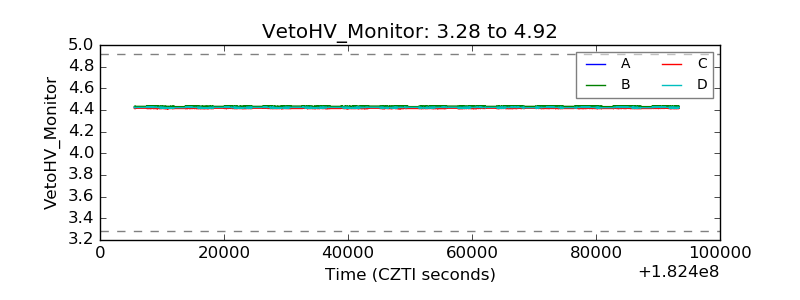 |
| Veto LLD | 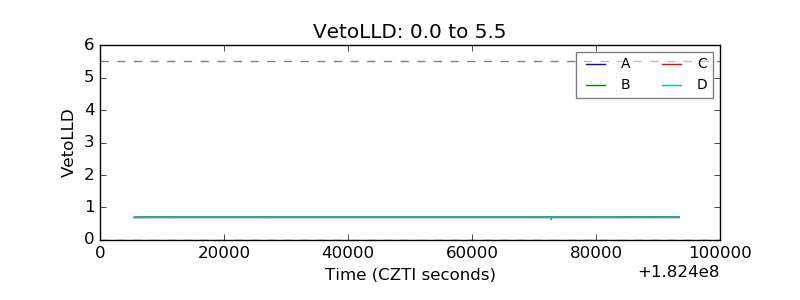 |
| Alpha Counter | 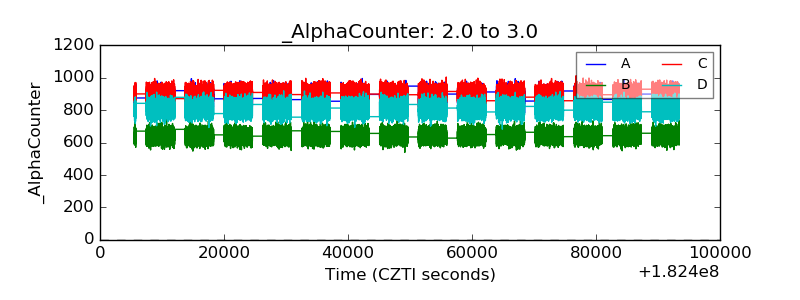 |
| _CPM_Rate | 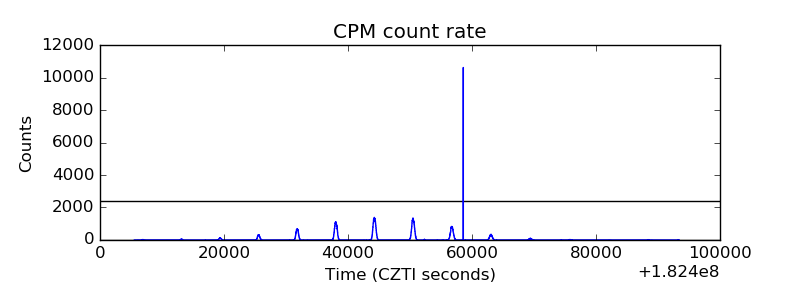 |
| CZT Counter | 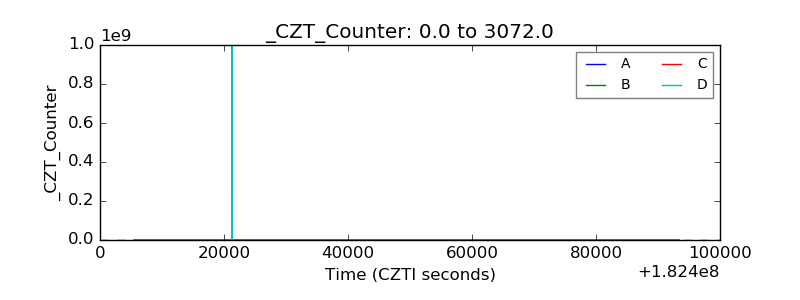 |
| +2.5 Volts monitor | 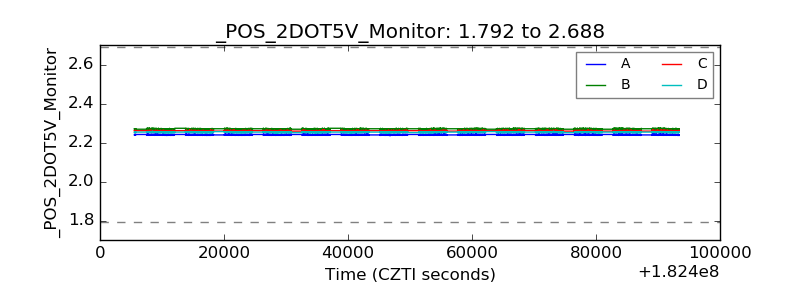 |
| +5 Volts monitor | 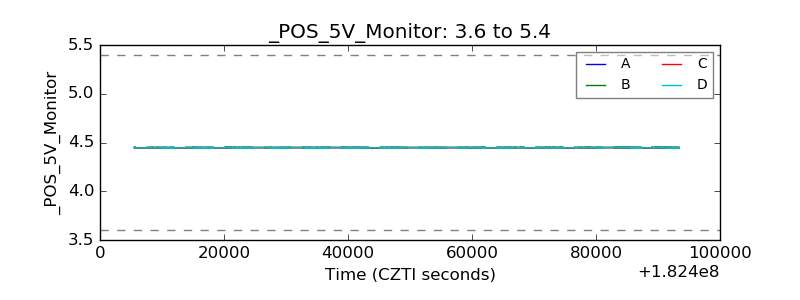 |
| _ROLL_ROT | 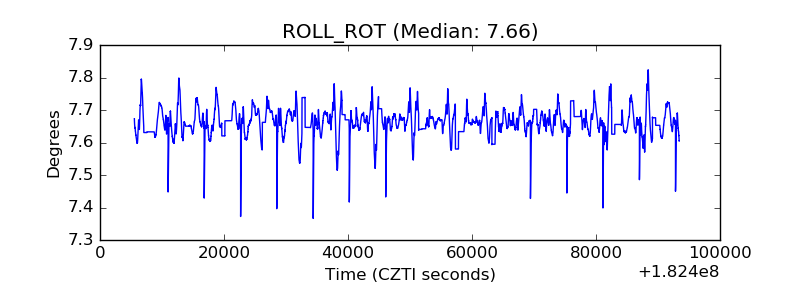 |
| _Roll_DEC | 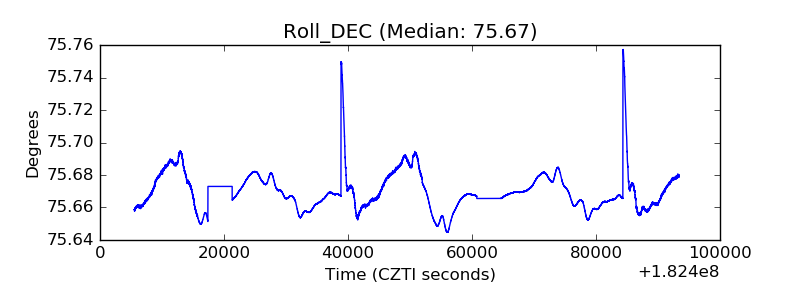 |
| _Roll_RA | 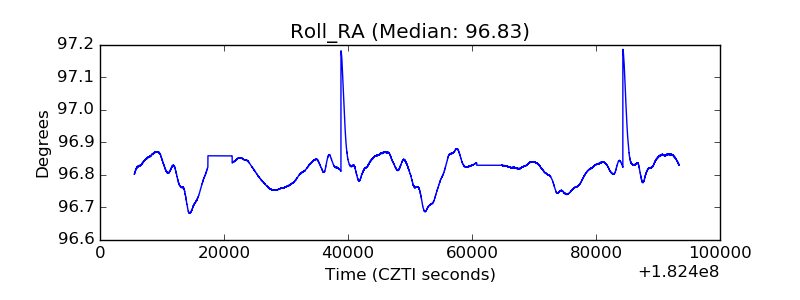 |
| Veto Counter | 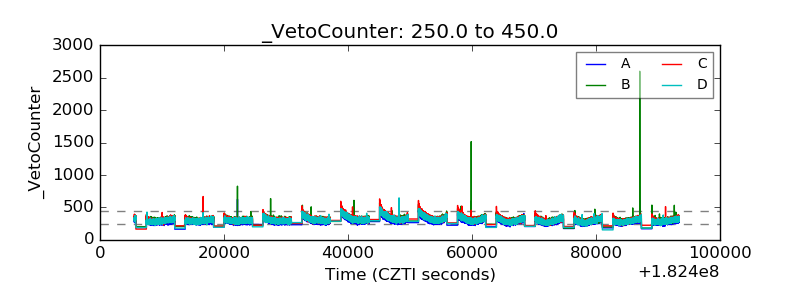 |