| Param | Original file | Final file |
|---|---|---|
| Filename | modeM0/AS1P01_122T01_9000000026cztM0_level2_bc.evt | modeM0/AS1P01_122T01_9000000026cztM0_level2_quad_clean.evt |
| Size (bytes) | 1,907,346,240 | 548,599,680 |
| Size | 1.8 GB | 523.2 MB |
| Events in quadrant A | 11,454,851 | 3,278,325 |
| Events in quadrant B | 11,941,782 | 3,306,127 |
| Events in quadrant C | 9,634,244 | 3,256,507 |
| Events in quadrant D | 21,098,661 | 3,115,293 |
| Mode M9 | |||
|---|---|---|---|
| Quadrant | BADHDUFLAG | Total packets | Discarded packets |
| A | 0 | 189 | 0 |
| B | 0 | 189 | 0 |
| C | 0 | 189 | 0 |
| D | 0 | 189 | 0 |
| Mode SS | |||
|---|---|---|---|
| Quadrant | BADHDUFLAG | Total packets | Discarded packets |
| A | 0 | 1088 | 0 |
| B | 0 | 1086 | 0 |
| C | 0 | 1088 | 0 |
| D | 0 | 1088 | 0 |
| Mode M0 | |||
|---|---|---|---|
| Quadrant | BADHDUFLAG | Total packets | Discarded packets |
| A | 0 | 230575 | 0 |
| B | 0 | 228713 | 0 |
| C | 0 | 210215 | 0 |
| D | 0 | 236466 | 0 |
| Quadrant | Total seconds | Saturated seconds | Saturation percentage |
|---|---|---|---|
| A | 53339 | 310 | 0.581188% |
| B | 53342 | 360 | 0.674890% |
| C | 53331 | 52 | 0.097504% |
| D | 53336 | 719 | 1.348058% |
Noise dominated data is calculated using 1-second bins in cleaned event files. If a bin has >2000 counts, and if more than 50% of those come from <1% of pixels, then it is considered to be noise-dominated and hence unusable.
| Quadrant | # 1 sec bins | Bins with >0 counts | Bins with >2000 counts | High rate bins dominated by noise | Noise dominated (total time) | Noise dominated (detector-on time) | Marked lightcurve |
|---|---|---|---|---|---|---|---|
| A | 83184 | 53317 | 119 | 119 | 0.14% | 0.22% | 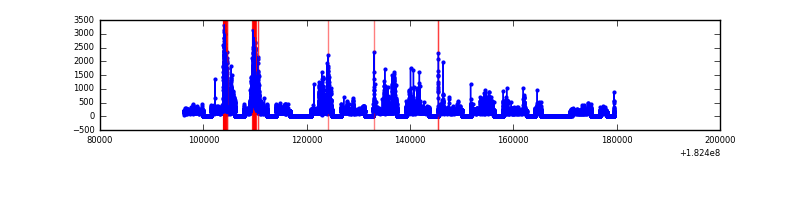 |
| B | 83183 | 53308 | 187 | 187 | 0.22% | 0.35% | 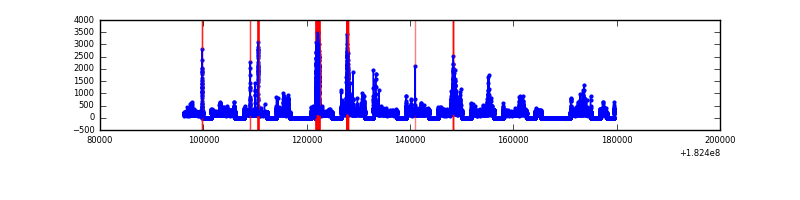 |
| C | 83184 | 53312 | 16 | 16 | 0.02% | 0.03% | 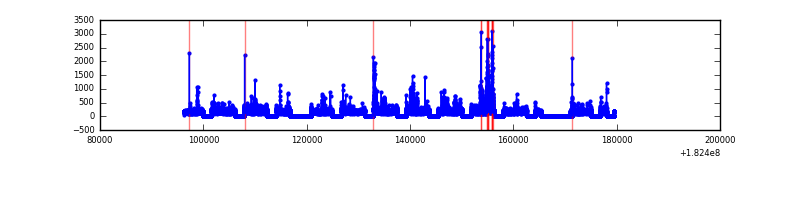 |
| D | 83183 | 53315 | 354 | 354 | 0.43% | 0.66% | 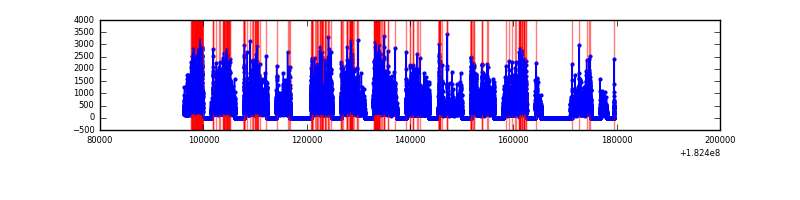 |
Top three noisy pixels from each quadrant. If the there are fewer than three noisy pixels in the level2.evt file, extra rows are filled as -1
| Pixel properties | Quadrant properties | ||||||
|---|---|---|---|---|---|---|---|
| Quadrant | DetID | PixID | Counts | Sigma | Mean | Median | Sigma |
| A | 15 | 127 | 1148073 | 2448.6 | 2232 | 2180 | 468.0 |
| A | 15 | 250 | 666547 | 1419.65 | 2232 | 2180 | 468.0 |
| A | 15 | 17 | 595592 | 1268.03 | 2232 | 2180 | 468.0 |
| B | 2 | 32 | 1894153 | 4562.78 | 2299 | 2220 | 414.6 |
| B | 0 | 214 | 420266 | 1008.2 | 2299 | 2220 | 414.6 |
| B | 10 | 14 | 171244 | 407.63 | 2299 | 2220 | 414.6 |
| C | 2 | 192 | 235523 | 494.56 | 2230 | 2182 | 471.8 |
| C | 1 | 1 | 190006 | 398.09 | 2230 | 2182 | 471.8 |
| C | 9 | 68 | 89298 | 184.64 | 2230 | 2182 | 471.8 |
| D | 1 | 4 | 7370995 | 15217.46 | 2179 | 2108 | 484.2 |
| D | 10 | 154 | 2171623 | 4480.26 | 2179 | 2108 | 484.2 |
| D | 13 | 7 | 630061 | 1296.78 | 2179 | 2108 | 484.2 |
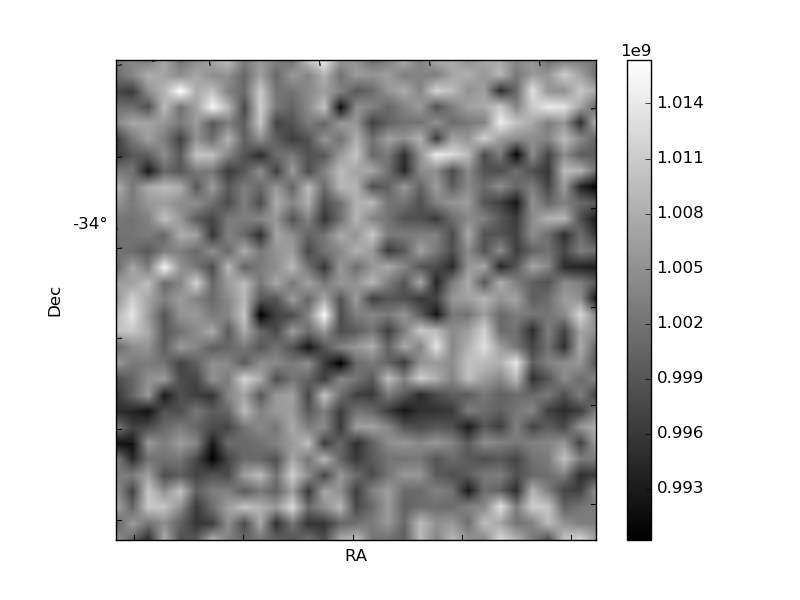
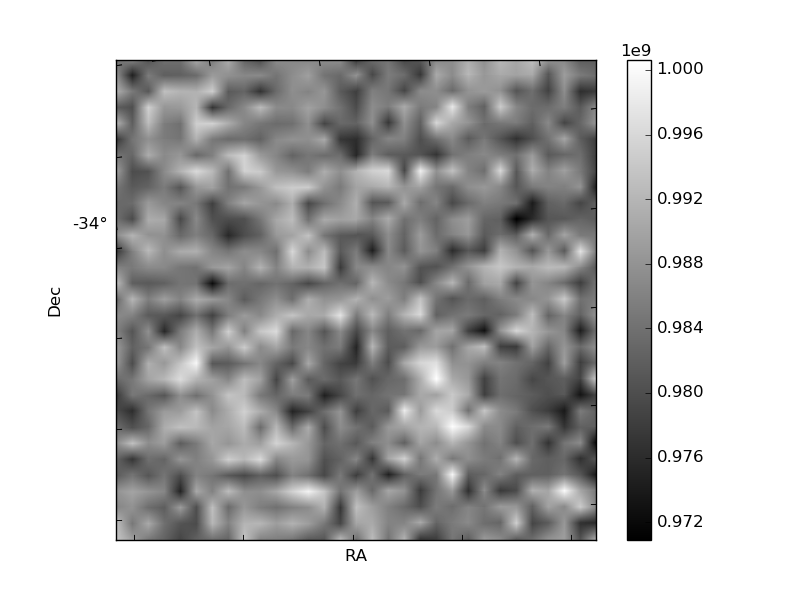
Histogram calculated using DETX and DETY for each event in the final _common_clean file
| Quadrant A | 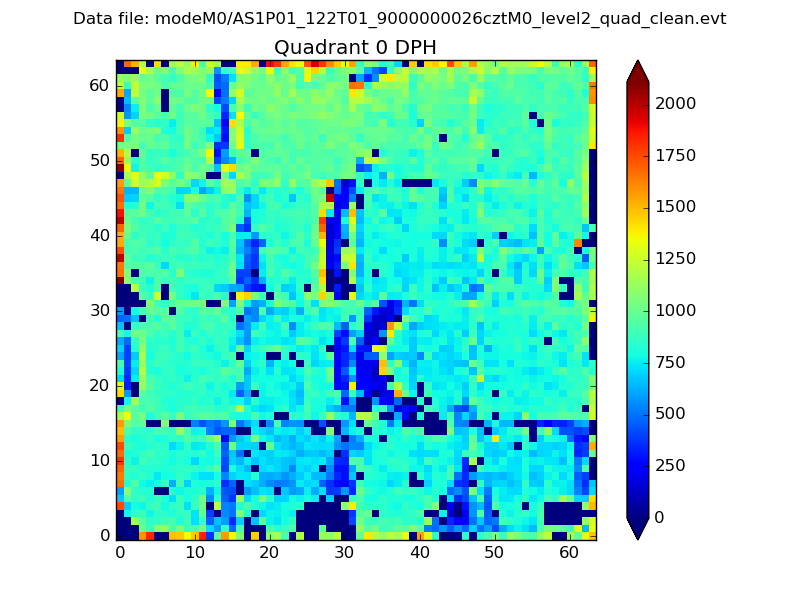 |
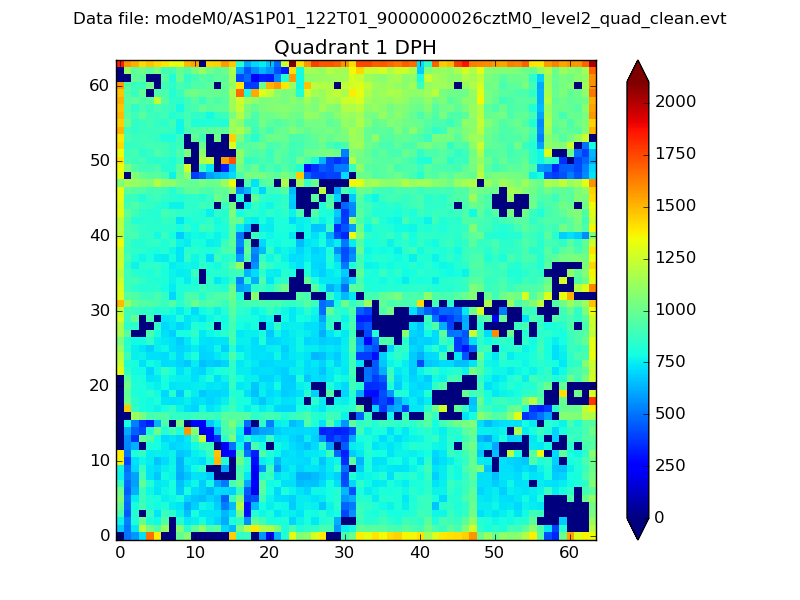 |
Quadrant B |
|---|---|---|---|
| Quadrant D | 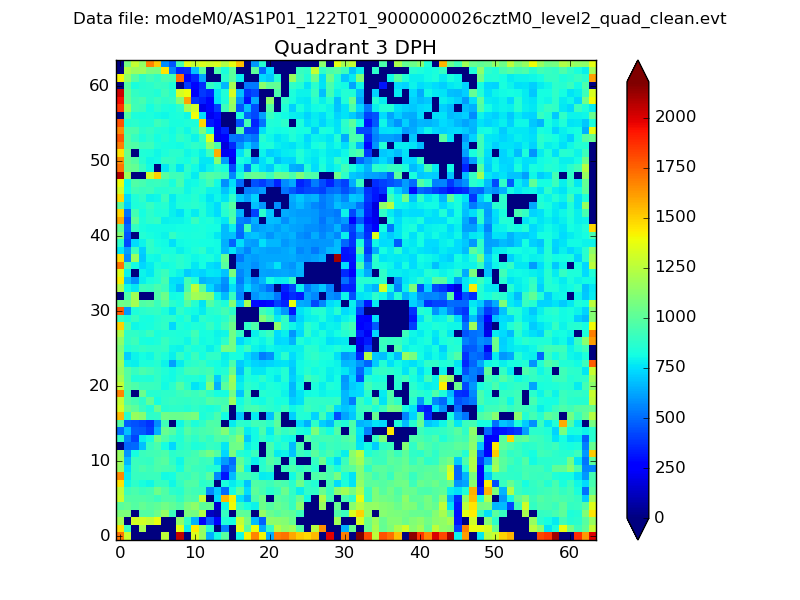 |
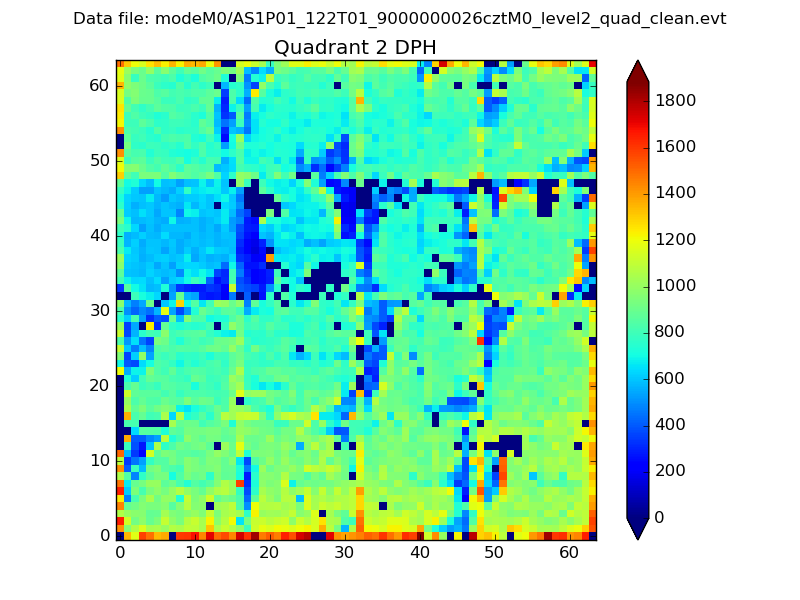 |
Quadrant C |
| Plot type | Count rate plots | Images |
|---|---|---|
| Comparison with Poisson distribution Blue bars denote a histogram of data divided into 1 sec bins. Red curve is a Poisson curve with rate = median count rate of data. |
 |
 |
| Quadrant-wise count rates Data is divided into 100 sec bins |
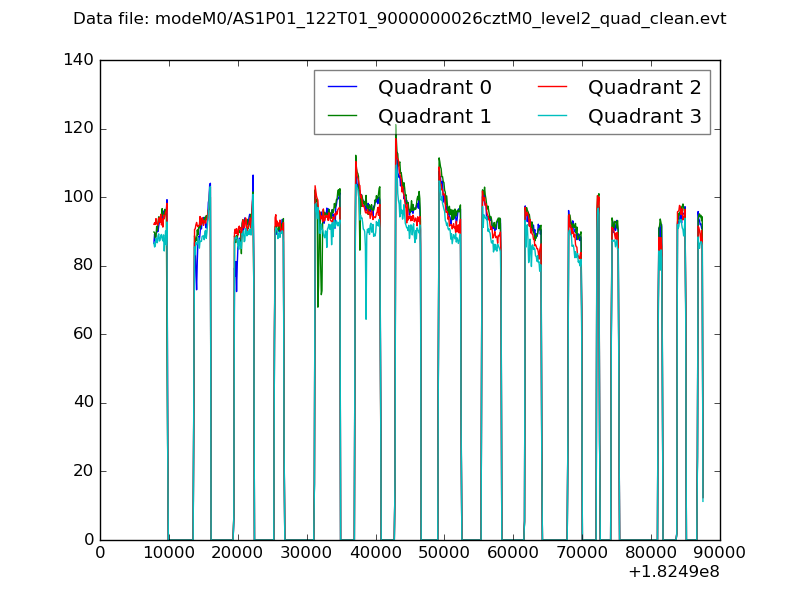 |
|
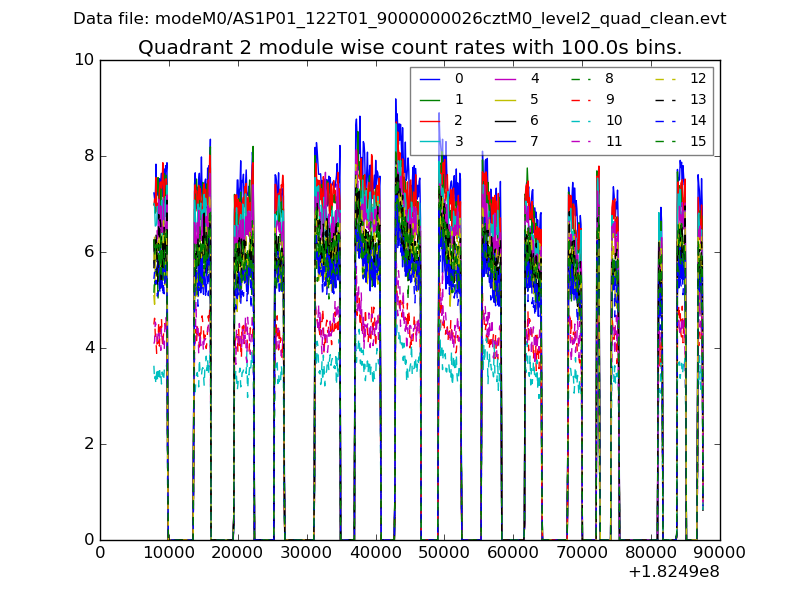
| Module-wise count rates for Quadrant A Data is divided into 100 sec bins |
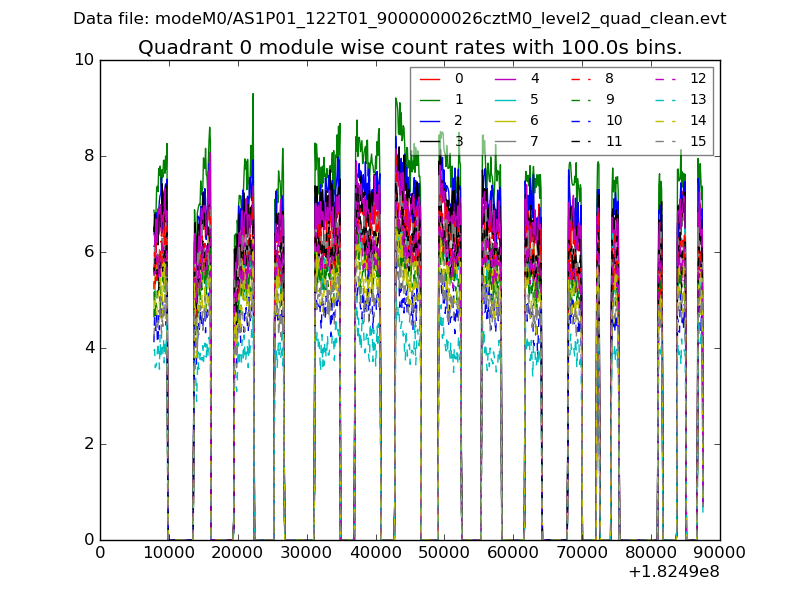 |
 |
| Module-wise count rates for Quadrant B Data is divided into 100 sec bins |
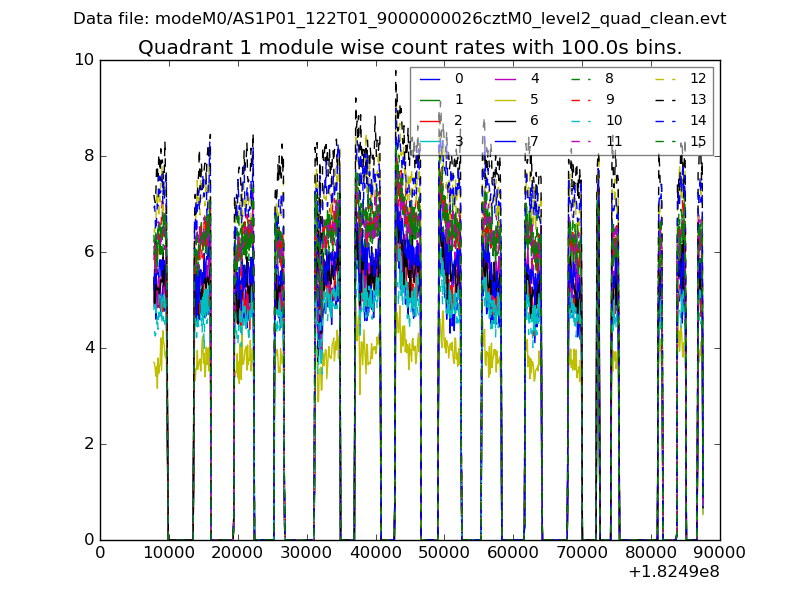 |
 |
| Module-wise count rates for Quadrant C Data is divided into 100 sec bins |
 |
 |
| Module-wise count rates for Quadrant D Data is divided into 100 sec bins |
 |
 |
| Parameter | Plot |
|---|---|
| CZT HV Monitor | 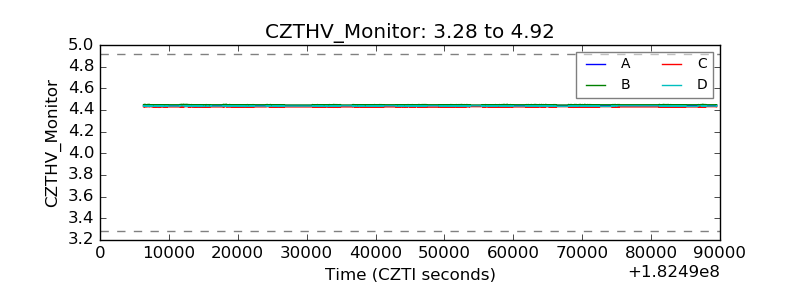 |
| D_VDD | 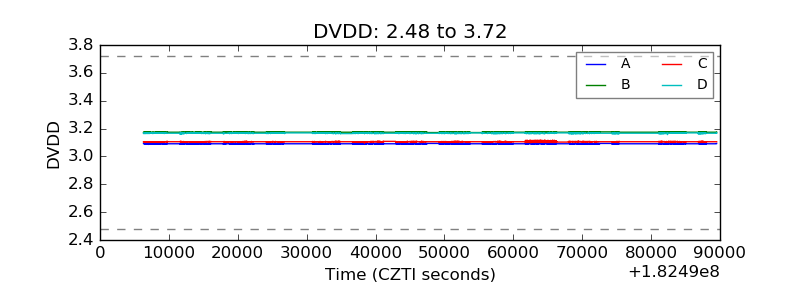 |
| Temperature 1 | 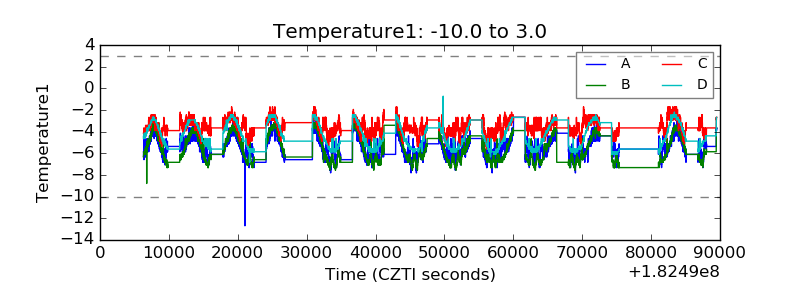 |
| Veto HV Monitor |  |
| Veto LLD | 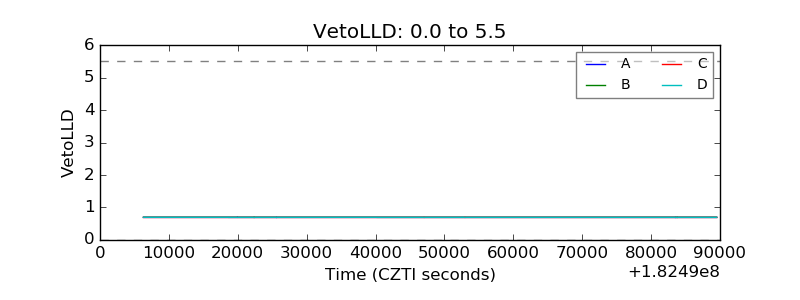 |
| Alpha Counter | 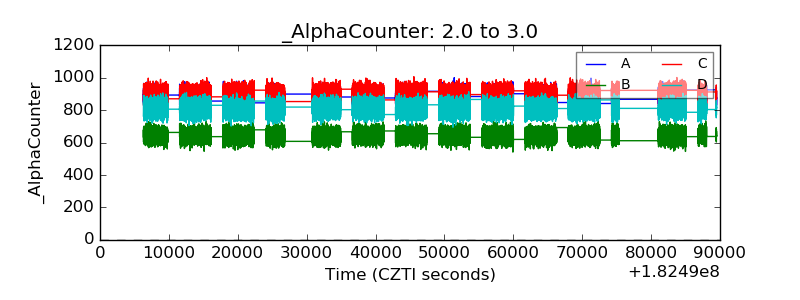 |
| _CPM_Rate | 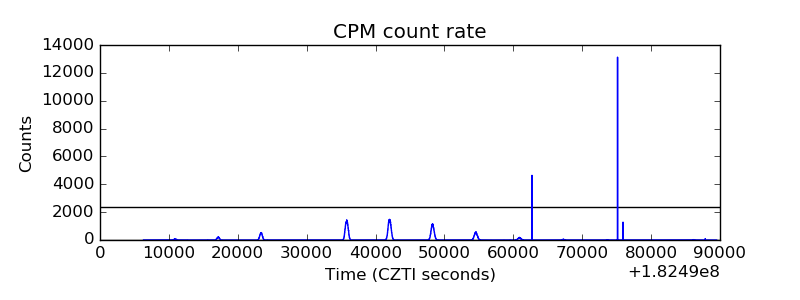 |
| CZT Counter | 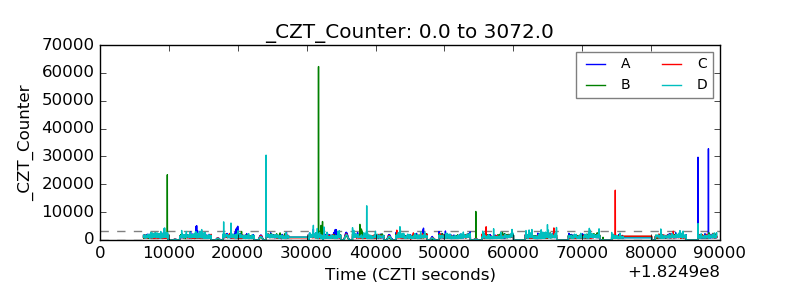 |
| +2.5 Volts monitor | 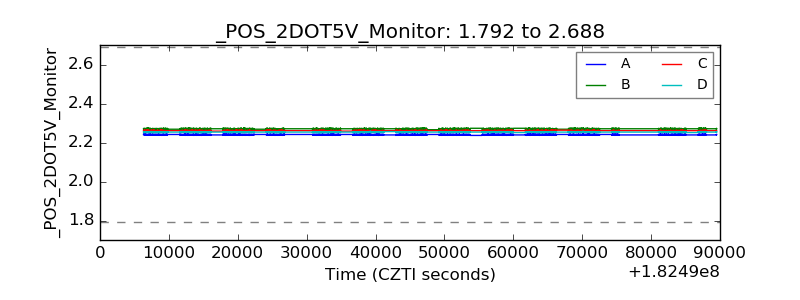 |
| +5 Volts monitor | 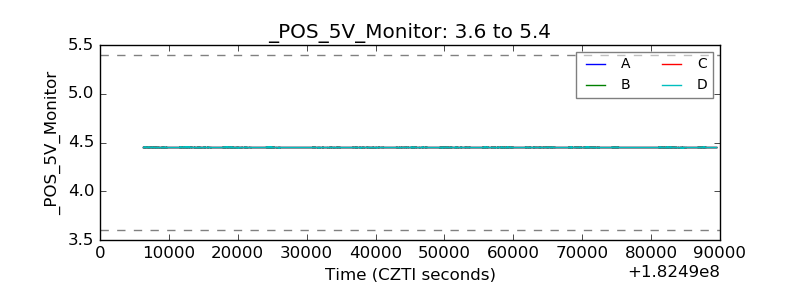 |
| Veto Counter | 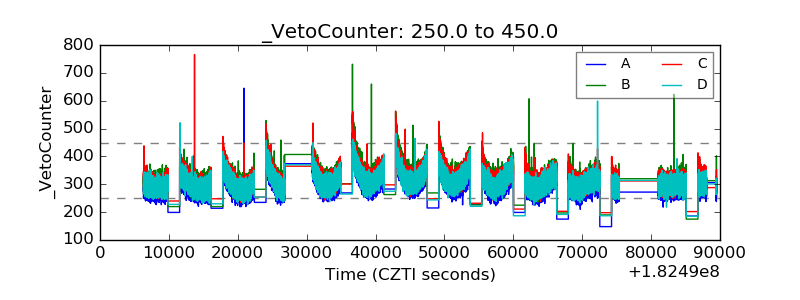 |