| Param | Original file | Final file |
|---|---|---|
| Filename | modeM0/AS1P01_126T04_9000000036cztM0_level2_bc.evt | modeM0/AS1P01_126T04_9000000036cztM0_level2_quad_clean.evt |
| Size (bytes) | 1,753,297,920 | 579,853,440 |
| Size | 1.6 GB | 553.0 MB |
| Events in quadrant A | 10,430,897 | 3,432,285 |
| Events in quadrant B | 10,992,599 | 3,492,719 |
| Events in quadrant C | 15,251,773 | 3,401,709 |
| Events in quadrant D | 12,545,335 | 3,335,414 |
| Mode M0 | |||
|---|---|---|---|
| Quadrant | BADHDUFLAG | Total packets | Discarded packets |
| A | 0 | 242610 | 0 |
| B | 0 | 241643 | 0 |
| C | 0 | 240729 | 0 |
| D | 0 | 223468 | 0 |
| Mode SS | |||
|---|---|---|---|
| Quadrant | BADHDUFLAG | Total packets | Discarded packets |
| A | 0 | 1160 | 0 |
| B | 0 | 1160 | 0 |
| C | 0 | 1160 | 0 |
| D | 0 | 1160 | 0 |
| Mode M9 | |||
|---|---|---|---|
| Quadrant | BADHDUFLAG | Total packets | Discarded packets |
| A | 0 | 241 | 0 |
| B | 0 | 241 | 0 |
| C | 0 | 241 | 0 |
| D | 0 | 241 | 0 |
| Quadrant | Total seconds | Saturated seconds | Saturation percentage |
|---|---|---|---|
| A | 56868 | 81 | 0.142435% |
| B | 56869 | 105 | 0.184635% |
| C | 56864 | 290 | 0.509989% |
| D | 56867 | 202 | 0.355215% |
Noise dominated data is calculated using 1-second bins in cleaned event files. If a bin has >2000 counts, and if more than 50% of those come from <1% of pixels, then it is considered to be noise-dominated and hence unusable.
| Quadrant | # 1 sec bins | Bins with >0 counts | Bins with >2000 counts | High rate bins dominated by noise | Noise dominated (total time) | Noise dominated (detector-on time) | Marked lightcurve |
|---|---|---|---|---|---|---|---|
| A | 86390 | 56871 | 19 | 19 | 0.02% | 0.03% |  |
| B | 86390 | 56872 | 9 | 9 | 0.01% | 0.02% |  |
| C | 86390 | 56871 | 139 | 139 | 0.16% | 0.24% |  |
| D | 86390 | 56867 | 14 | 14 | 0.02% | 0.02% |  |
Top three noisy pixels from each quadrant. If the there are fewer than three noisy pixels in the level2.evt file, extra rows are filled as -1
| Pixel properties | Quadrant properties | ||||||
|---|---|---|---|---|---|---|---|
| Quadrant | DetID | PixID | Counts | Sigma | Mean | Median | Sigma |
| A | 0 | 6 | 199535 | 390.73 | 2418 | 2362 | 504.6 |
| A | 15 | 127 | 198616 | 388.9 | 2418 | 2362 | 504.6 |
| A | 0 | 69 | 198041 | 387.77 | 2418 | 2362 | 504.6 |
| B | 5 | 46 | 282839 | 624.58 | 2495 | 2413 | 449.0 |
| B | 0 | 183 | 265911 | 586.88 | 2495 | 2413 | 449.0 |
| B | 8 | 6 | 96357 | 209.24 | 2495 | 2413 | 449.0 |
| C | 1 | 1 | 3139524 | 6271.43 | 2383 | 2335 | 500.2 |
| C | 2 | 192 | 1701293 | 3396.32 | 2383 | 2335 | 500.2 |
| C | 3 | 159 | 341939 | 678.89 | 2383 | 2335 | 500.2 |
| D | 13 | 216 | 643058 | 1251.1 | 2369 | 2299 | 512.2 |
| D | 1 | 5 | 459370 | 892.44 | 2369 | 2299 | 512.2 |
| D | 7 | 85 | 244874 | 473.63 | 2369 | 2299 | 512.2 |
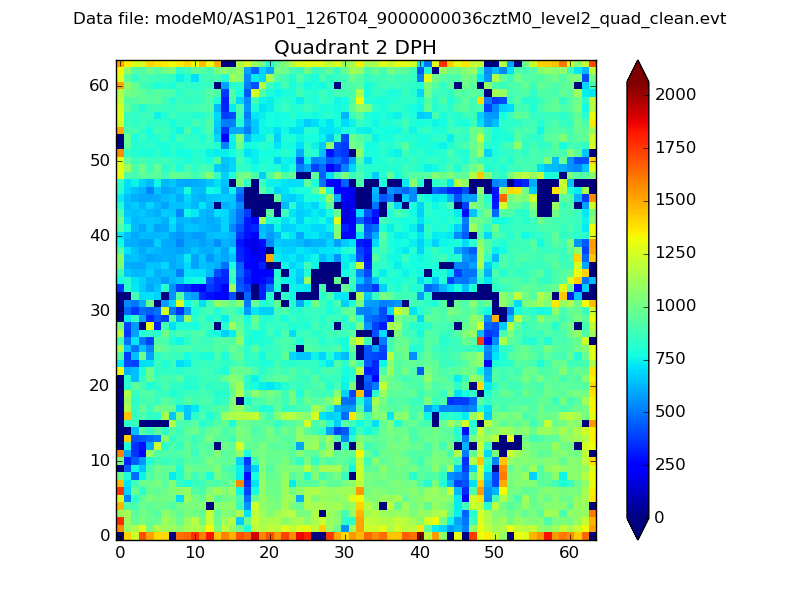
Histogram calculated using DETX and DETY for each event in the final _common_clean file
| Quadrant A |  |
 |
Quadrant B |
|---|---|---|---|
| Quadrant D |  |
 |
Quadrant C |
| Plot type | Count rate plots | Images |
|---|---|---|
| Comparison with Poisson distribution Blue bars denote a histogram of data divided into 1 sec bins. Red curve is a Poisson curve with rate = median count rate of data. |
 |
 |
| Quadrant-wise count rates Data is divided into 100 sec bins |
 |
|
| Module-wise count rates for Quadrant A Data is divided into 100 sec bins |
 |
 |
| Module-wise count rates for Quadrant B Data is divided into 100 sec bins |
 |
 |
| Module-wise count rates for Quadrant C Data is divided into 100 sec bins |
 |
 |
| Module-wise count rates for Quadrant D Data is divided into 100 sec bins |
 |
 |
| Parameter | Plot |
|---|---|
| CZT HV Monitor |  |
| D_VDD | 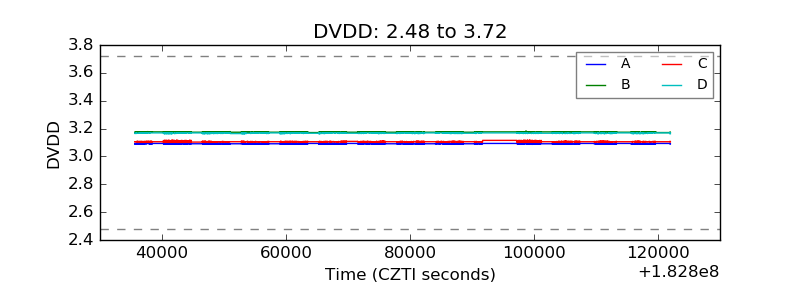 |
| Temperature 1 |  |
| Veto HV Monitor |  |
| Veto LLD |  |
| Alpha Counter |  |
| _CPM_Rate |  |
| CZT Counter |  |
| +2.5 Volts monitor |  |
| +5 Volts monitor |  |
| Veto Counter |  |