| Param | Original file | Final file |
|---|---|---|
| Filename | modeM0/AS1P01_162T09_9000000042cztM0_level2_bc.evt | modeM0/AS1P01_162T09_9000000042cztM0_level2_quad_clean.evt |
| Size (bytes) | 3,443,627,520 | 1,016,867,520 |
| Size | 3.2 GB | 969.8 MB |
| Events in quadrant A | 22,052,842 | 6,098,365 |
| Events in quadrant B | 29,050,228 | 6,108,723 |
| Events in quadrant C | 21,372,038 | 6,114,130 |
| Events in quadrant D | 25,291,142 | 5,909,023 |
| Mode M0 | |||
|---|---|---|---|
| Quadrant | BADHDUFLAG | Total packets | Discarded packets |
| A | 0 | 420369 | 0 |
| B | 0 | 435672 | 0 |
| C | 0 | 387732 | 0 |
| D | 0 | 382649 | 0 |
| Mode M9 | |||
|---|---|---|---|
| Quadrant | BADHDUFLAG | Total packets | Discarded packets |
| A | 0 | 538 | 0 |
| B | 0 | 538 | 0 |
| C | 0 | 538 | 0 |
| D | 0 | 538 | 0 |
| Mode SS | |||
|---|---|---|---|
| Quadrant | BADHDUFLAG | Total packets | Discarded packets |
| A | 0 | 1960 | 0 |
| B | 0 | 1960 | 0 |
| C | 0 | 1960 | 0 |
| D | 0 | 1960 | 0 |
| Quadrant | Total seconds | Saturated seconds | Saturation percentage |
|---|---|---|---|
| A | 95847 | 896 | 0.934823% |
| B | 95847 | 1106 | 1.153922% |
| C | 95847 | 206 | 0.214926% |
| D | 95847 | 900 | 0.938997% |
Noise dominated data is calculated using 1-second bins in cleaned event files. If a bin has >2000 counts, and if more than 50% of those come from <1% of pixels, then it is considered to be noise-dominated and hence unusable.
| Quadrant | # 1 sec bins | Bins with >0 counts | Bins with >2000 counts | High rate bins dominated by noise | Noise dominated (total time) | Noise dominated (detector-on time) | Marked lightcurve |
|---|---|---|---|---|---|---|---|
| A | 149401 | 95847 | 142 | 142 | 0.10% | 0.15% | 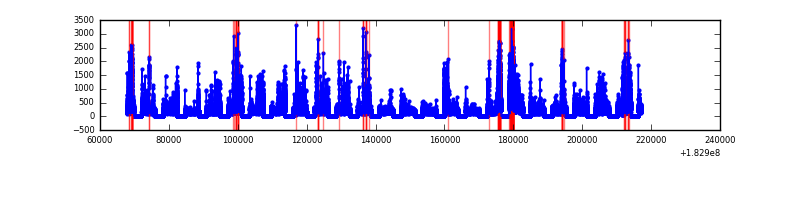 |
| B | 149401 | 95847 | 205 | 205 | 0.14% | 0.21% |  |
| C | 149401 | 95847 | 61 | 61 | 0.04% | 0.06% |  |
| D | 149401 | 95848 | 373 | 373 | 0.25% | 0.39% | 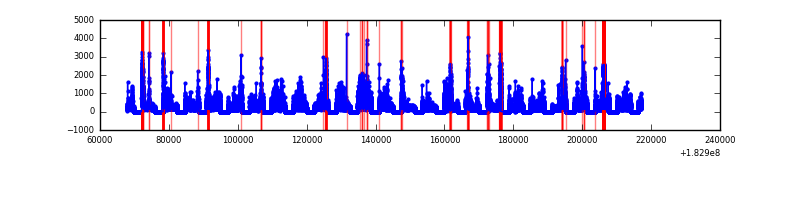 |
Top three noisy pixels from each quadrant. If the there are fewer than three noisy pixels in the level2.evt file, extra rows are filled as -1
| Pixel properties | Quadrant properties | ||||||
|---|---|---|---|---|---|---|---|
| Quadrant | DetID | PixID | Counts | Sigma | Mean | Median | Sigma |
| A | 15 | 127 | 2334186 | 2835.75 | 3947 | 3860 | 821.8 |
| A | 12 | 236 | 1090488 | 1322.31 | 3947 | 3860 | 821.8 |
| A | 0 | 69 | 967508 | 1172.65 | 3947 | 3860 | 821.8 |
| B | 2 | 2 | 8102585 | 11191.85 | 4031 | 3900 | 723.6 |
| B | 0 | 220 | 952472 | 1310.86 | 4031 | 3900 | 723.6 |
| B | 4 | 67 | 499332 | 684.65 | 4031 | 3900 | 723.6 |
| C | 1 | 1 | 2046540 | 2425.21 | 3932 | 3850 | 842.3 |
| C | 9 | 204 | 1531980 | 1814.29 | 3932 | 3850 | 842.3 |
| C | 5 | 234 | 1051656 | 1244.02 | 3932 | 3850 | 842.3 |
| D | 4 | 114 | 2903029 | 3334.02 | 3914 | 3796 | 869.6 |
| D | 2 | 72 | 1000340 | 1145.99 | 3914 | 3796 | 869.6 |
| D | 9 | 82 | 782262 | 895.21 | 3914 | 3796 | 869.6 |
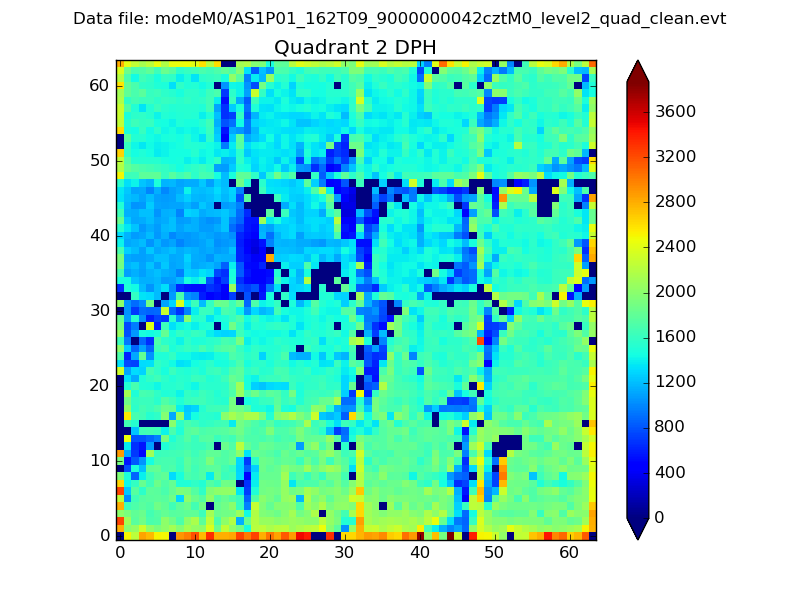
Histogram calculated using DETX and DETY for each event in the final _common_clean file
| Quadrant A | 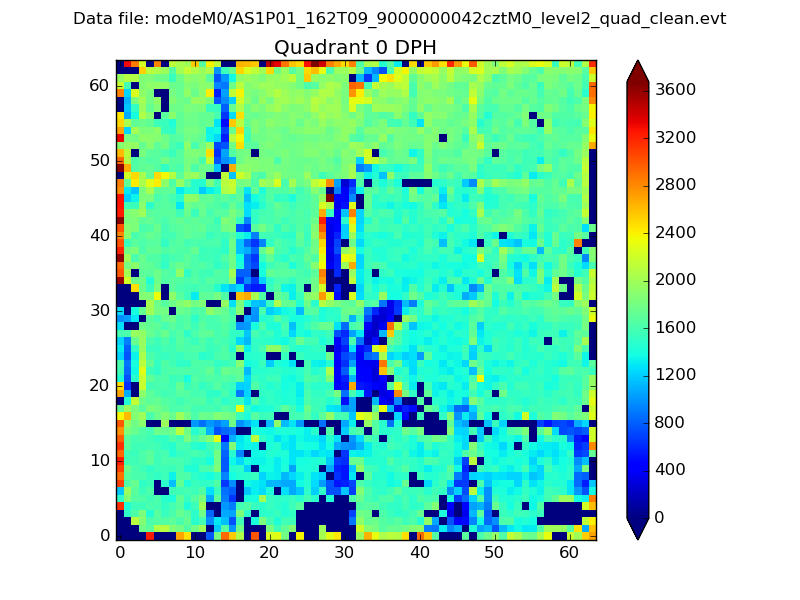 |
 |
Quadrant B |
|---|---|---|---|
| Quadrant D | 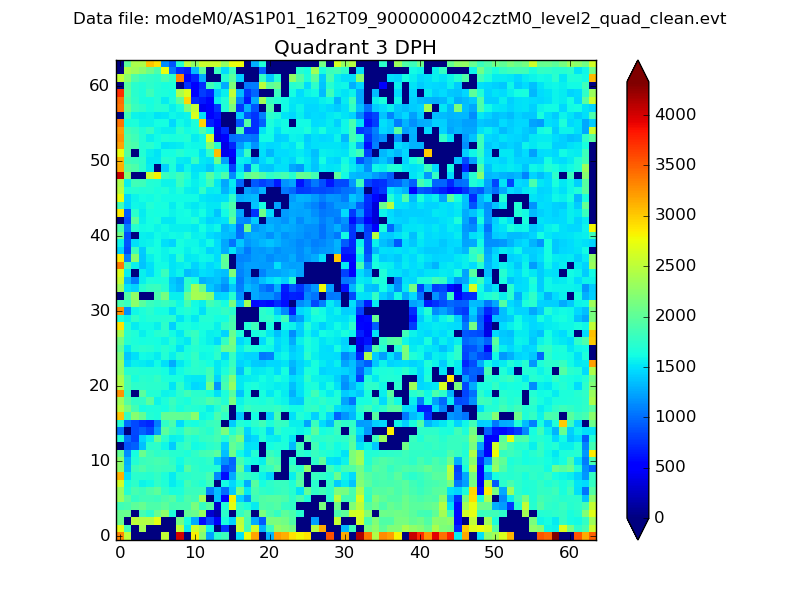 |
 |
Quadrant C |
| Plot type | Count rate plots | Images |
|---|---|---|
| Comparison with Poisson distribution Blue bars denote a histogram of data divided into 1 sec bins. Red curve is a Poisson curve with rate = median count rate of data. |
 |
 |
| Quadrant-wise count rates Data is divided into 100 sec bins |
 |
|
| Module-wise count rates for Quadrant A Data is divided into 100 sec bins |
 |
 |
| Module-wise count rates for Quadrant B Data is divided into 100 sec bins |
 |
 |
| Module-wise count rates for Quadrant C Data is divided into 100 sec bins |
 |
 |
| Module-wise count rates for Quadrant D Data is divided into 100 sec bins |
 |
 |
| Parameter | Plot |
|---|---|
| CZT HV Monitor |  |
| D_VDD | 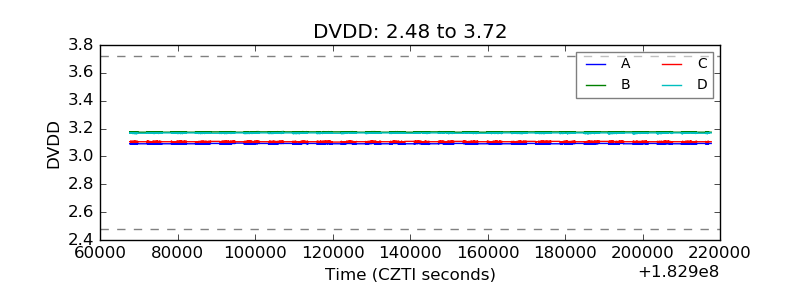 |
| Temperature 1 |  |
| Veto HV Monitor |  |
| Veto LLD |  |
| Alpha Counter |  |
| _CPM_Rate |  |
| CZT Counter |  |
| +2.5 Volts monitor |  |
| +5 Volts monitor |  |
| Veto Counter | 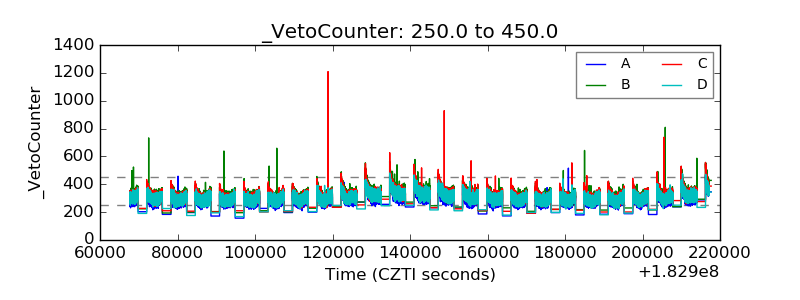 |