| Param | Original file | Final file |
|---|---|---|
| Filename | modeM0/AS1P01_161T02_9000000066cztM0_level2_bc.evt | modeM0/AS1P01_161T02_9000000066cztM0_level2_quad_clean.evt |
| Size (bytes) | 815,143,680 | 242,406,720 |
| Size | 777.4 MB | 231.2 MB |
| Events in quadrant A | 5,720,658 | 1,409,970 |
| Events in quadrant B | 4,676,747 | 1,418,532 |
| Events in quadrant C | 6,322,314 | 1,405,115 |
| Events in quadrant D | 6,237,357 | 1,367,801 |
| Mode M0 | |||
|---|---|---|---|
| Quadrant | BADHDUFLAG | Total packets | Discarded packets |
| A | 0 | 108451 | 0 |
| B | 0 | 103589 | 0 |
| C | 0 | 103822 | 0 |
| D | 0 | 98446 | 0 |
| Mode SS | |||
|---|---|---|---|
| Quadrant | BADHDUFLAG | Total packets | Discarded packets |
| A | 0 | 518 | 0 |
| B | 0 | 518 | 0 |
| C | 0 | 518 | 0 |
| D | 0 | 518 | 0 |
| Mode M9 | |||
|---|---|---|---|
| Quadrant | BADHDUFLAG | Total packets | Discarded packets |
| A | 0 | 123 | 0 |
| B | 0 | 123 | 0 |
| C | 0 | 123 | 0 |
| D | 0 | 124 | 0 |
| Quadrant | Total seconds | Saturated seconds | Saturation percentage |
|---|---|---|---|
| A | 25294 | 66 | 0.260931% |
| B | 25294 | 17 | 0.067210% |
| C | 25294 | 150 | 0.593026% |
| D | 25294 | 145 | 0.573258% |
Noise dominated data is calculated using 1-second bins in cleaned event files. If a bin has >2000 counts, and if more than 50% of those come from <1% of pixels, then it is considered to be noise-dominated and hence unusable.
| Quadrant | # 1 sec bins | Bins with >0 counts | Bins with >2000 counts | High rate bins dominated by noise | Noise dominated (total time) | Noise dominated (detector-on time) | Marked lightcurve |
|---|---|---|---|---|---|---|---|
| A | 40818 | 25294 | 8 | 8 | 0.02% | 0.03% |  |
| B | 40818 | 25294 | 3 | 3 | 0.01% | 0.01% |  |
| C | 40818 | 25294 | 36 | 36 | 0.09% | 0.14% |  |
| D | 40818 | 25294 | 21 | 21 | 0.05% | 0.08% | 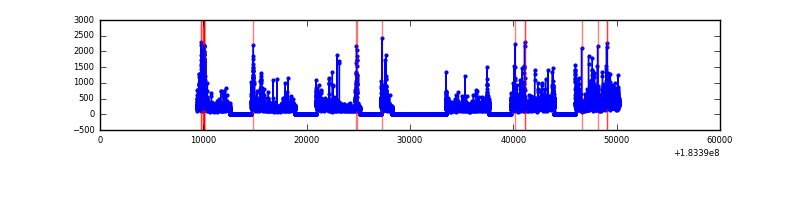 |
Top three noisy pixels from each quadrant. If the there are fewer than three noisy pixels in the level2.evt file, extra rows are filled as -1
| Pixel properties | Quadrant properties | ||||||
|---|---|---|---|---|---|---|---|
| Quadrant | DetID | PixID | Counts | Sigma | Mean | Median | Sigma |
| A | 0 | 238 | 668825 | 3038.03 | 1029 | 1006 | 219.8 |
| A | 0 | 69 | 239142 | 1083.32 | 1029 | 1006 | 219.8 |
| A | 12 | 243 | 185348 | 838.61 | 1029 | 1006 | 219.8 |
| B | 0 | 220 | 110849 | 567.7 | 1054 | 1020 | 193.5 |
| B | 5 | 46 | 62754 | 319.1 | 1054 | 1020 | 193.5 |
| B | 4 | 82 | 50892 | 257.79 | 1054 | 1020 | 193.5 |
| C | 1 | 1 | 1066502 | 4749.99 | 1030 | 1010 | 224.3 |
| C | 3 | 159 | 415956 | 1849.84 | 1030 | 1010 | 224.3 |
| C | 2 | 53 | 367095 | 1632.02 | 1030 | 1010 | 224.3 |
| D | 13 | 7 | 343812 | 1500.66 | 1020 | 991 | 228.4 |
| D | 13 | 221 | 259825 | 1133.02 | 1020 | 991 | 228.4 |
| D | 1 | 4 | 137533 | 597.7 | 1020 | 991 | 228.4 |
Histogram calculated using DETX and DETY for each event in the final _common_clean file
| Quadrant A | 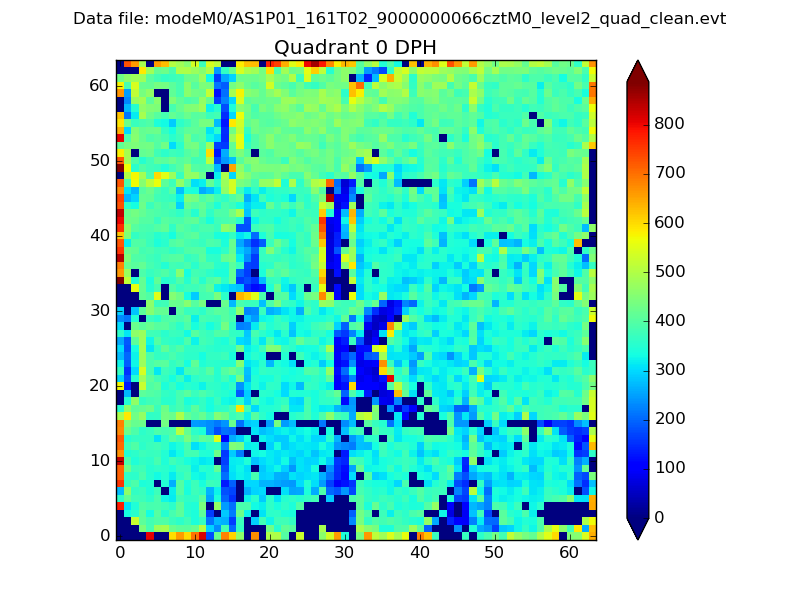 |
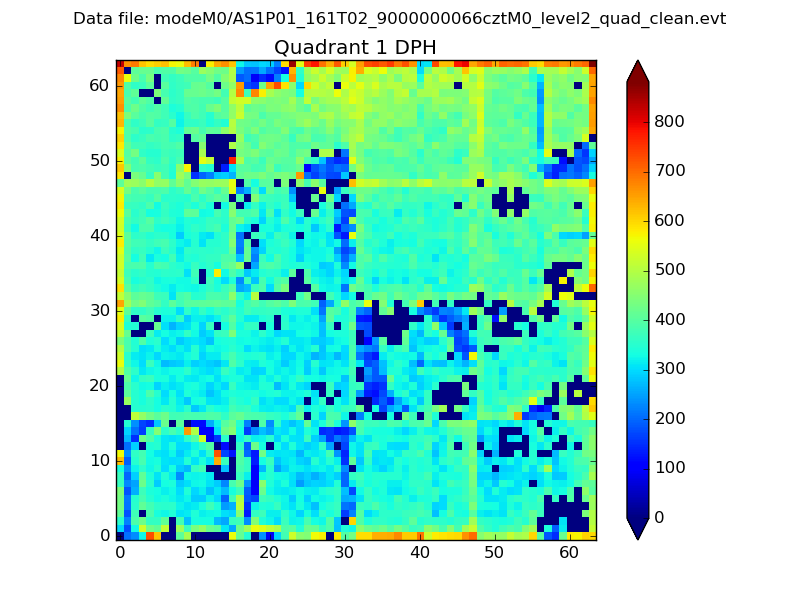 |
Quadrant B |
|---|---|---|---|
| Quadrant D | 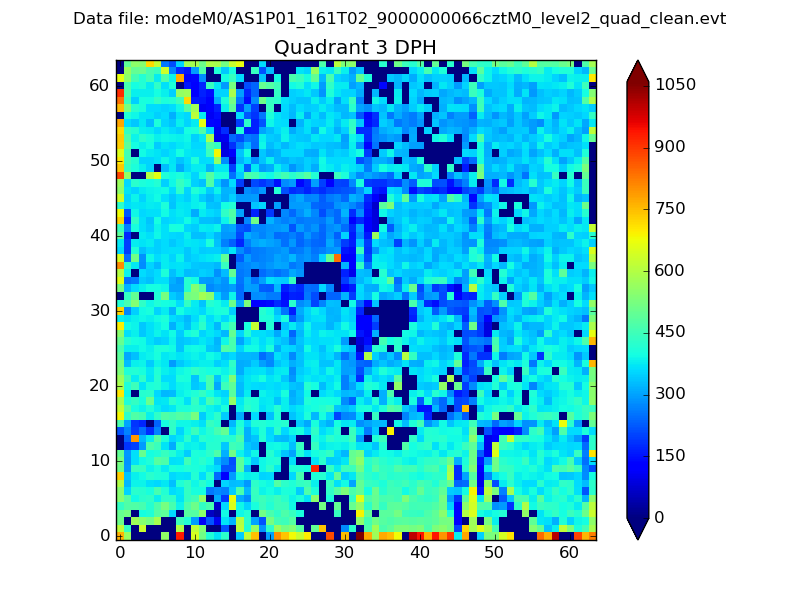 |
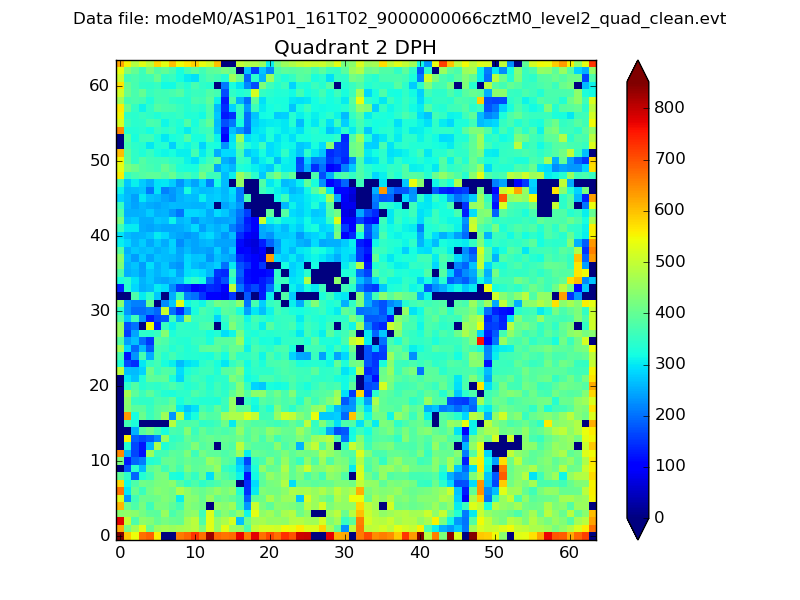 |
Quadrant C |
| Plot type | Count rate plots | Images |
|---|---|---|
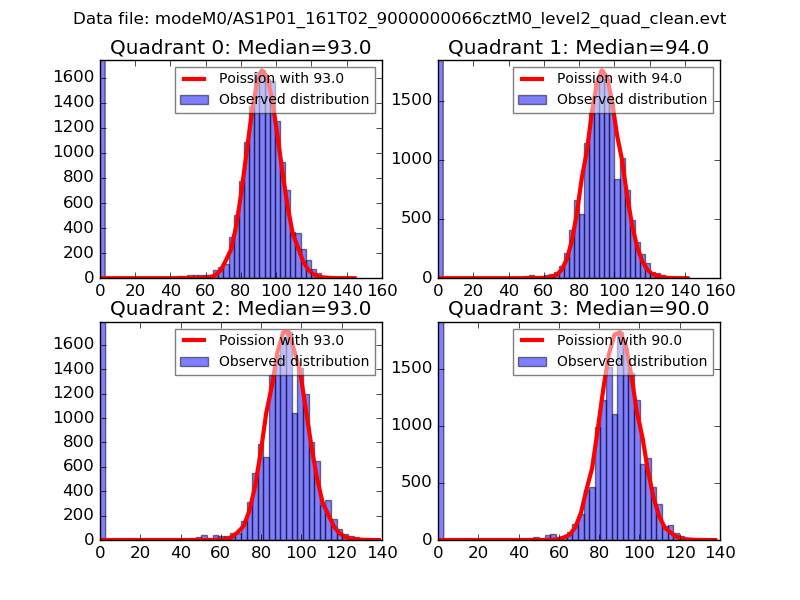
| Comparison with Poisson distribution Blue bars denote a histogram of data divided into 1 sec bins. Red curve is a Poisson curve with rate = median count rate of data. |
 |
 |
| Quadrant-wise count rates Data is divided into 100 sec bins |
 |
|
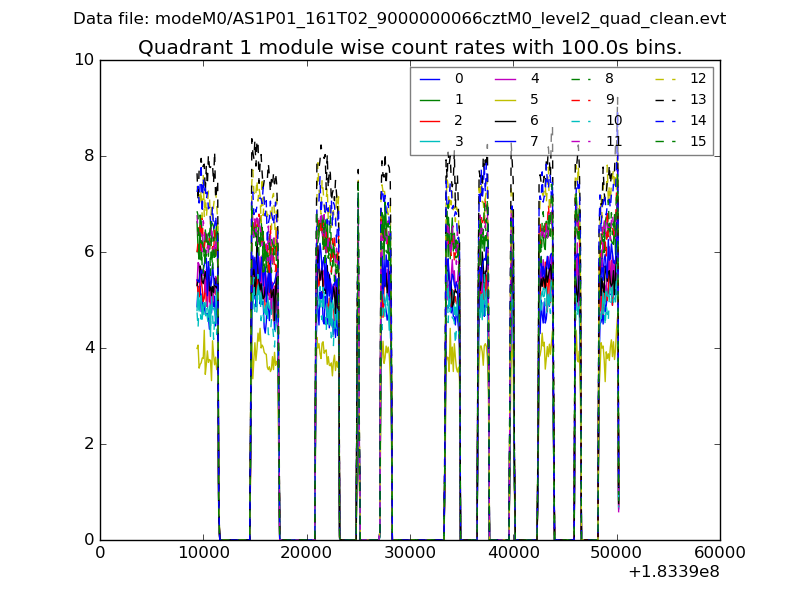
| Module-wise count rates for Quadrant A Data is divided into 100 sec bins |
 |
 |
| Module-wise count rates for Quadrant B Data is divided into 100 sec bins |
 |
 |
| Module-wise count rates for Quadrant C Data is divided into 100 sec bins |
 |
 |
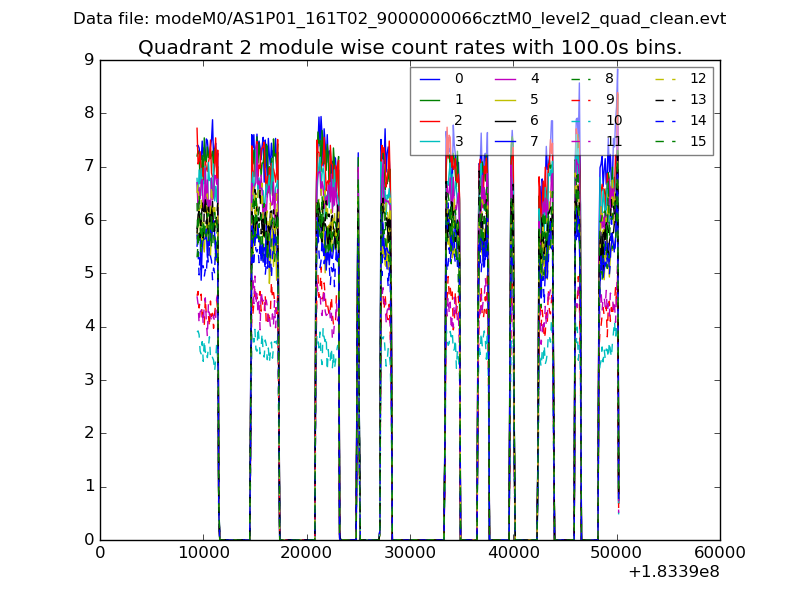
| Module-wise count rates for Quadrant D Data is divided into 100 sec bins |
 |
 |
| Parameter | Plot |
|---|---|
| CZT HV Monitor |  |
| D_VDD | 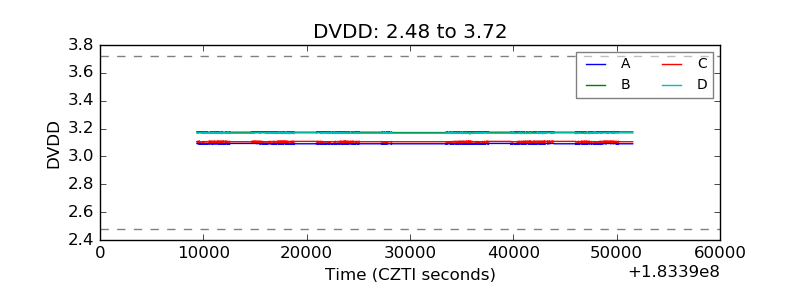 |
| Temperature 1 |  |
| Veto HV Monitor |  |
| Veto LLD |  |
| Alpha Counter |  |
| _CPM_Rate |  |
| CZT Counter |  |
| +2.5 Volts monitor |  |
| +5 Volts monitor | 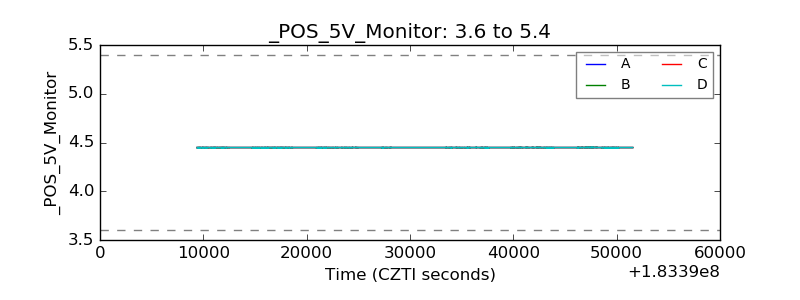 |
| Veto Counter |  |