| Param | Original file | Final file |
|---|---|---|
| Filename | modeM0/AS1P01_161T04_9000000060cztM0_level2_bc.evt | modeM0/AS1P01_161T04_9000000060cztM0_level2_quad_clean.evt |
| Size (bytes) | 58,538,880 | 21,925,440 |
| Size | 55.8 MB | 20.9 MB |
| Events in quadrant A | 302,120 | 141,204 |
| Events in quadrant B | 286,819 | 143,077 |
| Events in quadrant C | 273,855 | 139,782 |
| Events in quadrant D | 803,487 | 132,151 |
| Mode M0 | |||
|---|---|---|---|
| Quadrant | BADHDUFLAG | Total packets | Discarded packets |
| A | 0 | 6059 | 0 |
| B | 0 | 5914 | 0 |
| C | 0 | 5536 | 0 |
| D | 0 | 7406 | 0 |
| Mode SS | |||
|---|---|---|---|
| Quadrant | BADHDUFLAG | Total packets | Discarded packets |
| A | 0 | 28 | 0 |
| B | 0 | 28 | 0 |
| C | 0 | 28 | 0 |
| D | 0 | 28 | 0 |
| Quadrant | Total seconds | Saturated seconds | Saturation percentage |
|---|---|---|---|
| A | 1448 | 2 | 0.138122% |
| B | 1448 | 2 | 0.138122% |
| C | 1448 | 2 | 0.138122% |
| D | 1448 | 59 | 4.074586% |
Noise dominated data is calculated using 1-second bins in cleaned event files. If a bin has >2000 counts, and if more than 50% of those come from <1% of pixels, then it is considered to be noise-dominated and hence unusable.
| Quadrant | # 1 sec bins | Bins with >0 counts | Bins with >2000 counts | High rate bins dominated by noise | Noise dominated (total time) | Noise dominated (detector-on time) | Marked lightcurve |
|---|---|---|---|---|---|---|---|
| A | 1448 | 1448 | 0 | 0 | 0.00% | 0.00% | 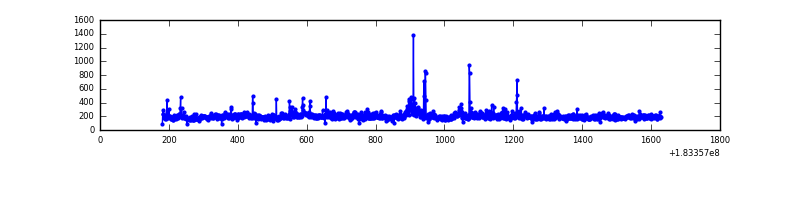 |
| B | 1448 | 1448 | 0 | 0 | 0.00% | 0.00% | 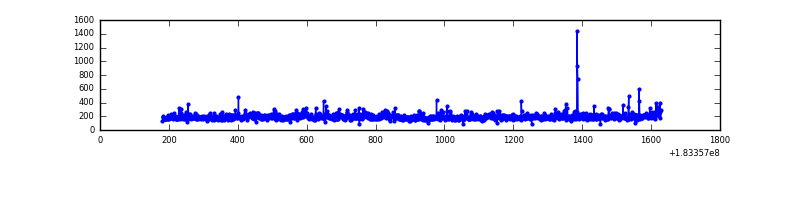 |
| C | 1448 | 1448 | 0 | 0 | 0.00% | 0.00% |  |
| D | 1448 | 1448 | 16 | 16 | 1.10% | 1.10% |  |
Top three noisy pixels from each quadrant. If the there are fewer than three noisy pixels in the level2.evt file, extra rows are filled as -1
| Pixel properties | Quadrant properties | ||||||
|---|---|---|---|---|---|---|---|
| Quadrant | DetID | PixID | Counts | Sigma | Mean | Median | Sigma |
| A | 0 | 238 | 27565 | 1805.02 | 62 | 60 | 15.2 |
| A | 15 | 200 | 9340 | 609.0 | 62 | 60 | 15.2 |
| A | 12 | 243 | 5218 | 338.49 | 62 | 60 | 15.2 |
| B | 4 | 82 | 16610 | 1172.28 | 63 | 62 | 14.1 |
| B | 0 | 23 | 3341 | 232.29 | 63 | 62 | 14.1 |
| B | 15 | 82 | 3149 | 218.69 | 63 | 62 | 14.1 |
| C | 3 | 159 | 22118 | 1423.04 | 61 | 59 | 15.5 |
| C | 3 | 9 | 5404 | 344.81 | 61 | 59 | 15.5 |
| C | 5 | 234 | 3350 | 212.3 | 61 | 59 | 15.5 |
| D | 13 | 7 | 321503 | 20694.79 | 59 | 57 | 15.5 |
| D | 1 | 4 | 83408 | 5366.16 | 59 | 57 | 15.5 |
| D | 7 | 85 | 43198 | 2777.43 | 59 | 57 | 15.5 |
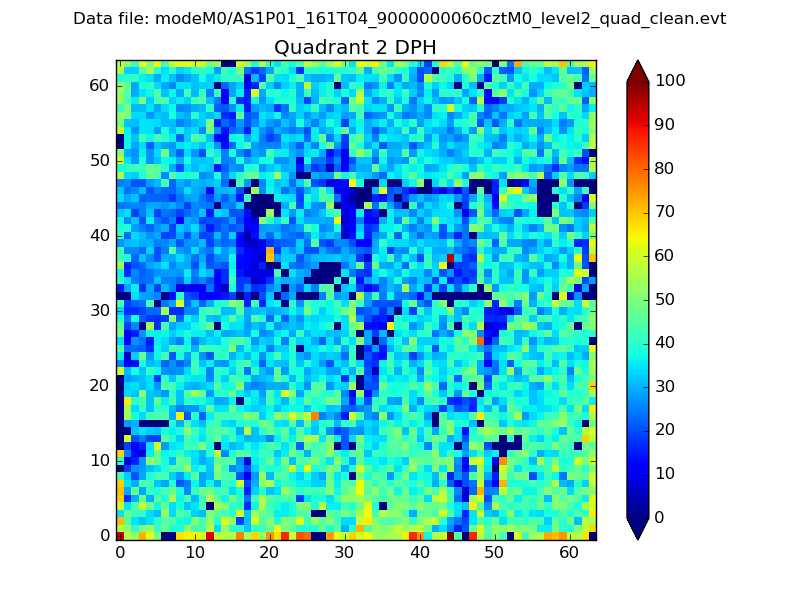
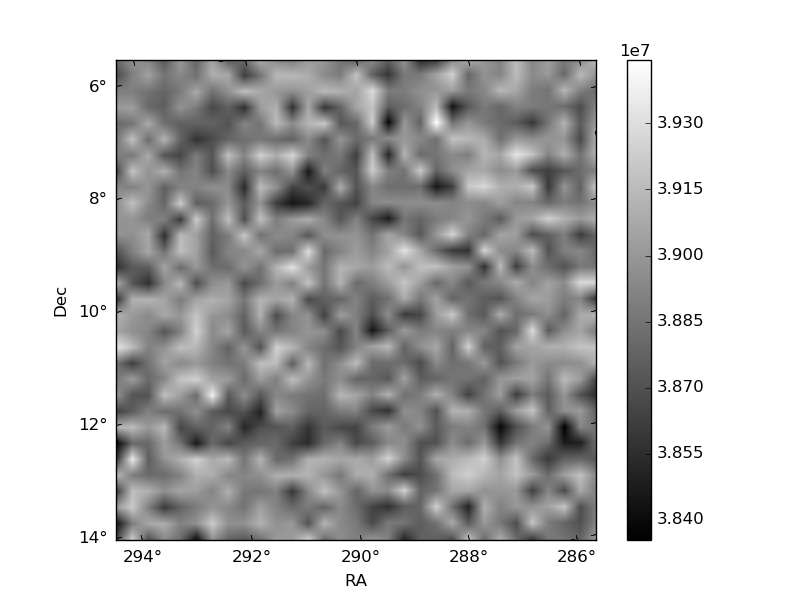
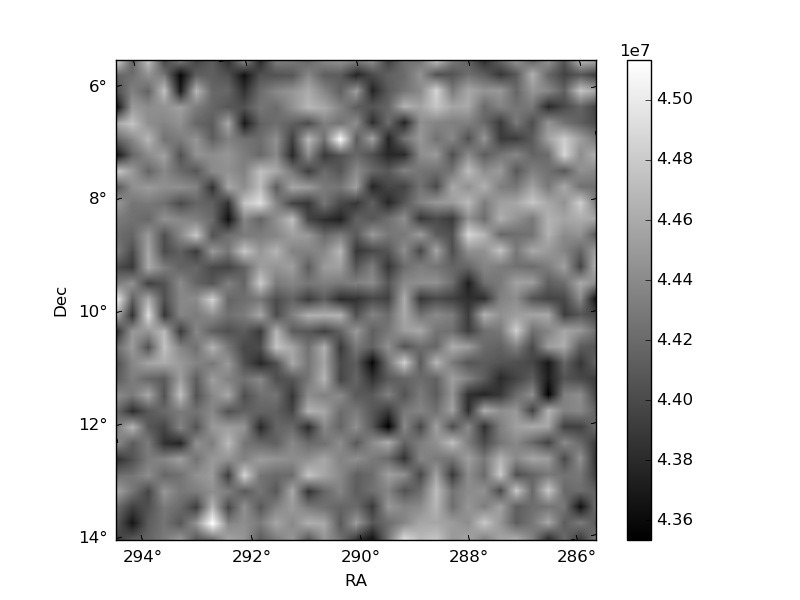
Histogram calculated using DETX and DETY for each event in the final _common_clean file
| Quadrant A | 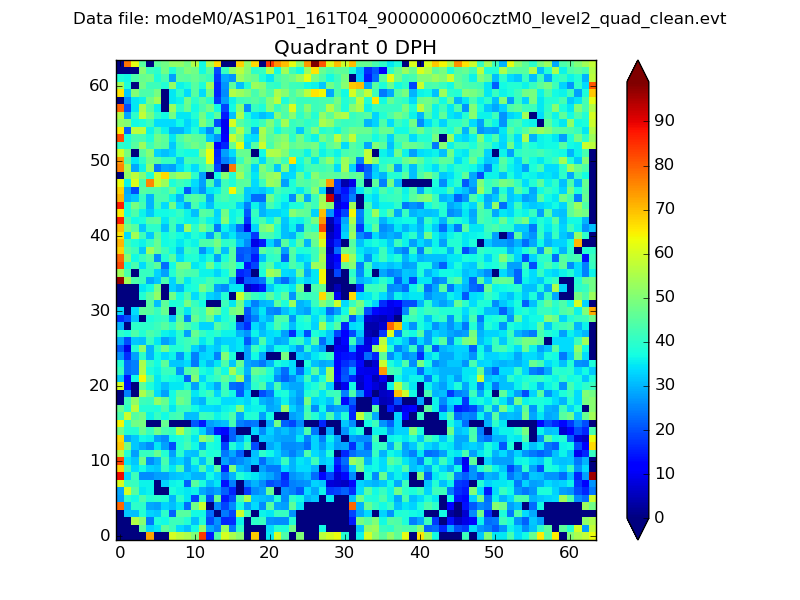 |
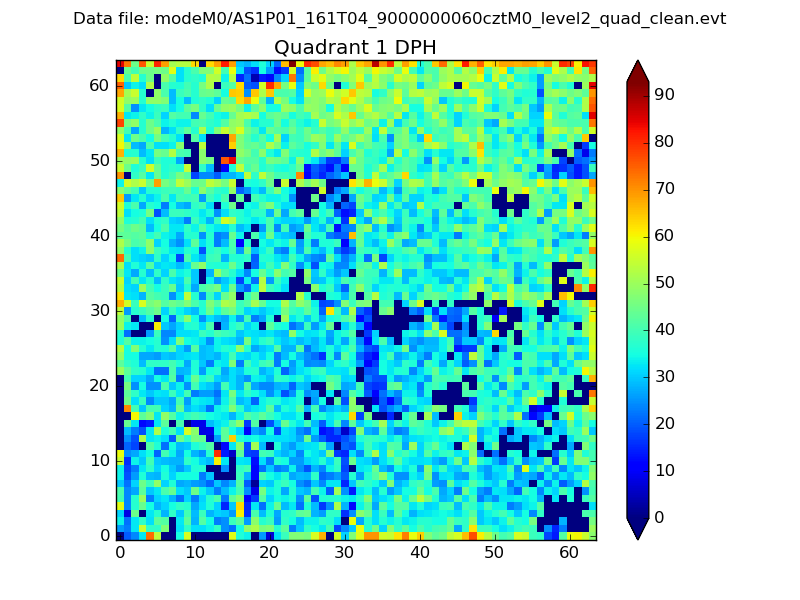 |
Quadrant B |
|---|---|---|---|
| Quadrant D |  |
 |
Quadrant C |
| Plot type | Count rate plots | Images |
|---|---|---|
| Comparison with Poisson distribution Blue bars denote a histogram of data divided into 1 sec bins. Red curve is a Poisson curve with rate = median count rate of data. |
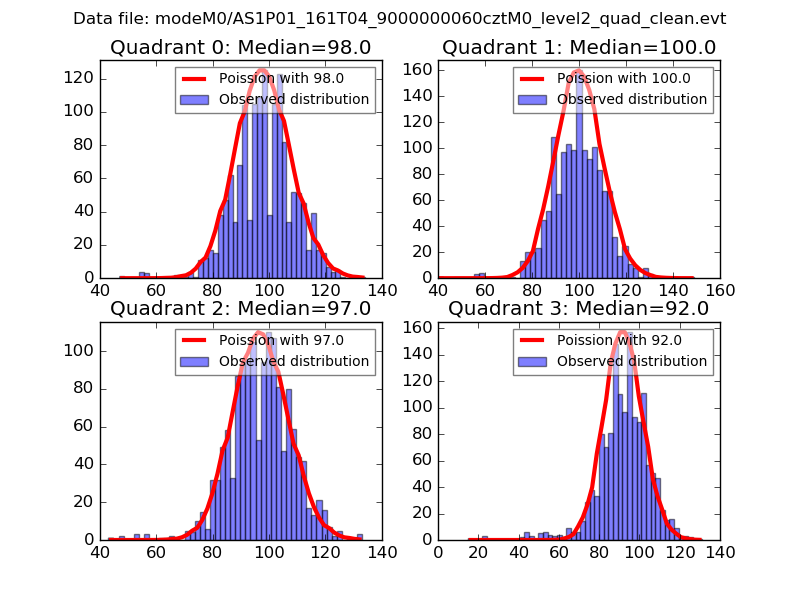 |
 |
| Quadrant-wise count rates Data is divided into 100 sec bins |
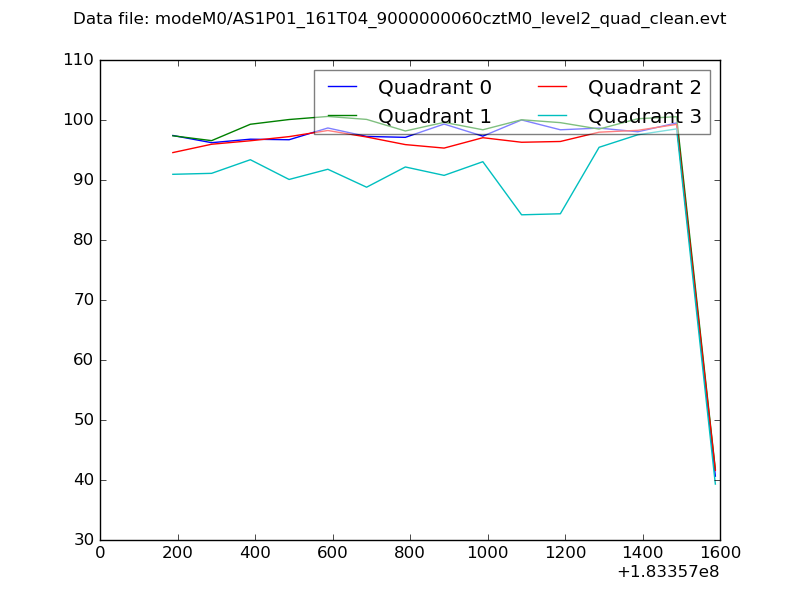 |
|
| Module-wise count rates for Quadrant A Data is divided into 100 sec bins |
 |
 |
| Module-wise count rates for Quadrant B Data is divided into 100 sec bins |
 |
 |
| Module-wise count rates for Quadrant C Data is divided into 100 sec bins |
 |
 |
| Module-wise count rates for Quadrant D Data is divided into 100 sec bins |
 |
 |
| Parameter | Plot |
|---|---|
| CZT HV Monitor |  |
| D_VDD |  |
| Temperature 1 | 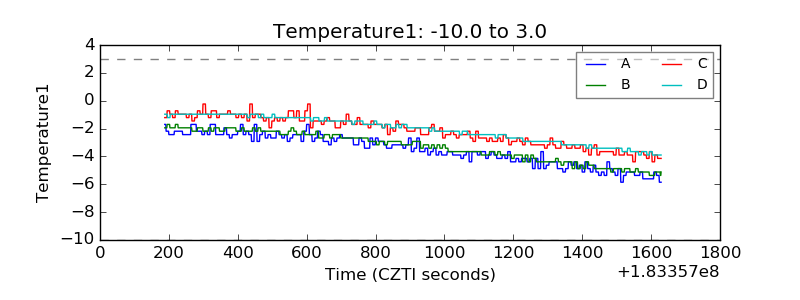 |
| Veto HV Monitor | 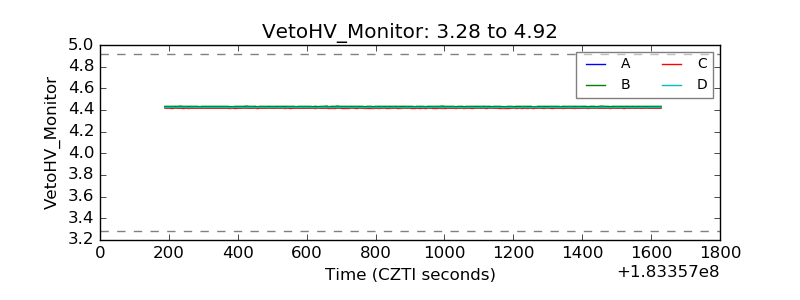 |
| Veto LLD |  |
| Alpha Counter |  |
| _CPM_Rate |  |
| CZT Counter |  |
| +2.5 Volts monitor |  |
| +5 Volts monitor |  |
| _ROLL_ROT | 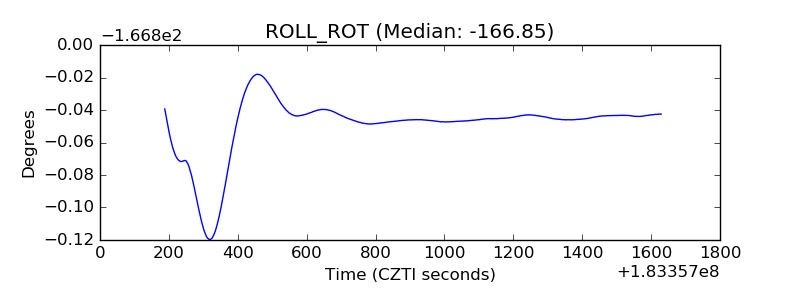 |
| _Roll_DEC | 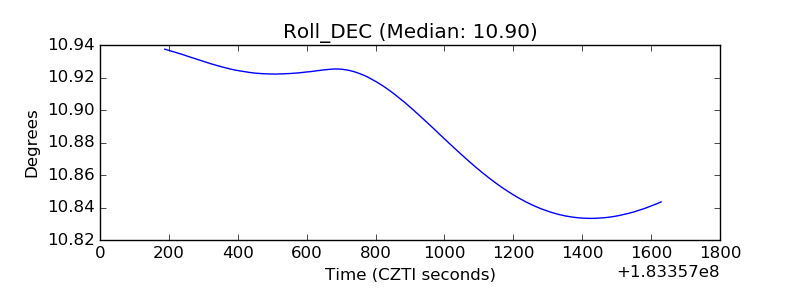 |
| _Roll_RA |  |
| Veto Counter |  |