| Param | Original file | Final file |
|---|---|---|
| Filename | modeM0/AS1P01_161T03_9000000070cztM0_level2_bc.evt | modeM0/AS1P01_161T03_9000000070cztM0_level2_quad_clean.evt |
| Size (bytes) | 944,789,760 | 246,110,400 |
| Size | 901.0 MB | 234.7 MB |
| Events in quadrant A | 5,915,678 | 1,364,660 |
| Events in quadrant B | 5,993,928 | 1,367,223 |
| Events in quadrant C | 5,890,542 | 1,352,434 |
| Events in quadrant D | 8,760,884 | 1,304,729 |
| Mode M0 | |||
|---|---|---|---|
| Quadrant | BADHDUFLAG | Total packets | Discarded packets |
| A | 0 | 126689 | 0 |
| B | 0 | 126448 | 0 |
| C | 0 | 119435 | 0 |
| D | 0 | 122908 | 0 |
| Mode M9 | |||
|---|---|---|---|
| Quadrant | BADHDUFLAG | Total packets | Discarded packets |
| A | 0 | 130 | 0 |
| B | 0 | 130 | 0 |
| C | 0 | 130 | 0 |
| D | 0 | 130 | 0 |
| Mode SS | |||
|---|---|---|---|
| Quadrant | BADHDUFLAG | Total packets | Discarded packets |
| A | 0 | 614 | 0 |
| B | 0 | 614 | 0 |
| C | 0 | 614 | 0 |
| D | 0 | 614 | 0 |
| Quadrant | Total seconds | Saturated seconds | Saturation percentage |
|---|---|---|---|
| A | 30033 | 24 | 0.079912% |
| B | 30033 | 61 | 0.203110% |
| C | 30033 | 40 | 0.133187% |
| D | 30033 | 134 | 0.446176% |
Noise dominated data is calculated using 1-second bins in cleaned event files. If a bin has >2000 counts, and if more than 50% of those come from <1% of pixels, then it is considered to be noise-dominated and hence unusable.
| Quadrant | # 1 sec bins | Bins with >0 counts | Bins with >2000 counts | High rate bins dominated by noise | Noise dominated (total time) | Noise dominated (detector-on time) | Marked lightcurve |
|---|---|---|---|---|---|---|---|
| A | 47698 | 30034 | 4 | 4 | 0.01% | 0.01% | 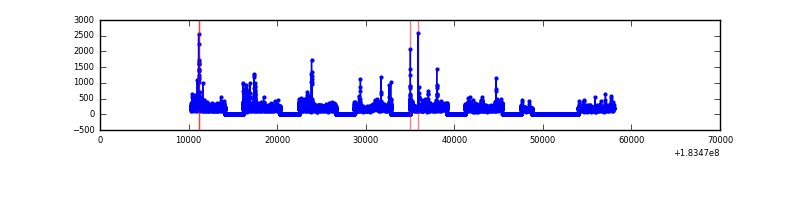 |
| B | 47698 | 30034 | 23 | 23 | 0.05% | 0.08% |  |
| C | 47698 | 30034 | 20 | 20 | 0.04% | 0.07% |  |
| D | 47698 | 30034 | 29 | 29 | 0.06% | 0.10% |  |
Top three noisy pixels from each quadrant. If the there are fewer than three noisy pixels in the level2.evt file, extra rows are filled as -1
| Pixel properties | Quadrant properties | ||||||
|---|---|---|---|---|---|---|---|
| Quadrant | DetID | PixID | Counts | Sigma | Mean | Median | Sigma |
| A | 0 | 238 | 382113 | 1457.04 | 1247 | 1220 | 261.4 |
| A | 12 | 133 | 249732 | 950.64 | 1247 | 1220 | 261.4 |
| A | 12 | 243 | 94679 | 357.51 | 1247 | 1220 | 261.4 |
| B | 2 | 32 | 296172 | 1279.41 | 1275 | 1237 | 230.5 |
| B | 0 | 23 | 149497 | 643.14 | 1275 | 1237 | 230.5 |
| B | 0 | 220 | 88110 | 376.85 | 1275 | 1237 | 230.5 |
| C | 1 | 1 | 681493 | 2559.23 | 1241 | 1217 | 265.8 |
| C | 3 | 159 | 120977 | 450.54 | 1241 | 1217 | 265.8 |
| C | 9 | 206 | 61429 | 226.52 | 1241 | 1217 | 265.8 |
| D | 13 | 7 | 1146237 | 4245.42 | 1229 | 1197 | 269.7 |
| D | 13 | 221 | 662279 | 2451.07 | 1229 | 1197 | 269.7 |
| D | 1 | 5 | 362171 | 1338.37 | 1229 | 1197 | 269.7 |
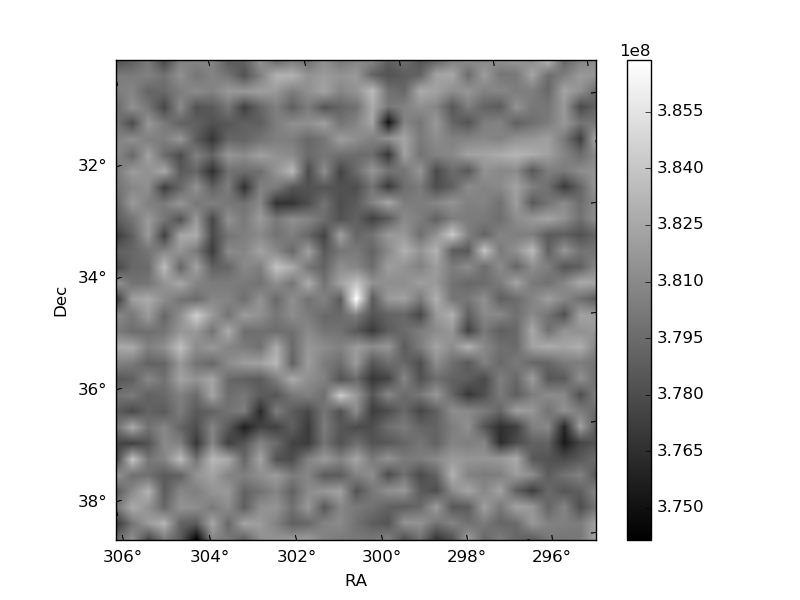
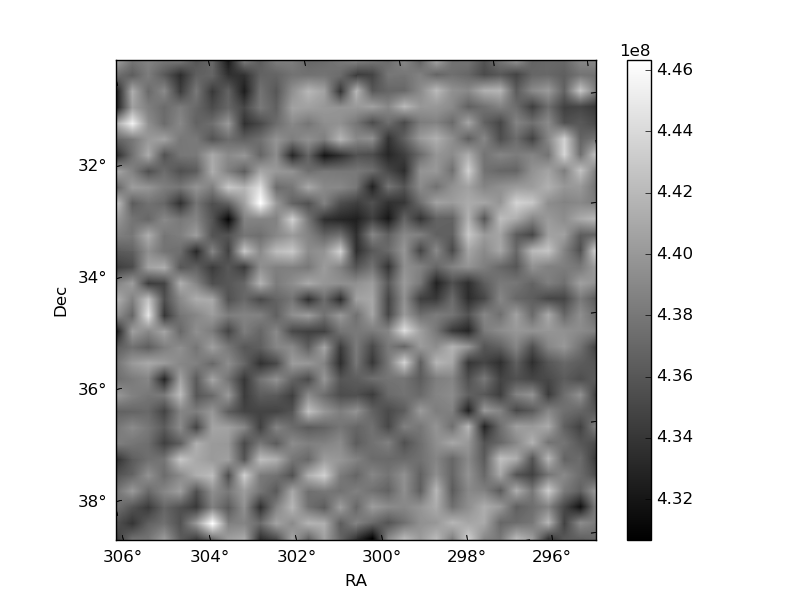
Histogram calculated using DETX and DETY for each event in the final _common_clean file
| Quadrant A | 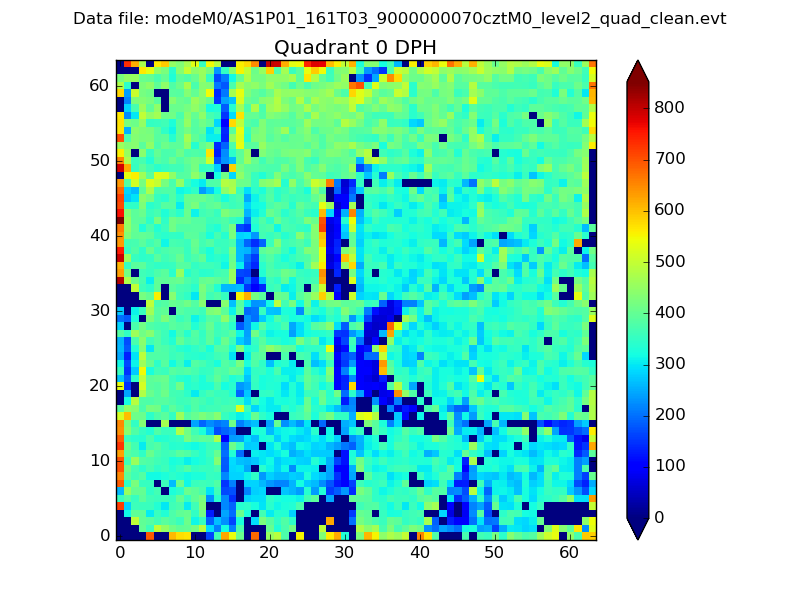 |
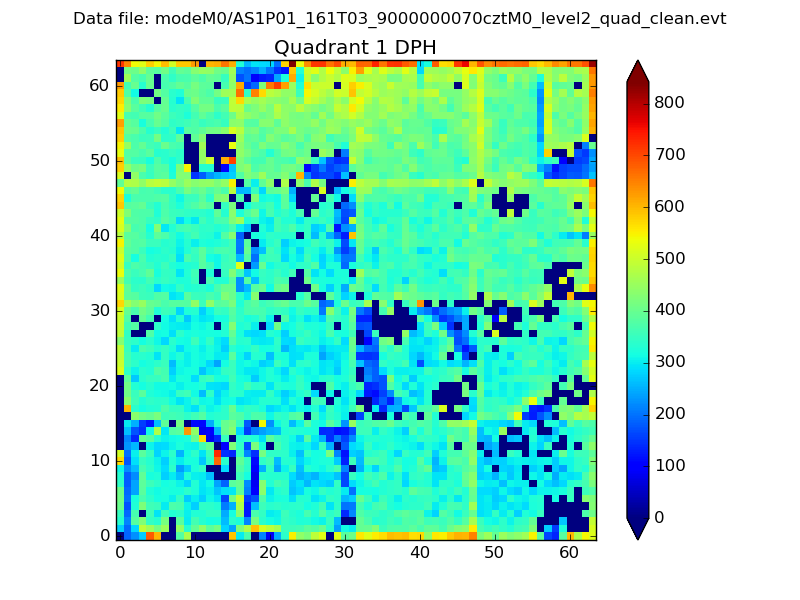 |
Quadrant B |
|---|---|---|---|
| Quadrant D | 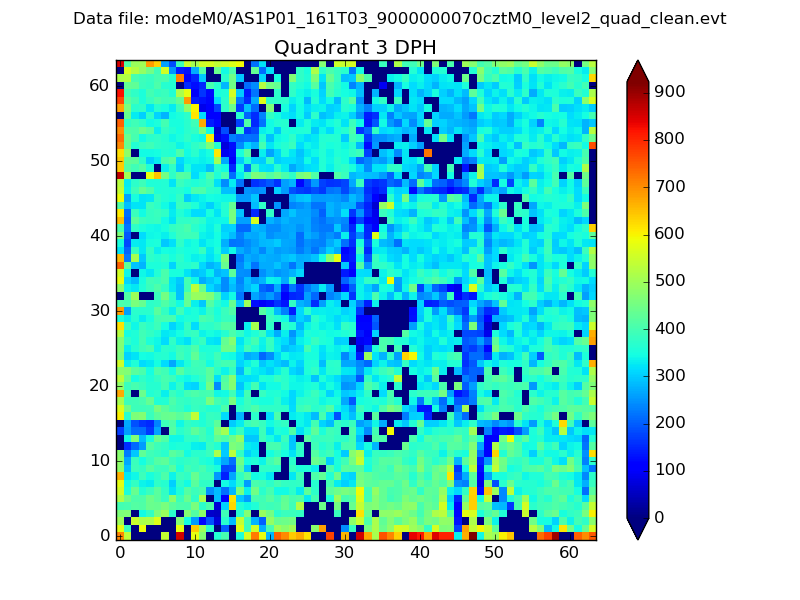 |
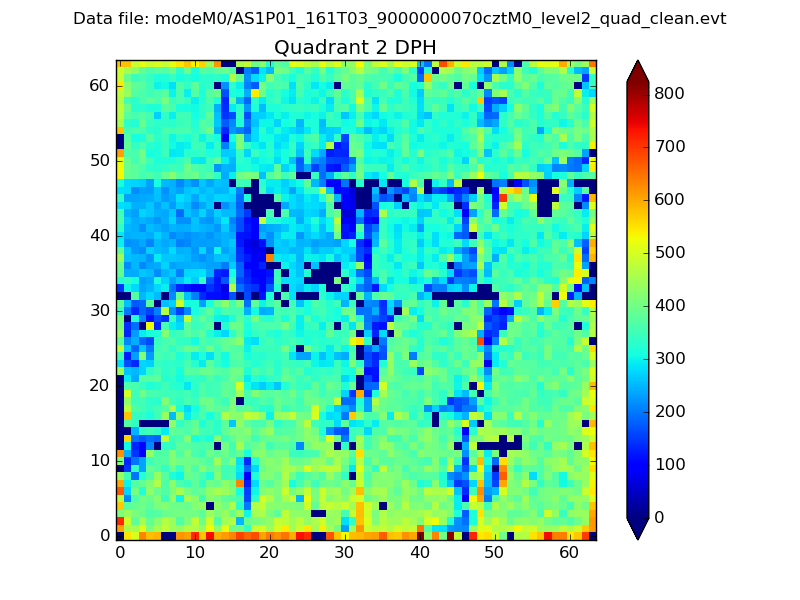 |
Quadrant C |
| Plot type | Count rate plots | Images |
|---|---|---|
| Comparison with Poisson distribution Blue bars denote a histogram of data divided into 1 sec bins. Red curve is a Poisson curve with rate = median count rate of data. |
 |
 |
| Quadrant-wise count rates Data is divided into 100 sec bins |
 |
|
| Module-wise count rates for Quadrant A Data is divided into 100 sec bins |
 |
 |
| Module-wise count rates for Quadrant B Data is divided into 100 sec bins |
 |
 |
| Module-wise count rates for Quadrant C Data is divided into 100 sec bins |
 |
 |
| Module-wise count rates for Quadrant D Data is divided into 100 sec bins |
 |
 |
| Parameter | Plot |
|---|---|
| CZT HV Monitor | 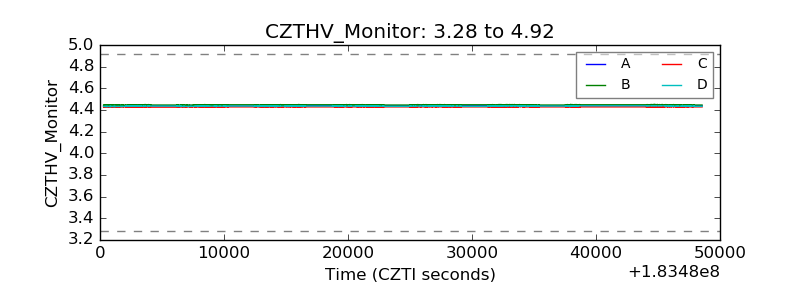 |
| D_VDD | 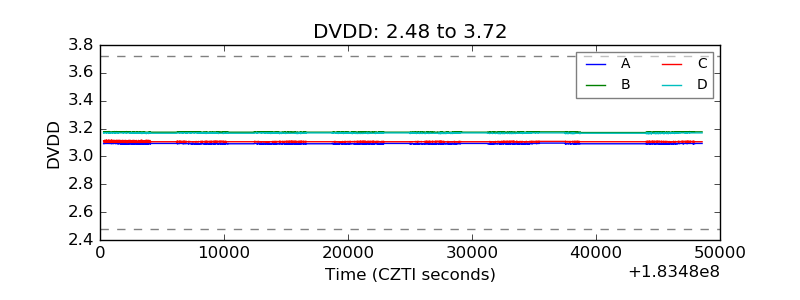 |
| Temperature 1 |  |
| Veto HV Monitor |  |
| Veto LLD | 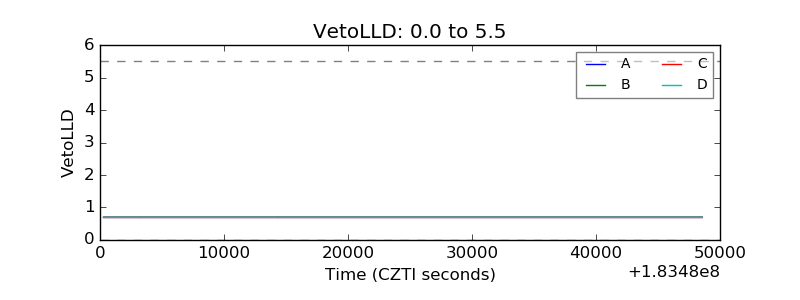 |
| Alpha Counter |  |
| _CPM_Rate |  |
| CZT Counter |  |
| +2.5 Volts monitor | 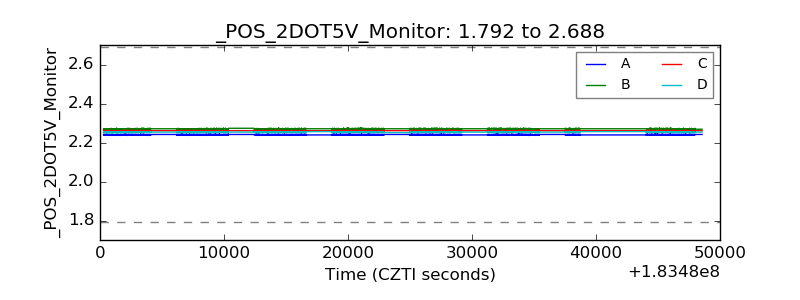 |
| +5 Volts monitor |  |
| Veto Counter |  |