| Param | Original file | Final file |
|---|---|---|
| Filename | modeM0/AS1P01_010T01_9000000112cztM0_level2_bc.evt | modeM0/AS1P01_010T01_9000000112cztM0_level2_quad_clean.evt |
| Size (bytes) | 5,837,857,920 | 2,923,931,520 |
| Size | 5.4 GB | 2.7 GB |
| Events in quadrant A | 36,082,930 | 19,133,184 |
| Events in quadrant B | 42,569,137 | 19,195,912 |
| Events in quadrant C | 38,106,519 | 18,734,028 |
| Events in quadrant D | 46,806,970 | 18,204,516 |
| Mode M0 | |||
|---|---|---|---|
| Quadrant | BADHDUFLAG | Total packets | Discarded packets |
| A | 0 | 823580 | 0 |
| B | 0 | 868511 | 0 |
| C | 0 | 806749 | 0 |
| D | 0 | 793002 | 0 |
| Mode SS | |||
|---|---|---|---|
| Quadrant | BADHDUFLAG | Total packets | Discarded packets |
| A | 0 | 3950 | 0 |
| B | 0 | 3950 | 0 |
| C | 0 | 3950 | 0 |
| D | 0 | 3950 | 0 |
| Mode M9 | |||
|---|---|---|---|
| Quadrant | BADHDUFLAG | Total packets | Discarded packets |
| A | 0 | 290 | 0 |
| B | 0 | 290 | 0 |
| C | 0 | 290 | 0 |
| D | 0 | 290 | 0 |
| Quadrant | Total seconds | Saturated seconds | Saturation percentage |
|---|---|---|---|
| A | 194194 | 1416 | 0.729168% |
| B | 194194 | 2186 | 1.125678% |
| C | 194194 | 1182 | 0.608670% |
| D | 194194 | 2824 | 1.454216% |
Noise dominated data is calculated using 1-second bins in cleaned event files. If a bin has >2000 counts, and if more than 50% of those come from <1% of pixels, then it is considered to be noise-dominated and hence unusable.
| Quadrant | # 1 sec bins | Bins with >0 counts | Bins with >2000 counts | High rate bins dominated by noise | Noise dominated (total time) | Noise dominated (detector-on time) | Marked lightcurve |
|---|---|---|---|---|---|---|---|
| A | 238025 | 194187 | 60 | 60 | 0.03% | 0.03% |  |
| B | 238025 | 194183 | 403 | 403 | 0.17% | 0.21% |  |
| C | 238025 | 194192 | 42 | 42 | 0.02% | 0.02% |  |
| D | 238025 | 194189 | 1109 | 1109 | 0.47% | 0.57% |  |
Top three noisy pixels from each quadrant. If the there are fewer than three noisy pixels in the level2.evt file, extra rows are filled as -1
| Pixel properties | Quadrant properties | ||||||
|---|---|---|---|---|---|---|---|
| Quadrant | DetID | PixID | Counts | Sigma | Mean | Median | Sigma |
| A | 15 | 233 | 1249663 | 693.34 | 8489 | 8300 | 1790.4 |
| A | 15 | 171 | 551313 | 303.29 | 8489 | 8300 | 1790.4 |
| A | 14 | 79 | 400016 | 218.78 | 8489 | 8300 | 1790.4 |
| B | 3 | 204 | 1427192 | 920.26 | 8683 | 8416 | 1541.7 |
| B | 15 | 223 | 1271316 | 819.15 | 8683 | 8416 | 1541.7 |
| B | 5 | 191 | 1030094 | 662.69 | 8683 | 8416 | 1541.7 |
| C | 15 | 241 | 1947057 | 1123.76 | 8311 | 8146 | 1725.4 |
| C | 9 | 52 | 1102423 | 634.22 | 8311 | 8146 | 1725.4 |
| C | 3 | 79 | 762096 | 436.98 | 8311 | 8146 | 1725.4 |
| D | 13 | 25 | 3708718 | 2042.73 | 8262 | 7997 | 1811.7 |
| D | 1 | 4 | 3679029 | 2026.35 | 8262 | 7997 | 1811.7 |
| D | 13 | 200 | 1296468 | 711.21 | 8262 | 7997 | 1811.7 |
Histogram calculated using DETX and DETY for each event in the final _common_clean file
| Quadrant A | 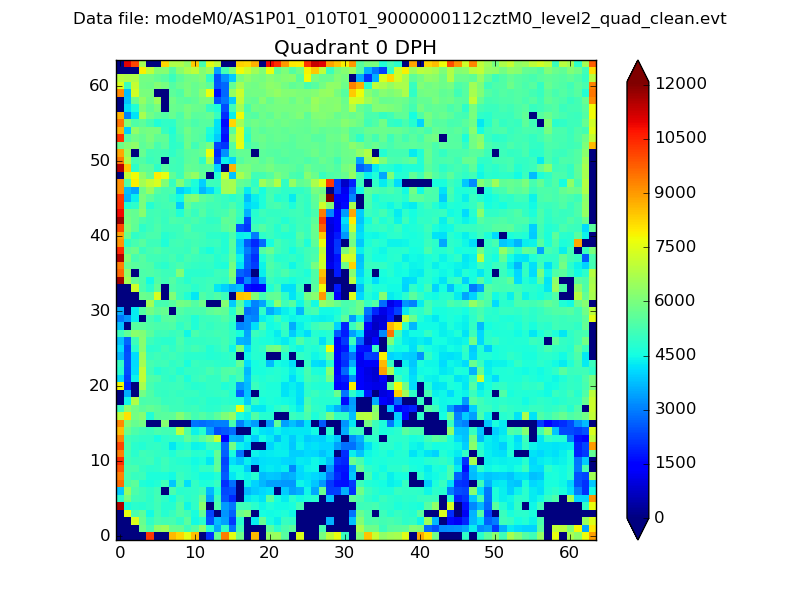 |
 |
Quadrant B |
|---|---|---|---|
| Quadrant D |  |
 |
Quadrant C |
| Plot type | Count rate plots | Images |
|---|---|---|
| Comparison with Poisson distribution Blue bars denote a histogram of data divided into 1 sec bins. Red curve is a Poisson curve with rate = median count rate of data. |
 |
 |
| Quadrant-wise count rates Data is divided into 100 sec bins |
 |
|
| Module-wise count rates for Quadrant A Data is divided into 100 sec bins |
 |
 |
| Module-wise count rates for Quadrant B Data is divided into 100 sec bins |
 |
 |
| Module-wise count rates for Quadrant C Data is divided into 100 sec bins |
 |
 |
| Module-wise count rates for Quadrant D Data is divided into 100 sec bins |
 |
 |
| Parameter | Plot |
|---|---|
| CZT HV Monitor | 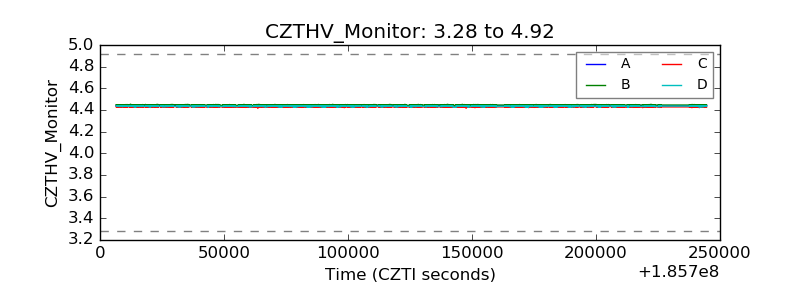 |
| D_VDD |  |
| Temperature 1 | 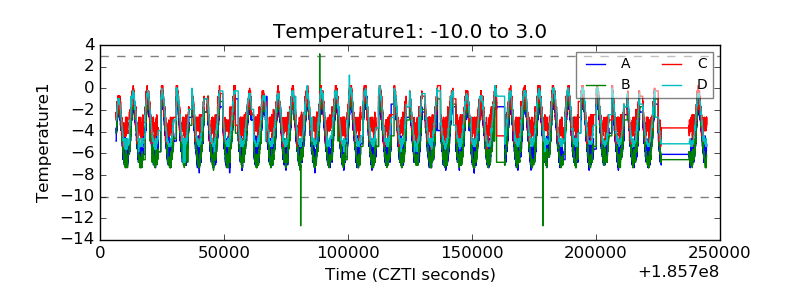 |
| Veto HV Monitor |  |
| Veto LLD | 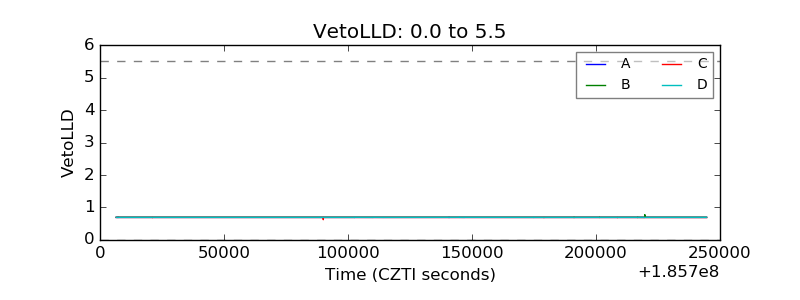 |
| Alpha Counter |  |
| _CPM_Rate |  |
| CZT Counter | 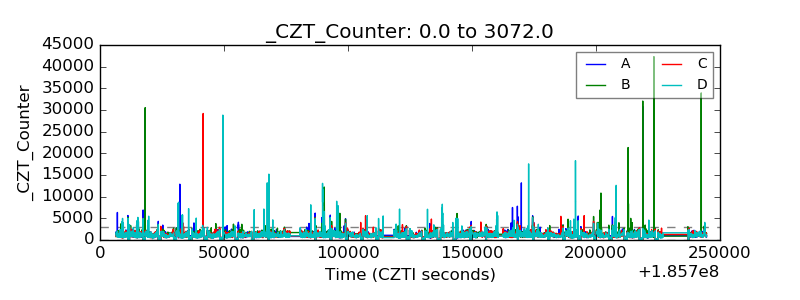 |
| +2.5 Volts monitor |  |
| +5 Volts monitor |  |
| Veto Counter |  |