| Param | Original file | Final file |
|---|---|---|
| Filename | modeM0/AS1P01_889T01_9000000170cztM0_level2_bc.evt | modeM0/AS1P01_889T01_9000000170cztM0_level2_quad_clean.evt |
| Size (bytes) | 46,333,440 | 20,664,000 |
| Size | 44.2 MB | 19.7 MB |
| Events in quadrant A | 227,576 | 133,318 |
| Events in quadrant B | 565,902 | 129,504 |
| Events in quadrant C | 249,632 | 132,039 |
| Events in quadrant D | 259,257 | 129,192 |
| Mode M0 | |||
|---|---|---|---|
| Quadrant | BADHDUFLAG | Total packets | Discarded packets |
| A | 0 | 5367 | 1 |
| B | 0 | 7303 | 1 |
| C | 0 | 5227 | 1 |
| D | 0 | 4864 | 1 |
| Mode SS | |||
|---|---|---|---|
| Quadrant | BADHDUFLAG | Total packets | Discarded packets |
| A | 0 | 28 | 0 |
| B | 0 | 28 | 0 |
| C | 0 | 28 | 0 |
| D | 0 | 28 | 0 |
| Mode M9 | |||
|---|---|---|---|
| Quadrant | BADHDUFLAG | Total packets | Discarded packets |
| A | 0 | 7 | 0 |
| B | 0 | 7 | 0 |
| C | 0 | 7 | 0 |
| D | 0 | 7 | 0 |
| Quadrant | Total seconds | Saturated seconds | Saturation percentage |
|---|---|---|---|
| A | 1353 | 1 | 0.073910% |
| B | 1353 | 83 | 6.134516% |
| C | 1353 | 2 | 0.147820% |
| D | 1353 | 1 | 0.073910% |
Noise dominated data is calculated using 1-second bins in cleaned event files. If a bin has >2000 counts, and if more than 50% of those come from <1% of pixels, then it is considered to be noise-dominated and hence unusable.
| Quadrant | # 1 sec bins | Bins with >0 counts | Bins with >2000 counts | High rate bins dominated by noise | Noise dominated (total time) | Noise dominated (detector-on time) | Marked lightcurve |
|---|---|---|---|---|---|---|---|
| A | 1352 | 1352 | 0 | 0 | 0.00% | 0.00% |  |
| B | 1352 | 1352 | 0 | 0 | 0.00% | 0.00% |  |
| C | 1352 | 1352 | 0 | 0 | 0.00% | 0.00% |  |
| D | 1352 | 1352 | 0 | 0 | 0.00% | 0.00% |  |
Top three noisy pixels from each quadrant. If the there are fewer than three noisy pixels in the level2.evt file, extra rows are filled as -1
| Pixel properties | Quadrant properties | ||||||
|---|---|---|---|---|---|---|---|
| Quadrant | DetID | PixID | Counts | Sigma | Mean | Median | Sigma |
| A | 15 | 127 | 376 | 21.45 | 59 | 57 | 14.9 |
| A | 10 | 133 | 196 | 9.35 | 59 | 57 | 14.9 |
| A | 10 | 83 | 157 | 6.73 | 59 | 57 | 14.9 |
| B | 3 | 0 | 282557 | 21481.11 | 58 | 56 | 13.2 |
| B | 0 | 220 | 18949 | 1436.61 | 58 | 56 | 13.2 |
| B | 8 | 38 | 7670 | 578.96 | 58 | 56 | 13.2 |
| C | 3 | 143 | 12663 | 875.07 | 58 | 56 | 14.4 |
| C | 15 | 241 | 3704 | 253.21 | 58 | 56 | 14.4 |
| C | 9 | 83 | 1696 | 113.84 | 58 | 56 | 14.4 |
| D | 13 | 170 | 11133 | 745.49 | 57 | 55 | 14.9 |
| D | 13 | 13 | 7537 | 503.5 | 57 | 55 | 14.9 |
| D | 1 | 4 | 5018 | 333.98 | 57 | 55 | 14.9 |
Histogram calculated using DETX and DETY for each event in the final _common_clean file
| Quadrant A |  |
 |
Quadrant B |
|---|---|---|---|
| Quadrant D | 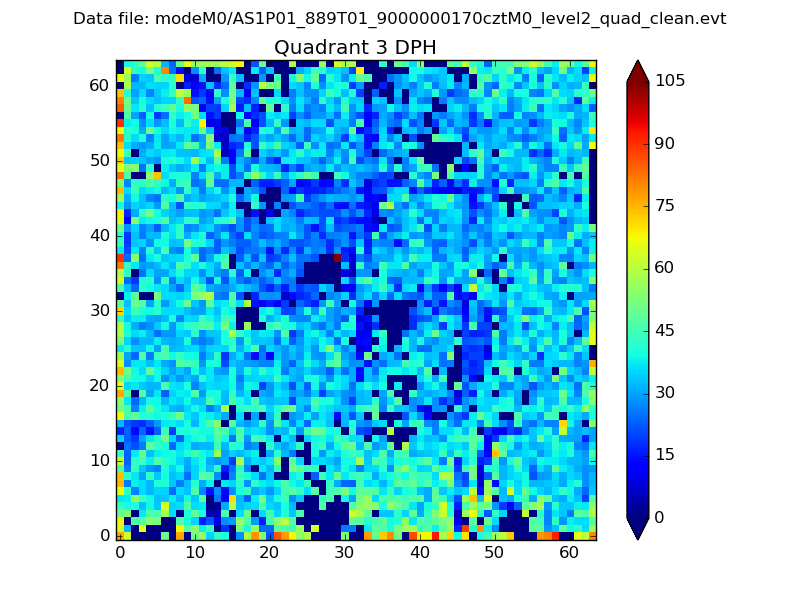 |
 |
Quadrant C |
| Plot type | Count rate plots | Images |
|---|---|---|
| Comparison with Poisson distribution Blue bars denote a histogram of data divided into 1 sec bins. Red curve is a Poisson curve with rate = median count rate of data. |
 |
 |
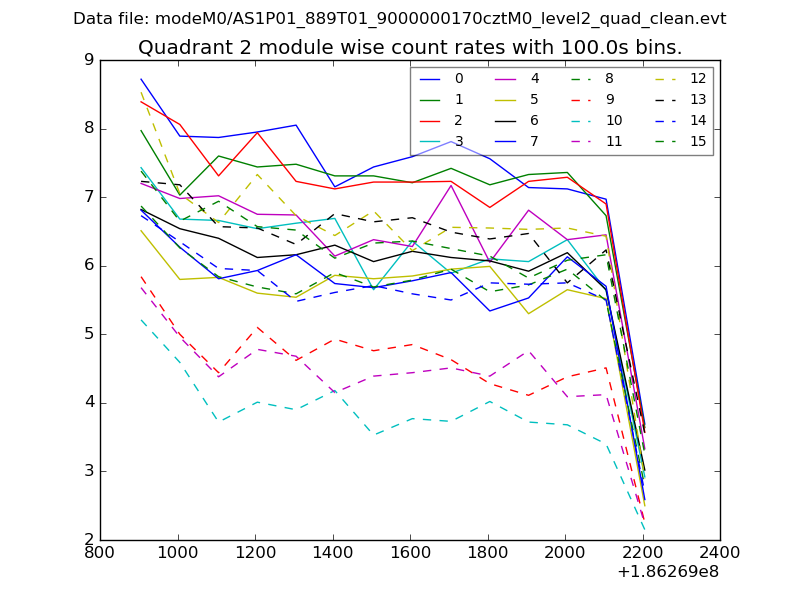
| Quadrant-wise count rates Data is divided into 100 sec bins |
 |
|
| Module-wise count rates for Quadrant A Data is divided into 100 sec bins |
 |
 |
| Module-wise count rates for Quadrant B Data is divided into 100 sec bins |
 |
 |
| Module-wise count rates for Quadrant C Data is divided into 100 sec bins |
 |
 |
| Module-wise count rates for Quadrant D Data is divided into 100 sec bins |
 |
 |
| Parameter | Plot |
|---|---|
| CZT HV Monitor |  |
| D_VDD |  |
| Temperature 1 |  |
| Veto HV Monitor | 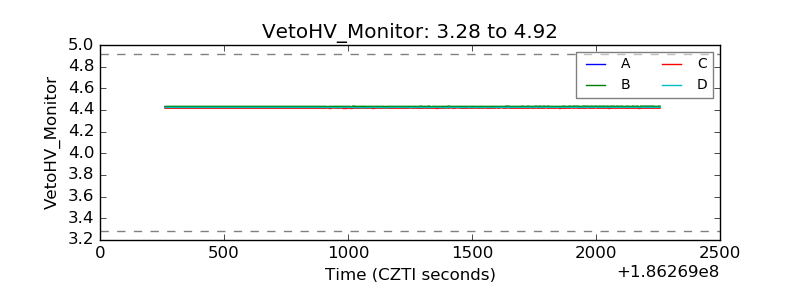 |
| Veto LLD |  |
| Alpha Counter |  |
| _CPM_Rate |  |
| CZT Counter |  |
| +2.5 Volts monitor |  |
| +5 Volts monitor |  |
| _ROLL_ROT |  |
| _Roll_DEC |  |
| _Roll_RA |  |
| Veto Counter |  |