| Param | Original file | Final file |
|---|---|---|
| Filename | modeM0/AS1P01_999T99_9000000148cztM0_level2_bc.evt | modeM0/AS1P01_999T99_9000000148cztM0_level2_quad_clean.evt |
| Size (bytes) | 23,592,960 | 12,945,600 |
| Size | 22.5 MB | 12.3 MB |
| Events in quadrant A | 145,473 | 83,037 |
| Events in quadrant B | 162,614 | 84,538 |
| Events in quadrant C | 176,369 | 84,249 |
| Events in quadrant D | 172,287 | 81,696 |
| Mode M9 | |||
|---|---|---|---|
| Quadrant | BADHDUFLAG | Total packets | Discarded packets |
| A | 0 | 11 | 0 |
| B | 0 | 11 | 0 |
| C | 0 | 11 | 0 |
| D | 0 | 11 | 0 |
| Mode SS | |||
|---|---|---|---|
| Quadrant | BADHDUFLAG | Total packets | Discarded packets |
| A | 0 | 16 | 0 |
| B | 0 | 16 | 0 |
| C | 0 | 16 | 0 |
| D | 0 | 16 | 0 |
| Mode M0 | |||
|---|---|---|---|
| Quadrant | BADHDUFLAG | Total packets | Discarded packets |
| A | 0 | 3839 | 0 |
| B | 0 | 3935 | 0 |
| C | 0 | 3680 | 0 |
| D | 0 | 3509 | 0 |
| Quadrant | Total seconds | Saturated seconds | Saturation percentage |
|---|---|---|---|
| A | 725 | 33 | 4.551724% |
| B | 725 | 32 | 4.413793% |
| C | 725 | 25 | 3.448276% |
| D | 725 | 29 | 4.000000% |
Noise dominated data is calculated using 1-second bins in cleaned event files. If a bin has >2000 counts, and if more than 50% of those come from <1% of pixels, then it is considered to be noise-dominated and hence unusable.
| Quadrant | # 1 sec bins | Bins with >0 counts | Bins with >2000 counts | High rate bins dominated by noise | Noise dominated (total time) | Noise dominated (detector-on time) | Marked lightcurve |
|---|---|---|---|---|---|---|---|
| A | 1850 | 724 | 0 | 0 | 0.00% | 0.00% | 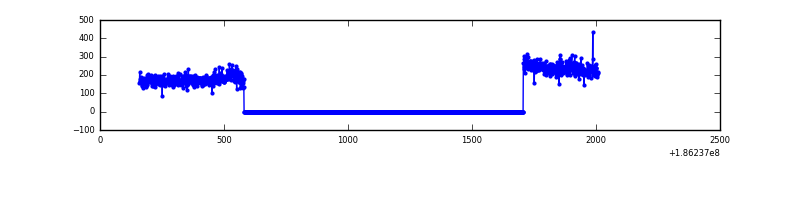 |
| B | 1850 | 724 | 0 | 0 | 0.00% | 0.00% |  |
| C | 1850 | 724 | 0 | 0 | 0.00% | 0.00% | 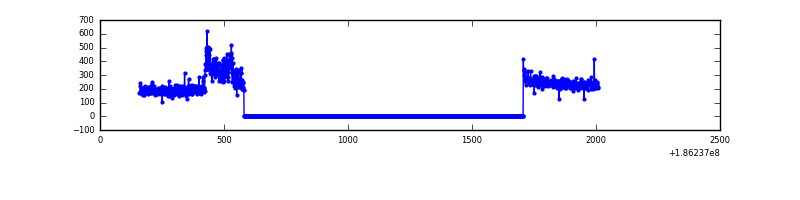 |
| D | 1850 | 724 | 0 | 0 | 0.00% | 0.00% | 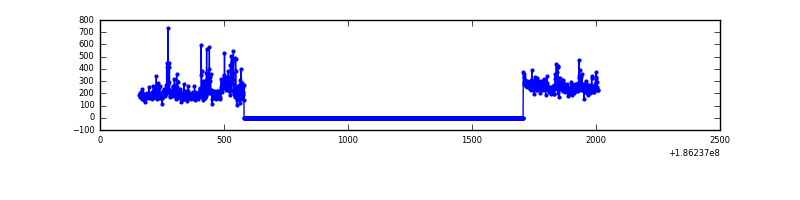 |
Top three noisy pixels from each quadrant. If the there are fewer than three noisy pixels in the level2.evt file, extra rows are filled as -1
| Pixel properties | Quadrant properties | ||||||
|---|---|---|---|---|---|---|---|
| Quadrant | DetID | PixID | Counts | Sigma | Mean | Median | Sigma |
| A | 15 | 17 | 900 | 86.8 | 37 | 36 | 10.0 |
| A | 14 | 79 | 371 | 33.66 | 37 | 36 | 10.0 |
| A | 13 | 253 | 94 | 5.83 | 37 | 36 | 10.0 |
| B | 0 | 184 | 8625 | 953.44 | 38 | 37 | 9.0 |
| B | 8 | 38 | 2451 | 268.0 | 38 | 37 | 9.0 |
| B | 0 | 220 | 1501 | 162.53 | 38 | 37 | 9.0 |
| C | 8 | 208 | 21150 | 2140.37 | 37 | 36 | 9.9 |
| C | 9 | 83 | 1670 | 165.64 | 37 | 36 | 9.9 |
| C | 15 | 241 | 1598 | 158.34 | 37 | 36 | 9.9 |
| D | 7 | 207 | 16401 | 1665.04 | 37 | 36 | 9.8 |
| D | 1 | 4 | 5666 | 572.82 | 37 | 36 | 9.8 |
| D | 10 | 166 | 2925 | 293.94 | 37 | 36 | 9.8 |
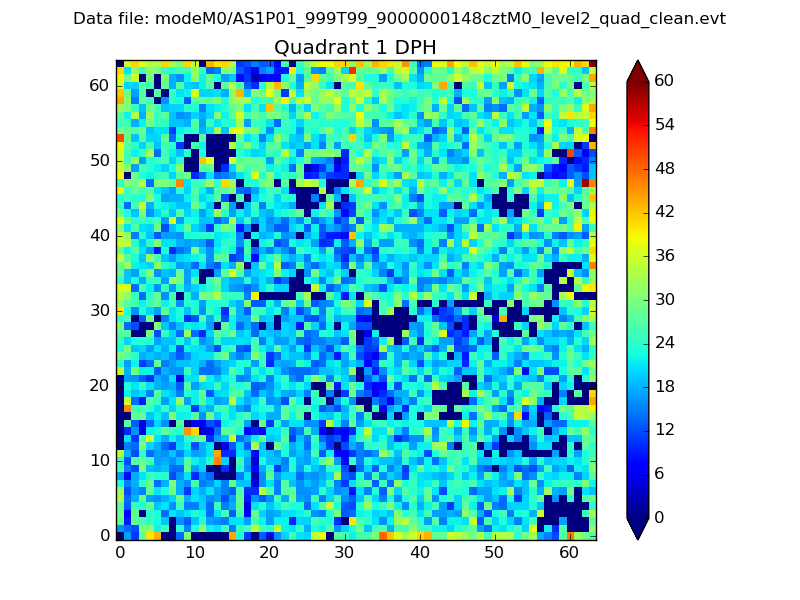
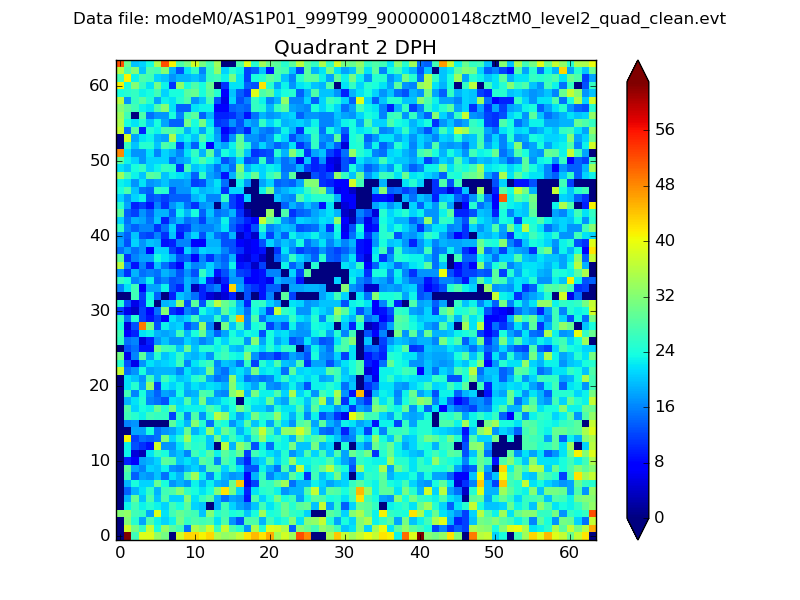
Histogram calculated using DETX and DETY for each event in the final _common_clean file
| Quadrant A | 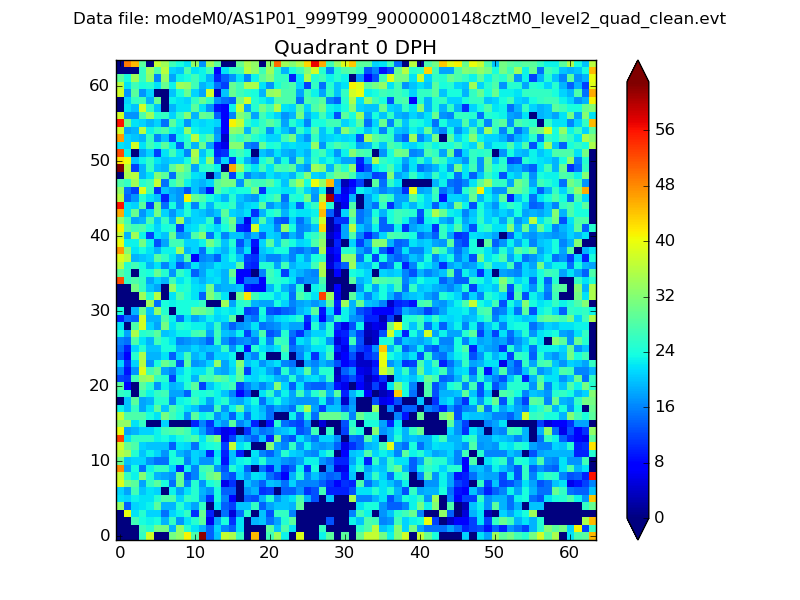 |
 |
Quadrant B |
|---|---|---|---|
| Quadrant D |  |
 |
Quadrant C |
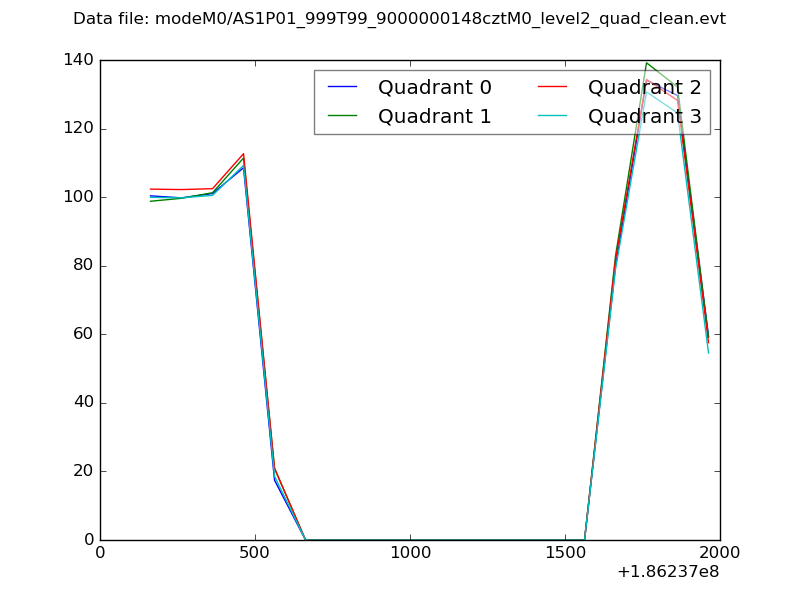
| Plot type | Count rate plots | Images |
|---|---|---|
| Comparison with Poisson distribution Blue bars denote a histogram of data divided into 1 sec bins. Red curve is a Poisson curve with rate = median count rate of data. |
 |
 |
| Quadrant-wise count rates Data is divided into 100 sec bins |
 |
|
| Module-wise count rates for Quadrant A Data is divided into 100 sec bins |
 |
 |
| Module-wise count rates for Quadrant B Data is divided into 100 sec bins |
 |
 |
| Module-wise count rates for Quadrant C Data is divided into 100 sec bins |
 |
 |
| Module-wise count rates for Quadrant D Data is divided into 100 sec bins |
 |
 |
| Parameter | Plot |
|---|---|
| CZT HV Monitor |  |
| D_VDD |  |
| Temperature 1 |  |
| Veto HV Monitor | 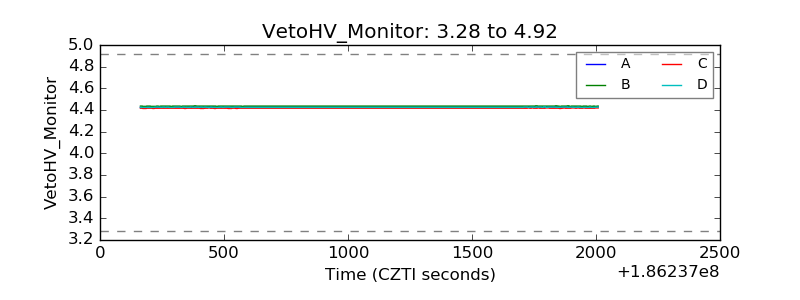 |
| Veto LLD | 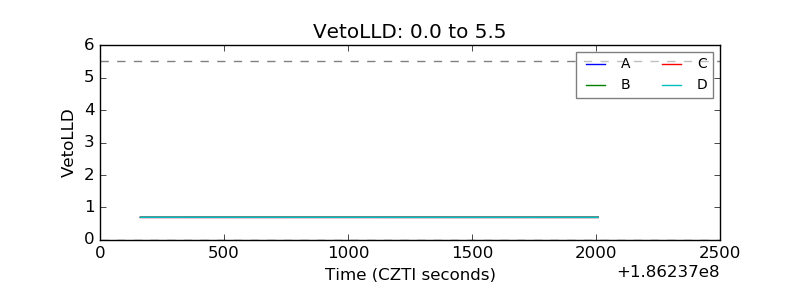 |
| Alpha Counter |  |
| _CPM_Rate | 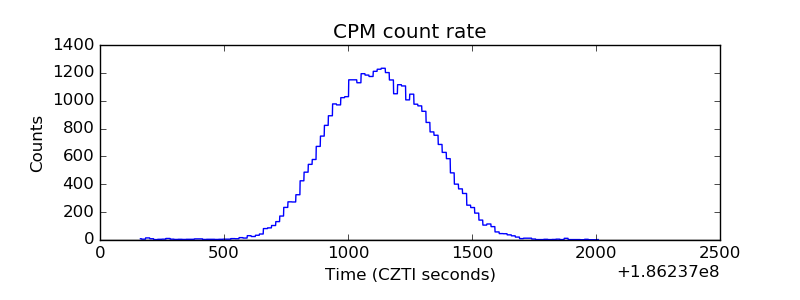 |
| CZT Counter |  |
| +2.5 Volts monitor |  |
| +5 Volts monitor | 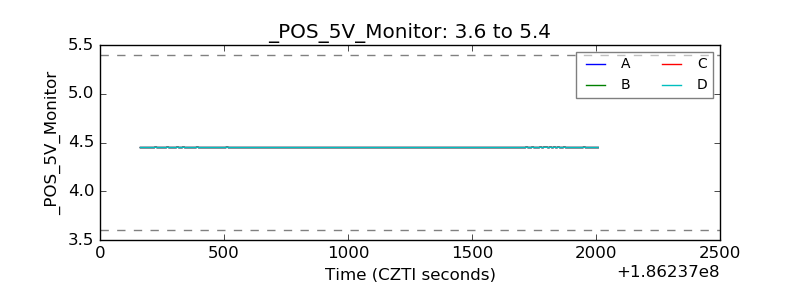 |
| _ROLL_ROT |  |
| _Roll_DEC |  |
| _Roll_RA |  |
| Veto Counter |  |