| Param | Original file | Final file |
|---|---|---|
| Filename | modeM0/AS1P01_180T10_9000000192cztM0_level2_bc.evt | modeM0/AS1P01_180T10_9000000192cztM0_level2_quad_clean.evt |
| Size (bytes) | 48,833,280 | 13,224,960 |
| Size | 46.6 MB | 12.6 MB |
| Events in quadrant A | 324,141 | 71,011 |
| Events in quadrant B | 313,765 | 71,343 |
| Events in quadrant C | 384,222 | 69,689 |
| Events in quadrant D | 339,077 | 69,688 |
| Mode M9 | |||
|---|---|---|---|
| Quadrant | BADHDUFLAG | Total packets | Discarded packets |
| A | 0 | 10 | 0 |
| B | 0 | 10 | 0 |
| C | 0 | 10 | 0 |
| D | 0 | 10 | 0 |
| Mode SS | |||
|---|---|---|---|
| Quadrant | BADHDUFLAG | Total packets | Discarded packets |
| A | 0 | 32 | 0 |
| B | 0 | 32 | 0 |
| C | 0 | 32 | 0 |
| D | 0 | 32 | 0 |
| Mode M0 | |||
|---|---|---|---|
| Quadrant | BADHDUFLAG | Total packets | Discarded packets |
| A | 0 | 7331 | 0 |
| B | 0 | 7673 | 0 |
| C | 0 | 7639 | 0 |
| D | 0 | 6957 | 0 |
| Quadrant | Total seconds | Saturated seconds | Saturation percentage |
|---|---|---|---|
| A | 1609 | 5 | 0.310752% |
| B | 1609 | 9 | 0.559354% |
| C | 1609 | 3 | 0.186451% |
| D | 1609 | 5 | 0.310752% |
Noise dominated data is calculated using 1-second bins in cleaned event files. If a bin has >2000 counts, and if more than 50% of those come from <1% of pixels, then it is considered to be noise-dominated and hence unusable.
| Quadrant | # 1 sec bins | Bins with >0 counts | Bins with >2000 counts | High rate bins dominated by noise | Noise dominated (total time) | Noise dominated (detector-on time) | Marked lightcurve |
|---|---|---|---|---|---|---|---|
| A | 2534 | 1608 | 0 | 0 | 0.00% | 0.00% | 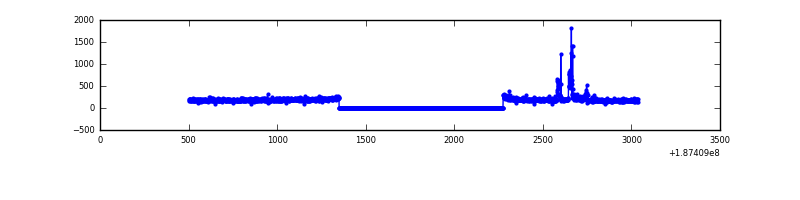 |
| B | 2533 | 1608 | 0 | 0 | 0.00% | 0.00% | 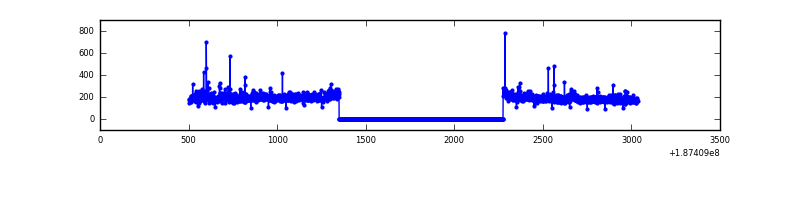 |
| C | 2534 | 1609 | 0 | 0 | 0.00% | 0.00% | 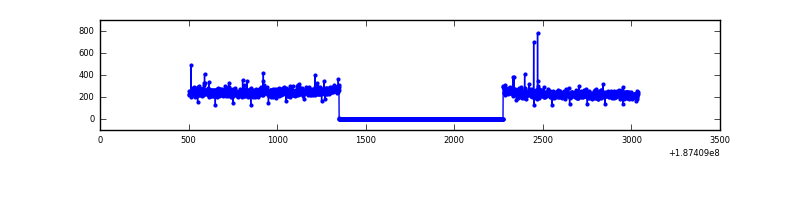 |
| D | 2534 | 1609 | 0 | 0 | 0.00% | 0.00% | 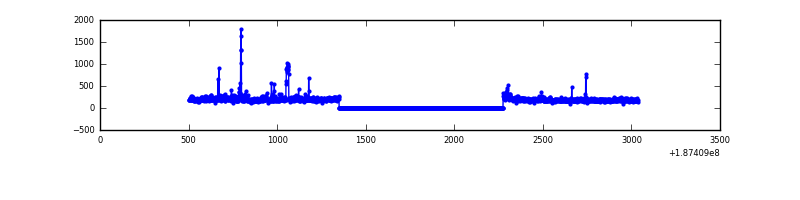 |
Top three noisy pixels from each quadrant. If the there are fewer than three noisy pixels in the level2.evt file, extra rows are filled as -1
| Pixel properties | Quadrant properties | ||||||
|---|---|---|---|---|---|---|---|
| Quadrant | DetID | PixID | Counts | Sigma | Mean | Median | Sigma |
| A | 15 | 233 | 24869 | 1349.53 | 77 | 75 | 18.4 |
| A | 12 | 243 | 868 | 43.16 | 77 | 75 | 18.4 |
| A | 0 | 253 | 687 | 33.31 | 77 | 75 | 18.4 |
| B | 5 | 191 | 6788 | 404.0 | 78 | 75 | 16.6 |
| B | 5 | 249 | 3342 | 196.61 | 78 | 75 | 16.6 |
| B | 5 | 184 | 1286 | 72.88 | 78 | 75 | 16.6 |
| C | 15 | 241 | 71500 | 3998.58 | 74 | 73 | 17.9 |
| C | 3 | 79 | 7930 | 439.85 | 74 | 73 | 17.9 |
| C | 9 | 52 | 3759 | 206.35 | 74 | 73 | 17.9 |
| D | 15 | 13 | 13433 | 724.35 | 75 | 73 | 18.4 |
| D | 2 | 216 | 13084 | 705.43 | 75 | 73 | 18.4 |
| D | 10 | 125 | 6193 | 331.81 | 75 | 73 | 18.4 |
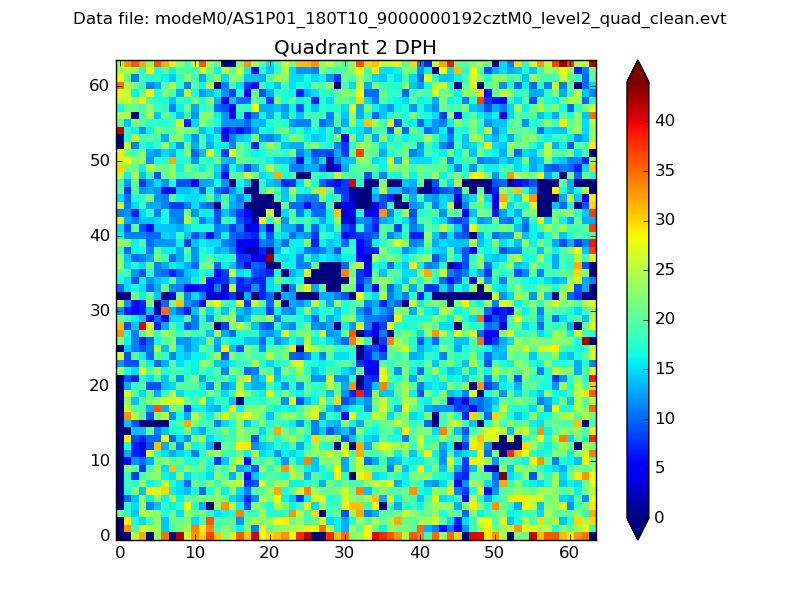
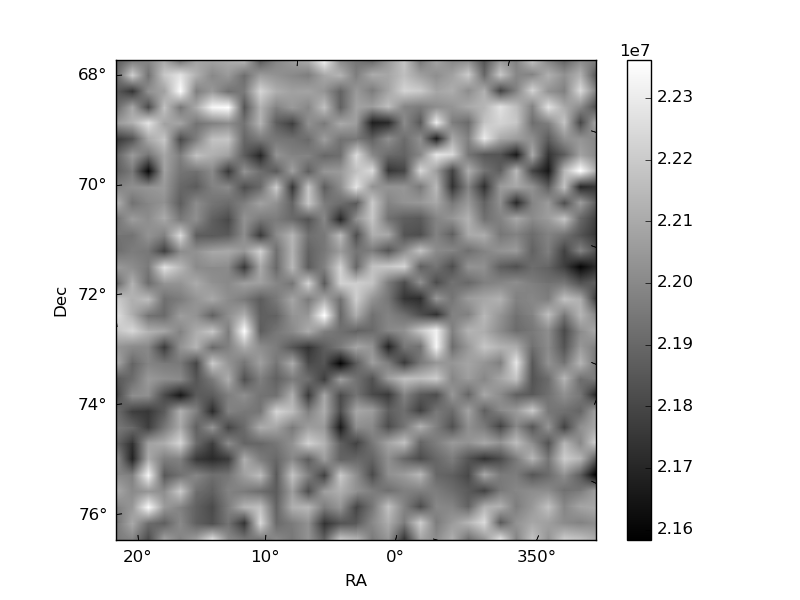
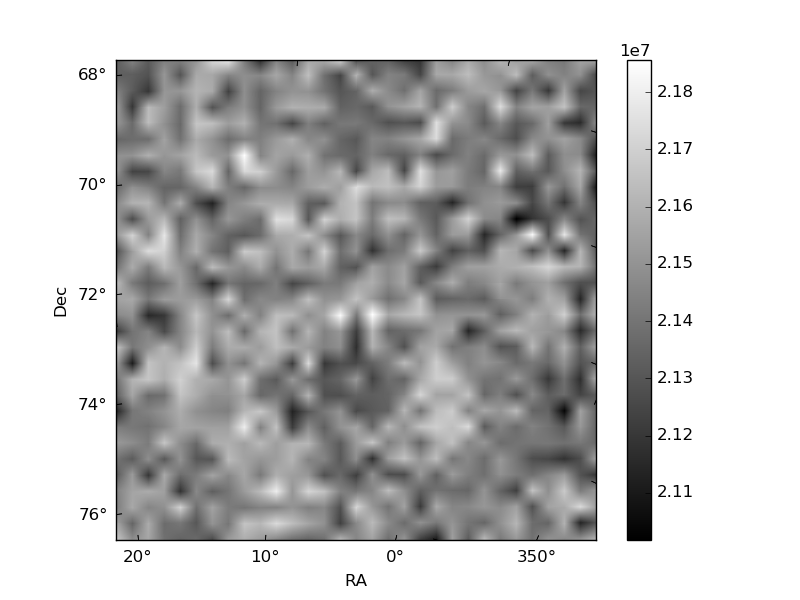
Histogram calculated using DETX and DETY for each event in the final _common_clean file
| Quadrant A | 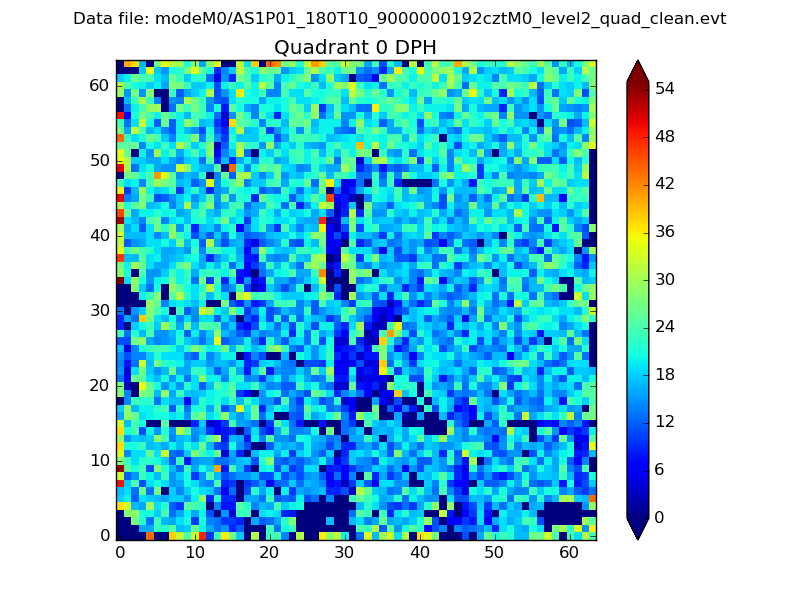 |
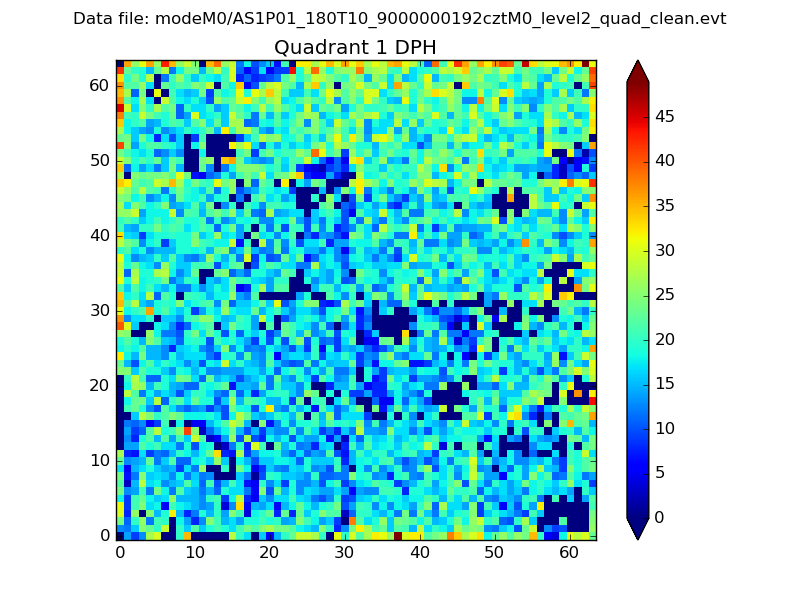 |
Quadrant B |
|---|---|---|---|
| Quadrant D | 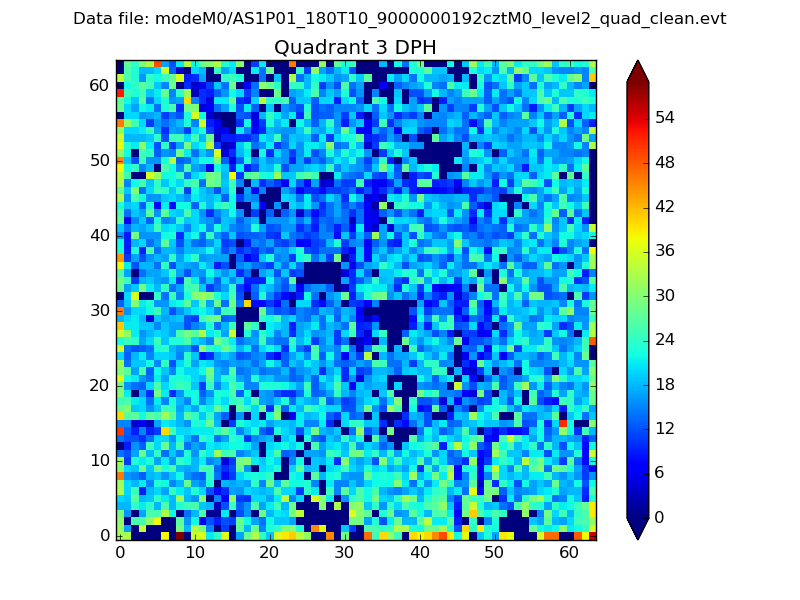 |
 |
Quadrant C |
| Plot type | Count rate plots | Images |
|---|---|---|
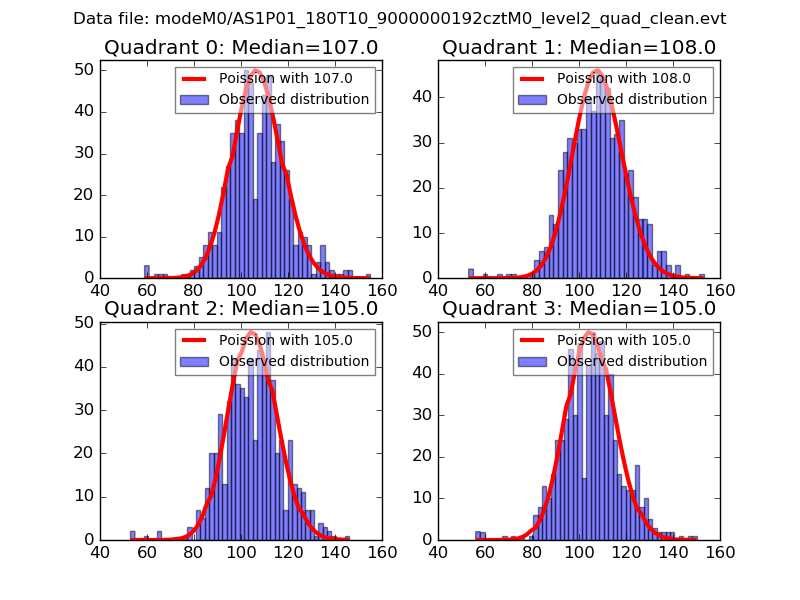
| Comparison with Poisson distribution Blue bars denote a histogram of data divided into 1 sec bins. Red curve is a Poisson curve with rate = median count rate of data. |
 |
 |
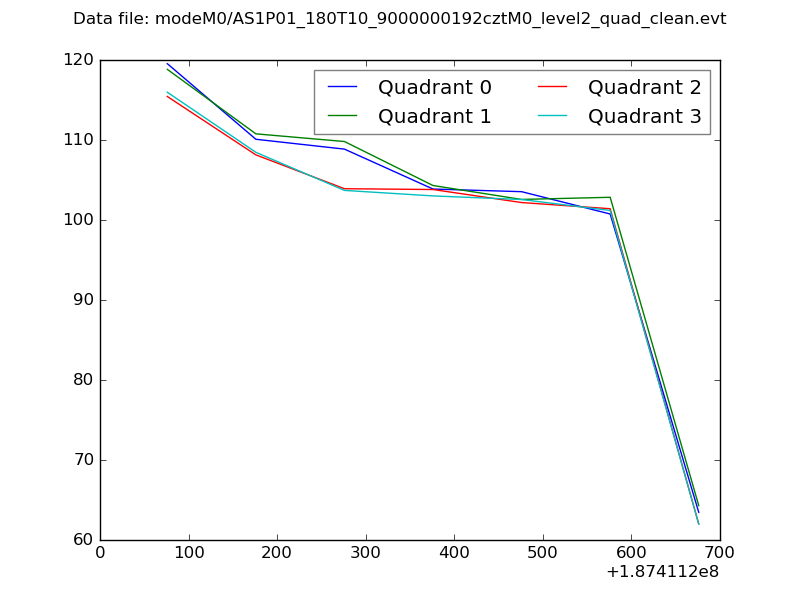
| Quadrant-wise count rates Data is divided into 100 sec bins |
 |
|
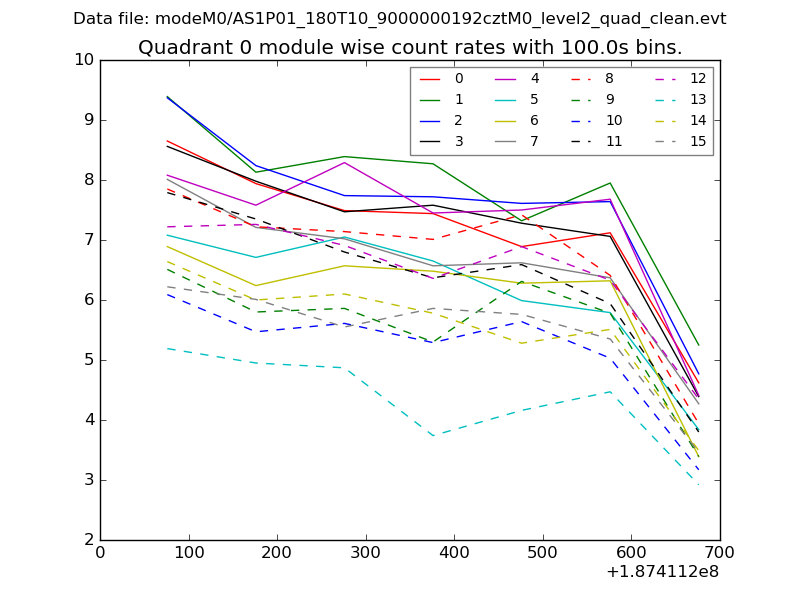
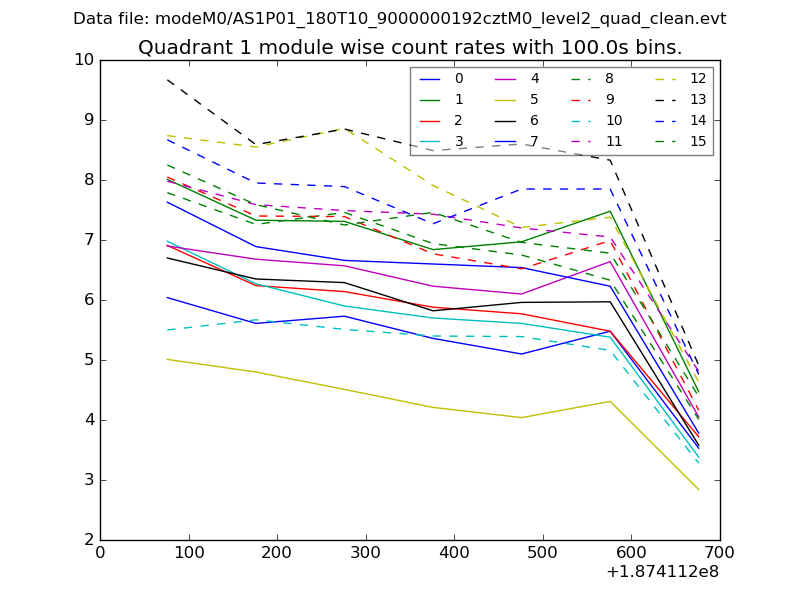
| Module-wise count rates for Quadrant A Data is divided into 100 sec bins |
 |
 |
| Module-wise count rates for Quadrant B Data is divided into 100 sec bins |
 |
 |
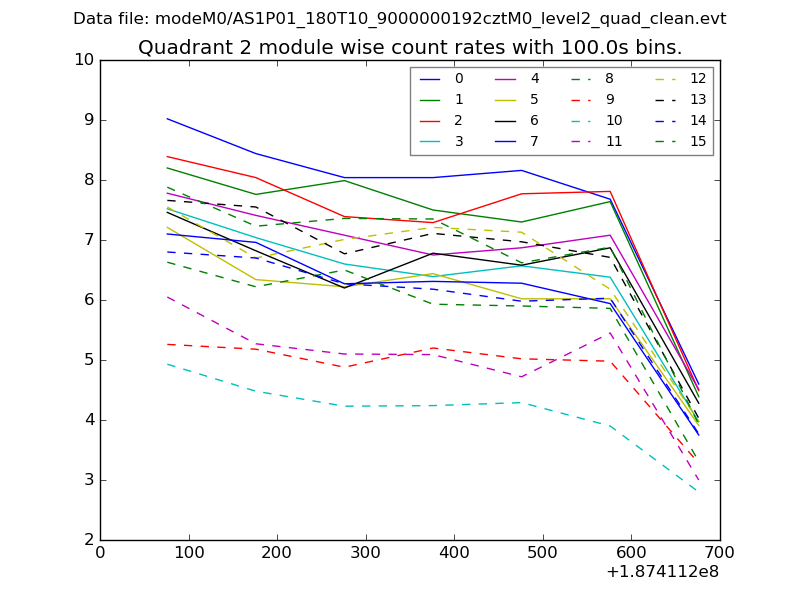
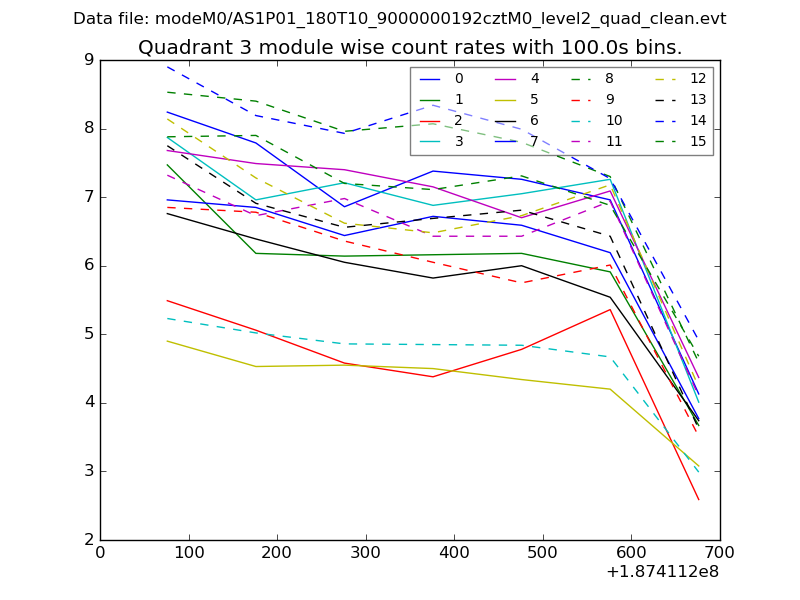
| Module-wise count rates for Quadrant C Data is divided into 100 sec bins |
 |
 |
| Module-wise count rates for Quadrant D Data is divided into 100 sec bins |
 |
 |
| Parameter | Plot |
|---|---|
| CZT HV Monitor | 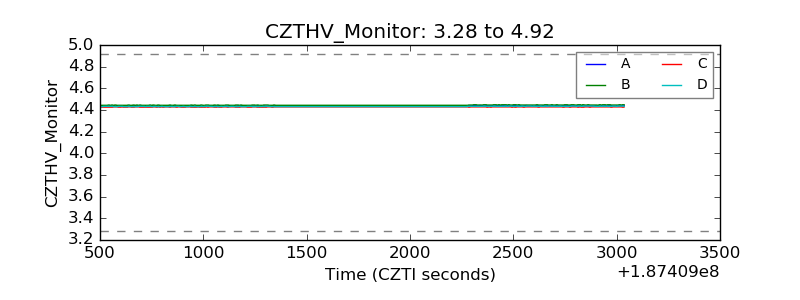 |
| D_VDD | 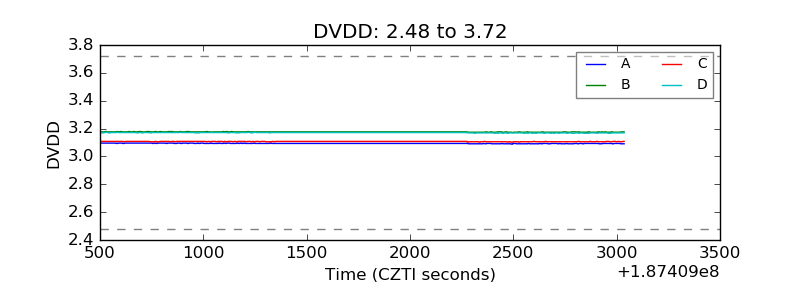 |
| Temperature 1 | 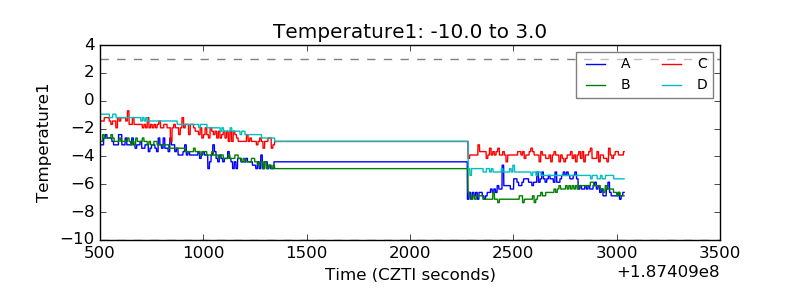 |
| Veto HV Monitor | 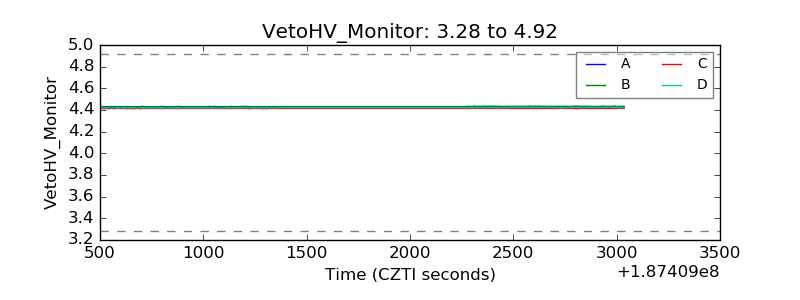 |
| Veto LLD | 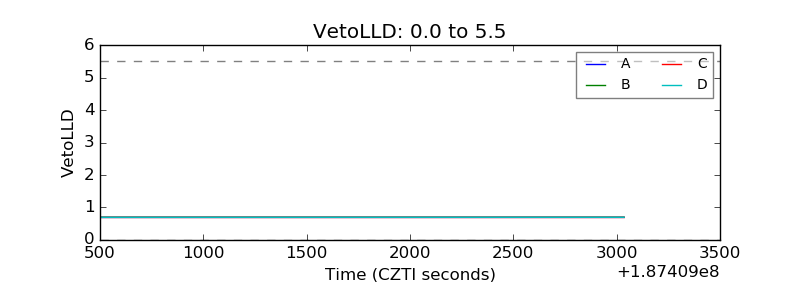 |
| Alpha Counter | 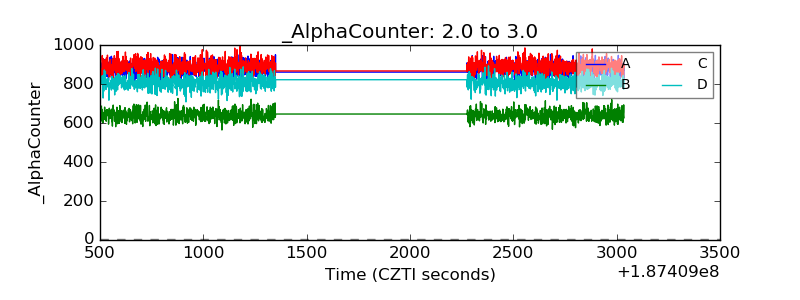 |
| _CPM_Rate | 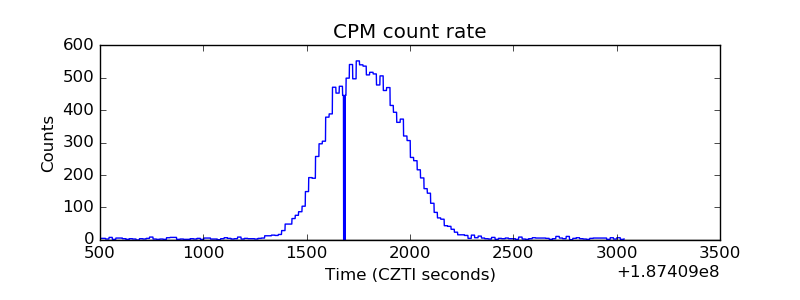 |
| CZT Counter | 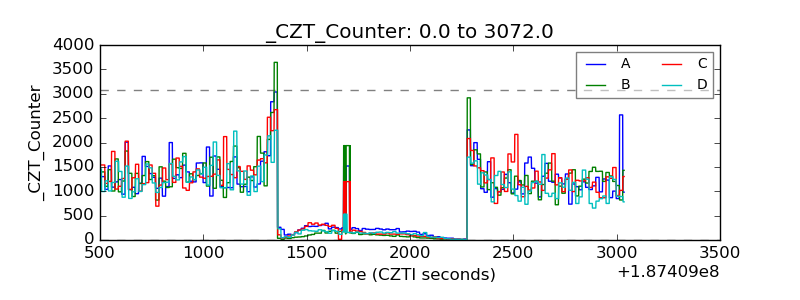 |
| +2.5 Volts monitor | 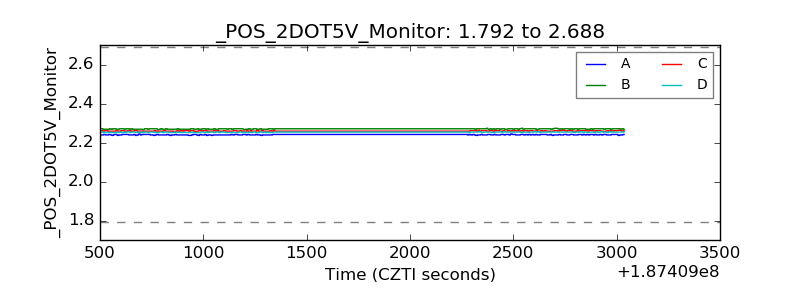 |
| +5 Volts monitor | 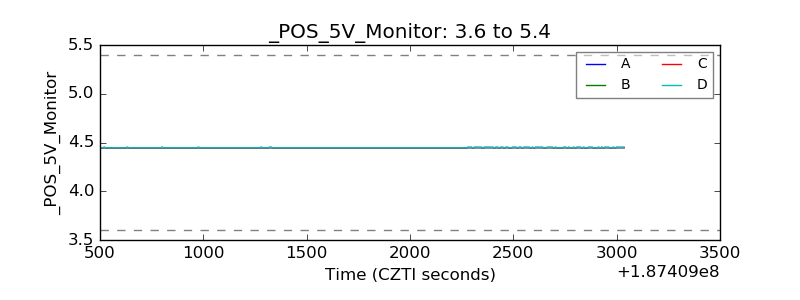 |
| _ROLL_ROT | 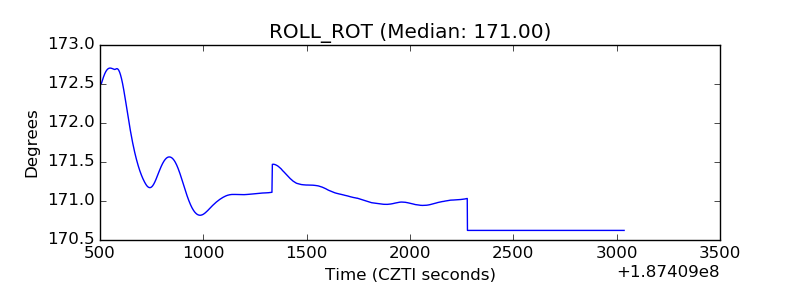 |
| _Roll_DEC | 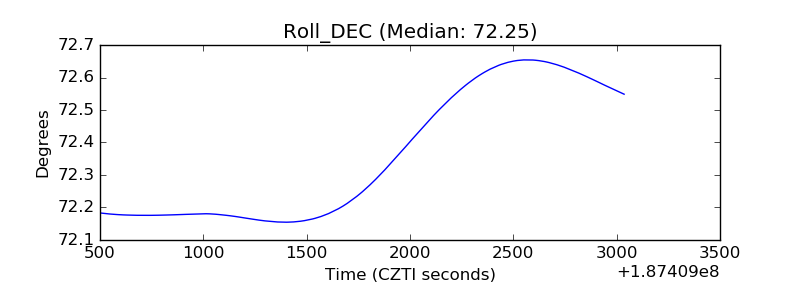 |
| _Roll_RA | 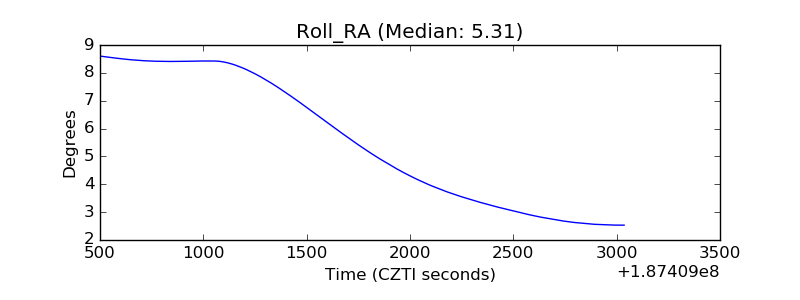 |
| Veto Counter | 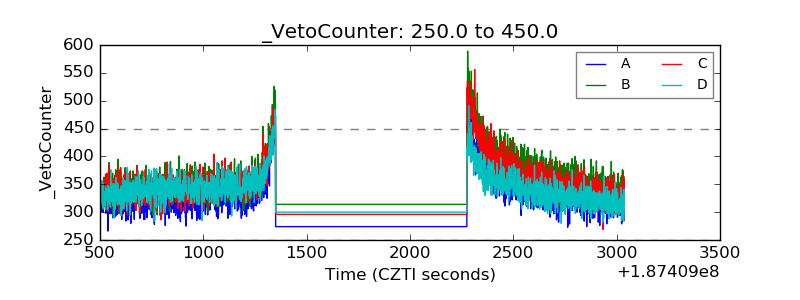 |