| Param | Original file | Final file |
|---|---|---|
| Filename | modeM0/AS1P01_999T99_9000000194cztM0_level2_bc.evt | modeM0/AS1P01_999T99_9000000194cztM0_level2_quad_clean.evt |
| Size (bytes) | 28,549,440 | 16,329,600 |
| Size | 27.2 MB | 15.6 MB |
| Events in quadrant A | 172,919 | 102,101 |
| Events in quadrant B | 203,087 | 103,407 |
| Events in quadrant C | 231,875 | 102,502 |
| Events in quadrant D | 171,575 | 100,648 |
| Mode M0 | |||
|---|---|---|---|
| Quadrant | BADHDUFLAG | Total packets | Discarded packets |
| A | 0 | 4277 | 0 |
| B | 0 | 4483 | 0 |
| C | 0 | 4125 | 0 |
| D | 0 | 3696 | 0 |
| Mode SS | |||
|---|---|---|---|
| Quadrant | BADHDUFLAG | Total packets | Discarded packets |
| A | 0 | 22 | 0 |
| B | 0 | 22 | 0 |
| C | 0 | 22 | 0 |
| D | 0 | 22 | 0 |
| Quadrant | Total seconds | Saturated seconds | Saturation percentage |
|---|---|---|---|
| A | 1125 | 0 | 0.000000% |
| B | 1125 | 4 | 0.355556% |
| C | 1125 | 0 | 0.000000% |
| D | 1125 | 0 | 0.000000% |
Noise dominated data is calculated using 1-second bins in cleaned event files. If a bin has >2000 counts, and if more than 50% of those come from <1% of pixels, then it is considered to be noise-dominated and hence unusable.
| Quadrant | # 1 sec bins | Bins with >0 counts | Bins with >2000 counts | High rate bins dominated by noise | Noise dominated (total time) | Noise dominated (detector-on time) | Marked lightcurve |
|---|---|---|---|---|---|---|---|
| A | 1124 | 1124 | 0 | 0 | 0.00% | 0.00% |  |
| B | 1125 | 1125 | 0 | 0 | 0.00% | 0.00% |  |
| C | 1125 | 1125 | 0 | 0 | 0.00% | 0.00% |  |
| D | 1125 | 1125 | 0 | 0 | 0.00% | 0.00% |  |
Top three noisy pixels from each quadrant. If the there are fewer than three noisy pixels in the level2.evt file, extra rows are filled as -1
| Pixel properties | Quadrant properties | ||||||
|---|---|---|---|---|---|---|---|
| Quadrant | DetID | PixID | Counts | Sigma | Mean | Median | Sigma |
| A | 13 | 235 | 542 | 43.97 | 44 | 43 | 11.3 |
| A | 12 | 243 | 155 | 9.87 | 44 | 43 | 11.3 |
| A | 15 | 233 | 127 | 7.4 | 44 | 43 | 11.3 |
| B | 5 | 184 | 14437 | 1375.72 | 45 | 44 | 10.5 |
| B | 5 | 191 | 11210 | 1067.28 | 45 | 44 | 10.5 |
| B | 4 | 232 | 2036 | 190.4 | 45 | 44 | 10.5 |
| C | 15 | 241 | 51139 | 4358.55 | 44 | 43 | 11.7 |
| C | 3 | 79 | 2192 | 183.31 | 44 | 43 | 11.7 |
| C | 3 | 111 | 1777 | 147.91 | 44 | 43 | 11.7 |
| D | 2 | 216 | 3061 | 260.27 | 43 | 42 | 11.6 |
| D | 13 | 13 | 1041 | 86.12 | 43 | 42 | 11.6 |
| D | 15 | 13 | 1030 | 85.17 | 43 | 42 | 11.6 |
Histogram calculated using DETX and DETY for each event in the final _common_clean file
| Quadrant A |  |
 |
Quadrant B |
|---|---|---|---|
| Quadrant D |  |
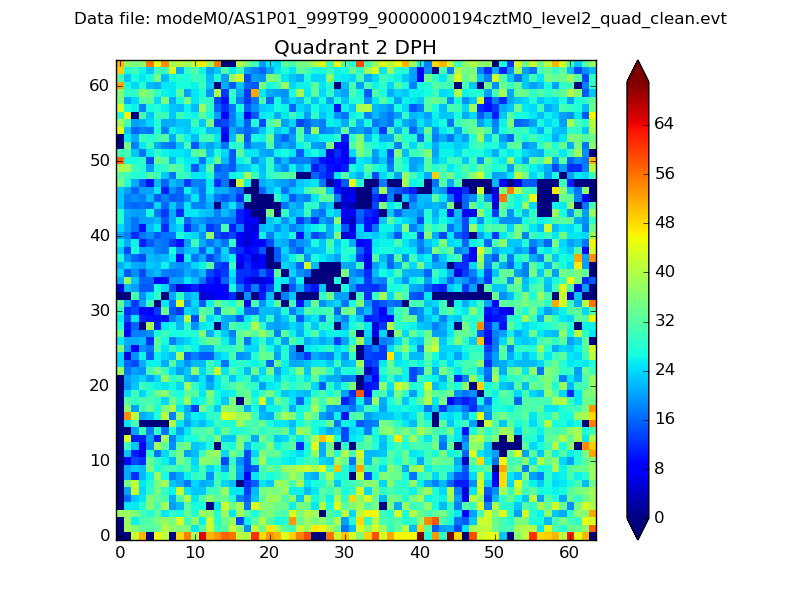 |
Quadrant C |
| Plot type | Count rate plots | Images |
|---|---|---|
| Comparison with Poisson distribution Blue bars denote a histogram of data divided into 1 sec bins. Red curve is a Poisson curve with rate = median count rate of data. |
 |
 |
| Quadrant-wise count rates Data is divided into 100 sec bins |
 |
|
| Module-wise count rates for Quadrant A Data is divided into 100 sec bins |
 |
 |
| Module-wise count rates for Quadrant B Data is divided into 100 sec bins |
 |
 |
| Module-wise count rates for Quadrant C Data is divided into 100 sec bins |
 |
 |
| Module-wise count rates for Quadrant D Data is divided into 100 sec bins |
 |
 |
| Parameter | Plot |
|---|---|
| CZT HV Monitor |  |
| D_VDD |  |
| Temperature 1 | 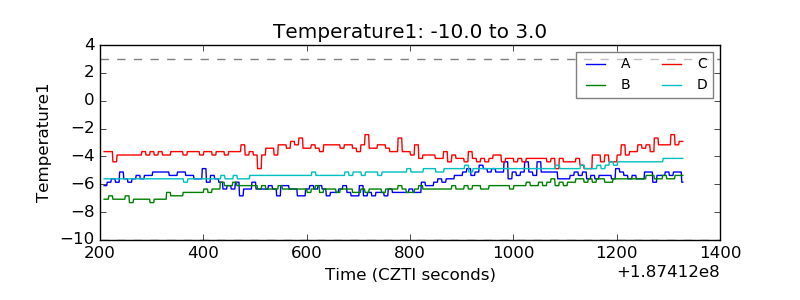 |
| Veto HV Monitor |  |
| Veto LLD |  |
| Alpha Counter |  |
| _CPM_Rate |  |
| CZT Counter |  |
| +2.5 Volts monitor | 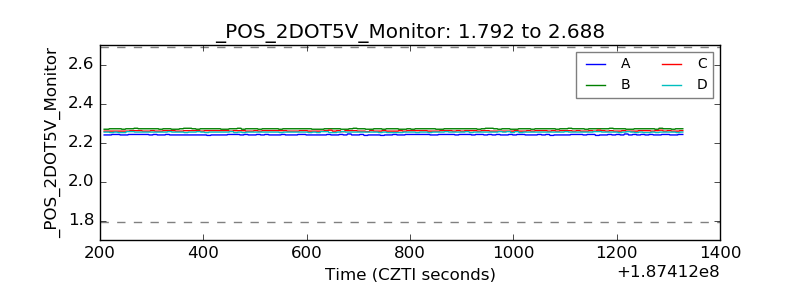 |
| +5 Volts monitor |  |
| _ROLL_ROT |  |
| _Roll_DEC | 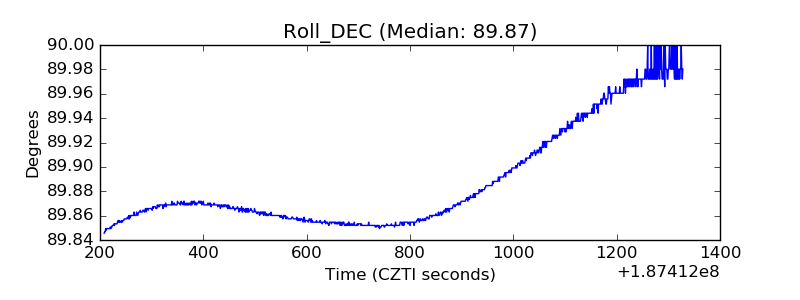 |
| _Roll_RA | 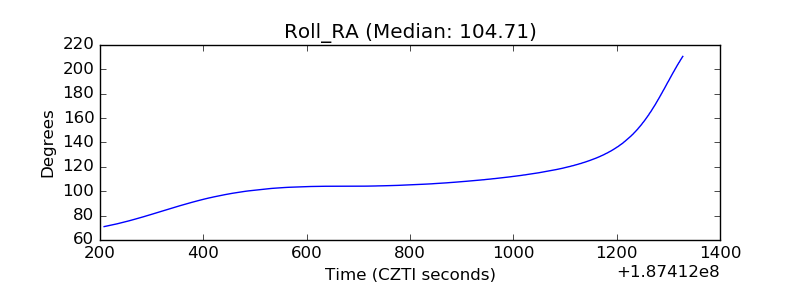 |
| Veto Counter |  |