| Param | Original file | Final file |
|---|---|---|
| Filename | modeM0/AS1P01_999T99_9000000210cztM0_level2.evt | modeM0/AS1P01_999T99_9000000210cztM0_level2_quad_clean.evt |
| Size (bytes) | 229,124,160 | 25,882,560 |
| Size | 218.5 MB | 24.7 MB |
| Events in quadrant A | 1,744,230 | 174,088 |
| Events in quadrant B | 1,810,825 | 177,660 |
| Events in quadrant C | 1,599,067 | 166,882 |
| Events in quadrant D | 1,693,520 | 164,855 |
| Mode M0 | |||
|---|---|---|---|
| Quadrant | BADHDUFLAG | Total packets | Discarded packets |
| A | 0 | 6127 | 0 |
| B | 0 | 6331 | 0 |
| C | 0 | 5701 | 0 |
| D | 0 | 6001 | 0 |
| Mode SS | |||
|---|---|---|---|
| Quadrant | BADHDUFLAG | Total packets | Discarded packets |
| A | 0 | 26 | 0 |
| B | 0 | 26 | 0 |
| C | 0 | 26 | 0 |
| D | 0 | 26 | 0 |
| Mode M9 | |||
|---|---|---|---|
| Quadrant | BADHDUFLAG | Total packets | Discarded packets |
| A | 0 | 7 | 0 |
| B | 0 | 7 | 0 |
| C | 0 | 7 | 0 |
| D | 0 | 7 | 0 |
| Quadrant | Total seconds | Saturated seconds | Saturation percentage |
|---|---|---|---|
| A | 1339 | 18 | 1.344287% |
| B | 1339 | 26 | 1.941748% |
| C | 1339 | 9 | 0.672143% |
| D | 1339 | 10 | 0.746826% |
Noise dominated data is calculated using 1-second bins in cleaned event files. If a bin has >2000 counts, and if more than 50% of those come from <1% of pixels, then it is considered to be noise-dominated and hence unusable.
| Quadrant | # 1 sec bins | Bins with >0 counts | Bins with >2000 counts | High rate bins dominated by noise | Noise dominated (total time) | Noise dominated (detector-on time) | Marked lightcurve |
|---|---|---|---|---|---|---|---|
| A | 1339 | 1339 | 83 | 83 | 6.20% | 6.20% | 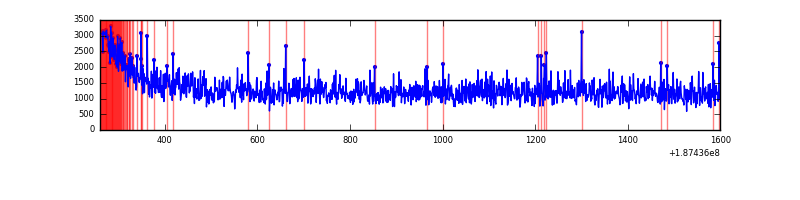 |
| B | 1339 | 1339 | 96 | 96 | 7.17% | 7.17% |  |
| C | 1339 | 1339 | 60 | 60 | 4.48% | 4.48% | 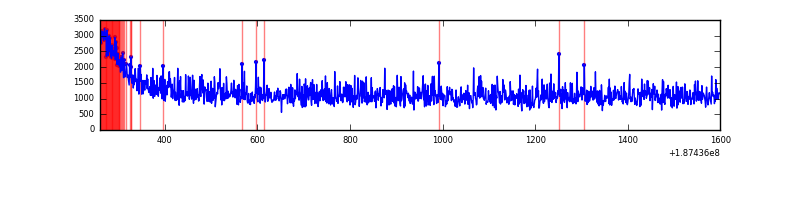 |
| D | 1339 | 1339 | 77 | 77 | 5.75% | 5.75% |  |
Top three noisy pixels from each quadrant. If the there are fewer than three noisy pixels in the level2.evt file, extra rows are filled as -1
| Pixel properties | Quadrant properties | ||||||
|---|---|---|---|---|---|---|---|
| Quadrant | DetID | PixID | Counts | Sigma | Mean | Median | Sigma |
| A | 11 | 79 | 2091 | 14.81 | 454 | 458 | 110.2 |
| A | 3 | 111 | 1547 | 9.88 | 454 | 458 | 110.2 |
| A | 13 | 9 | 1338 | 7.98 | 454 | 458 | 110.2 |
| B | 7 | 221 | 17034 | 147.83 | 459 | 461 | 112.1 |
| B | 14 | 53 | 14612 | 126.22 | 459 | 461 | 112.1 |
| B | 15 | 185 | 10933 | 93.41 | 459 | 461 | 112.1 |
| C | 15 | 241 | 62816 | 564.11 | 391 | 403 | 110.6 |
| C | 3 | 111 | 3496 | 27.96 | 391 | 403 | 110.6 |
| C | 3 | 143 | 2510 | 19.04 | 391 | 403 | 110.6 |
| D | 12 | 22 | 212683 | 1706.78 | 396 | 406 | 124.4 |
| D | 2 | 216 | 1410 | 8.07 | 396 | 406 | 124.4 |
| D | 13 | 169 | 1376 | 7.8 | 396 | 406 | 124.4 |
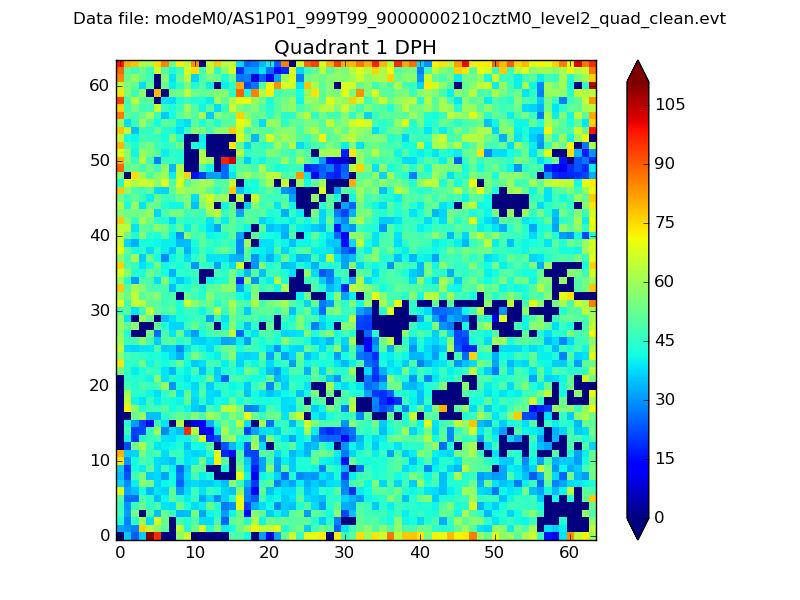
Histogram calculated using DETX and DETY for each event in the final _common_clean file
| Quadrant A |  |
 |
Quadrant B |
|---|---|---|---|
| Quadrant D | 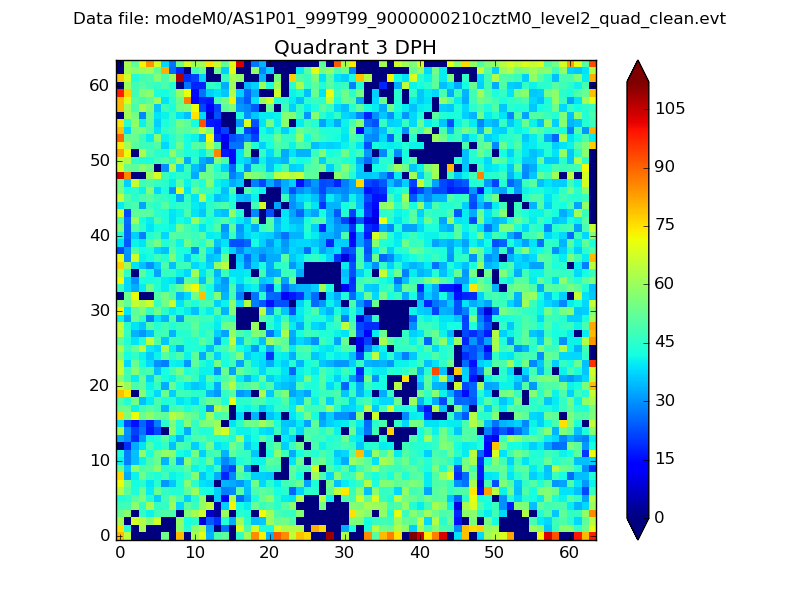 |
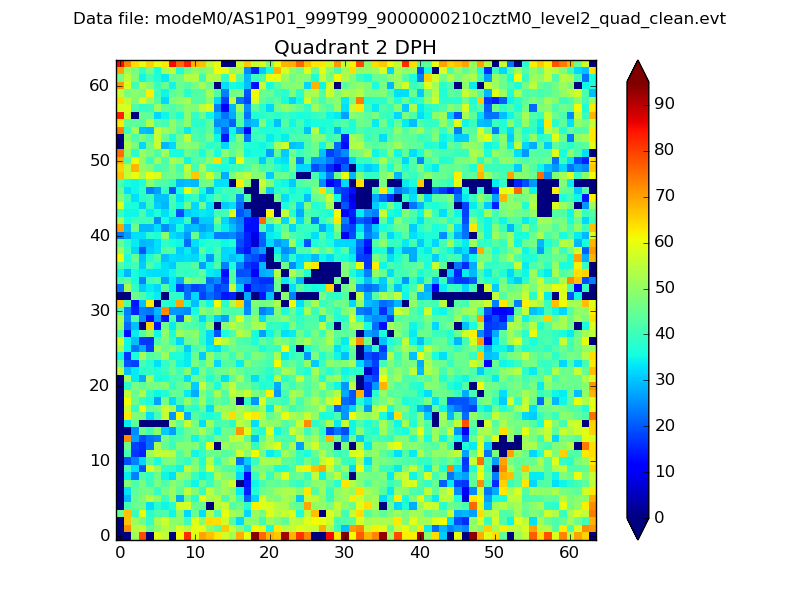 |
Quadrant C |
| Plot type | Count rate plots | Images |
|---|---|---|
| Comparison with Poisson distribution Blue bars denote a histogram of data divided into 1 sec bins. Red curve is a Poisson curve with rate = median count rate of data. |
 |
 |
| Quadrant-wise count rates Data is divided into 100 sec bins |
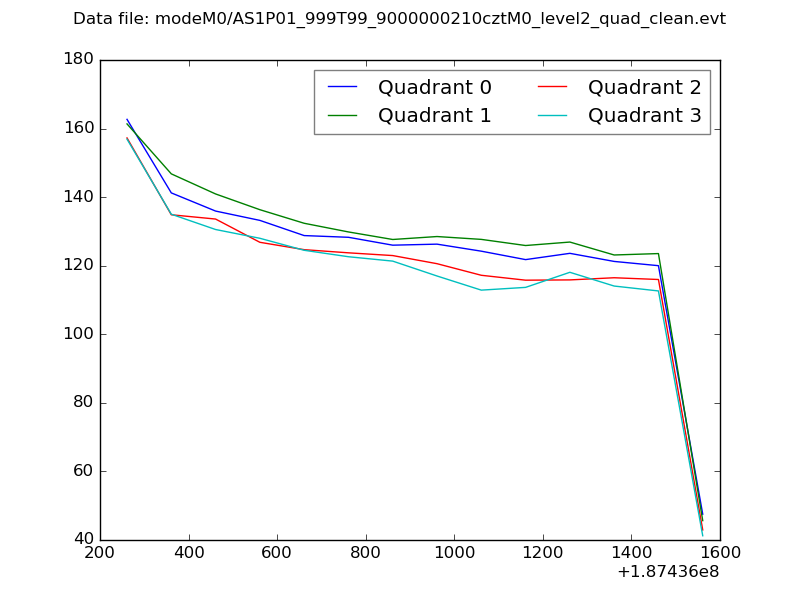 |
|
| Module-wise count rates for Quadrant A Data is divided into 100 sec bins |
 |
 |
| Module-wise count rates for Quadrant B Data is divided into 100 sec bins |
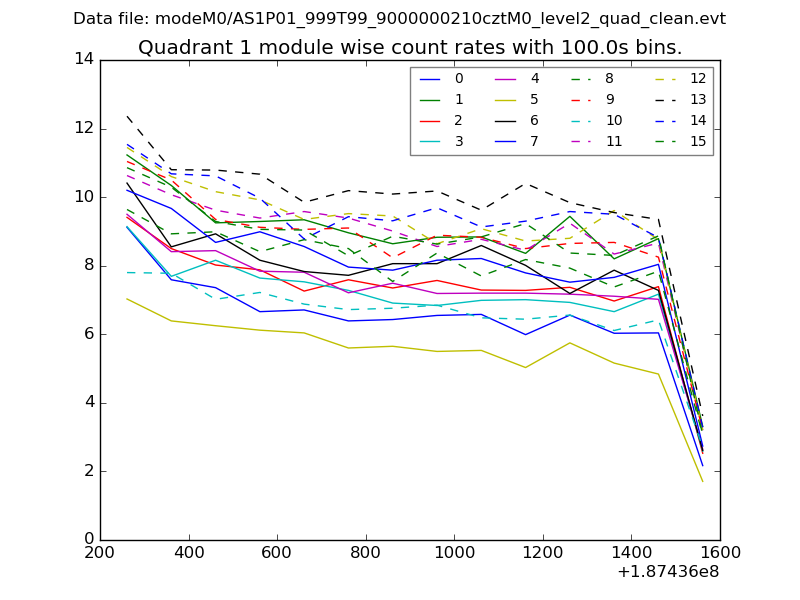 |
 |
| Module-wise count rates for Quadrant C Data is divided into 100 sec bins |
 |
 |
| Module-wise count rates for Quadrant D Data is divided into 100 sec bins |
 |
 |
| Parameter | Plot |
|---|---|
| CZT HV Monitor |  |
| D_VDD |  |
| Temperature 1 |  |
| Veto HV Monitor |  |
| Veto LLD |  |
| Alpha Counter |  |
| _CPM_Rate |  |
| CZT Counter | 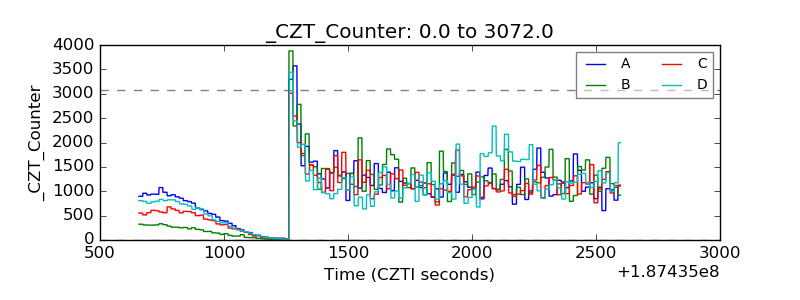 |
| +2.5 Volts monitor |  |
| +5 Volts monitor |  |
| _ROLL_ROT | 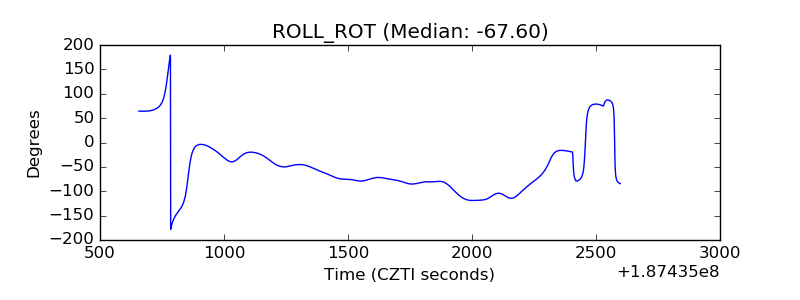 |
| _Roll_DEC | 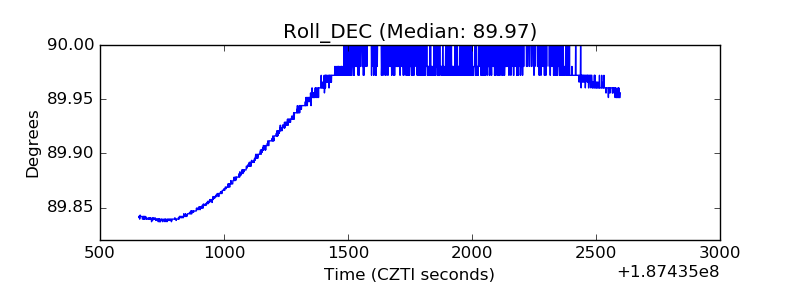 |
| _Roll_RA |  |
| Veto Counter |  |