| Param | Original file | Final file |
|---|---|---|
| Filename | modeM0/AS1G04_014T02_9000000228cztM0_level2_bc.evt | modeM0/AS1G04_014T02_9000000228cztM0_level2_quad_clean.evt |
| Size (bytes) | 75,398,400 | 23,601,600 |
| Size | 71.9 MB | 22.5 MB |
| Events in quadrant A | 286,408 | 158,548 |
| Events in quadrant B | 372,003 | 161,534 |
| Events in quadrant C | 329,423 | 154,485 |
| Events in quadrant D | 1,196,225 | 139,291 |
| Mode SS | |||
|---|---|---|---|
| Quadrant | BADHDUFLAG | Total packets | Discarded packets |
| A | 0 | 28 | 0 |
| B | 0 | 28 | 0 |
| C | 0 | 28 | 0 |
| D | 0 | 28 | 0 |
| Mode M0 | |||
|---|---|---|---|
| Quadrant | BADHDUFLAG | Total packets | Discarded packets |
| A | 0 | 5766 | 2 |
| B | 0 | 6569 | 1 |
| C | 0 | 6173 | 1 |
| D | 0 | 8571 | 1 |
| Quadrant | Total seconds | Saturated seconds | Saturation percentage |
|---|---|---|---|
| A | 1340 | 1 | 0.074627% |
| B | 1340 | 17 | 1.268657% |
| C | 1340 | 2 | 0.149254% |
| D | 1340 | 89 | 6.641791% |
Noise dominated data is calculated using 1-second bins in cleaned event files. If a bin has >2000 counts, and if more than 50% of those come from <1% of pixels, then it is considered to be noise-dominated and hence unusable.
| Quadrant | # 1 sec bins | Bins with >0 counts | Bins with >2000 counts | High rate bins dominated by noise | Noise dominated (total time) | Noise dominated (detector-on time) | Marked lightcurve |
|---|---|---|---|---|---|---|---|
| A | 1339 | 1339 | 0 | 0 | 0.00% | 0.00% | 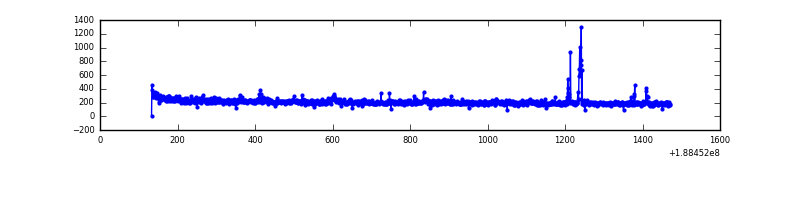 |
| B | 1339 | 1339 | 0 | 0 | 0.00% | 0.00% | 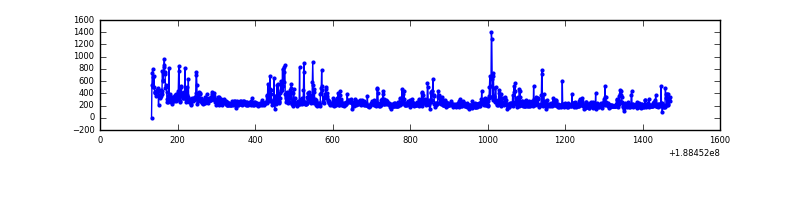 |
| C | 1338 | 1338 | 0 | 0 | 0.00% | 0.00% | 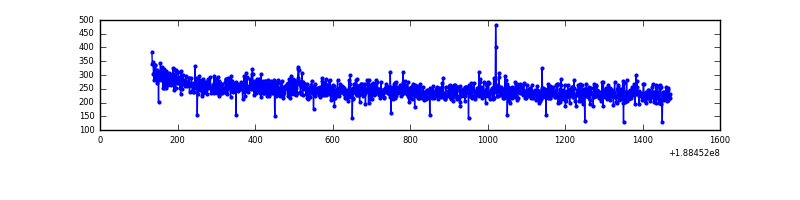 |
| D | 1340 | 1340 | 0 | 0 | 0.00% | 0.00% | 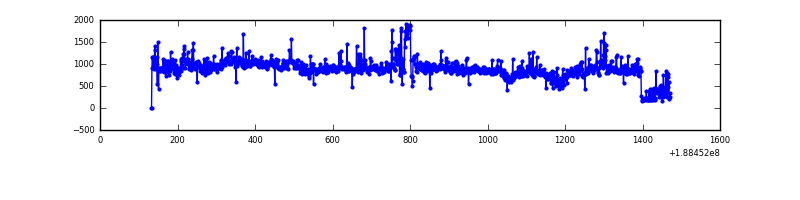 |
Top three noisy pixels from each quadrant. If the there are fewer than three noisy pixels in the level2.evt file, extra rows are filled as -1
| Pixel properties | Quadrant properties | ||||||
|---|---|---|---|---|---|---|---|
| Quadrant | DetID | PixID | Counts | Sigma | Mean | Median | Sigma |
| A | 4 | 32 | 8124 | 491.79 | 70 | 69 | 16.4 |
| A | 8 | 14 | 2448 | 145.25 | 70 | 69 | 16.4 |
| A | 13 | 9 | 2244 | 132.79 | 70 | 69 | 16.4 |
| B | 6 | 53 | 40195 | 2695.14 | 72 | 70 | 14.9 |
| B | 8 | 4 | 38124 | 2556.04 | 72 | 70 | 14.9 |
| B | 15 | 22 | 6970 | 463.46 | 72 | 70 | 14.9 |
| C | 15 | 241 | 52185 | 3290.53 | 69 | 68 | 15.8 |
| C | 9 | 52 | 1836 | 111.63 | 69 | 68 | 15.8 |
| C | 3 | 79 | 1481 | 89.21 | 69 | 68 | 15.8 |
| D | 12 | 22 | 811894 | 52000.97 | 65 | 63 | 15.6 |
| D | 10 | 84 | 63936 | 4091.32 | 65 | 63 | 15.6 |
| D | 13 | 169 | 59275 | 3792.76 | 65 | 63 | 15.6 |
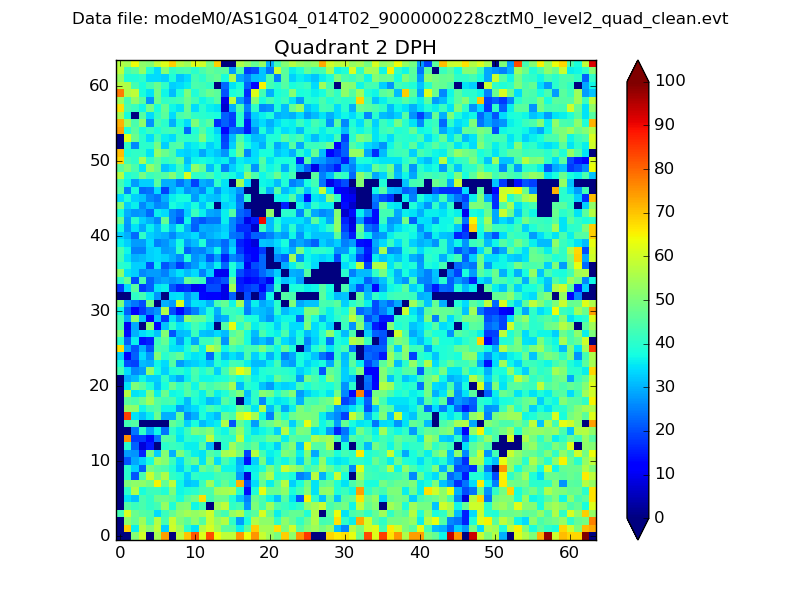
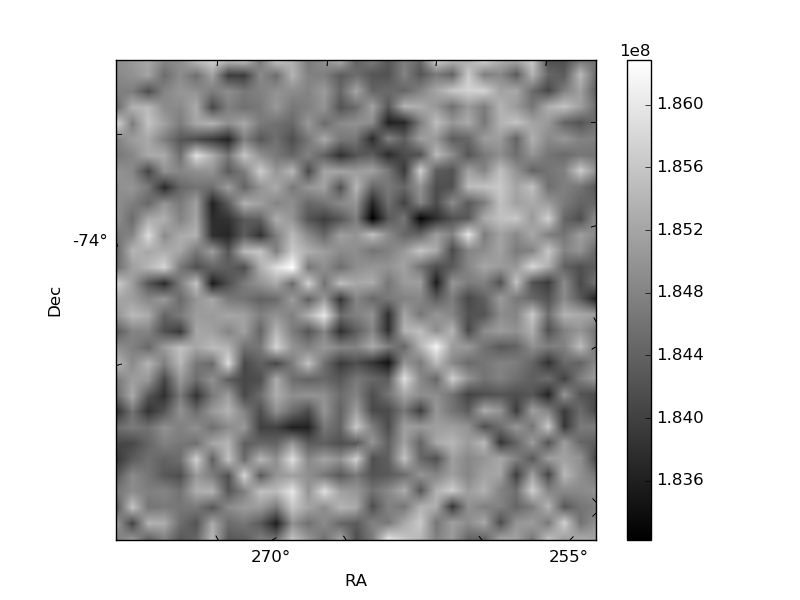
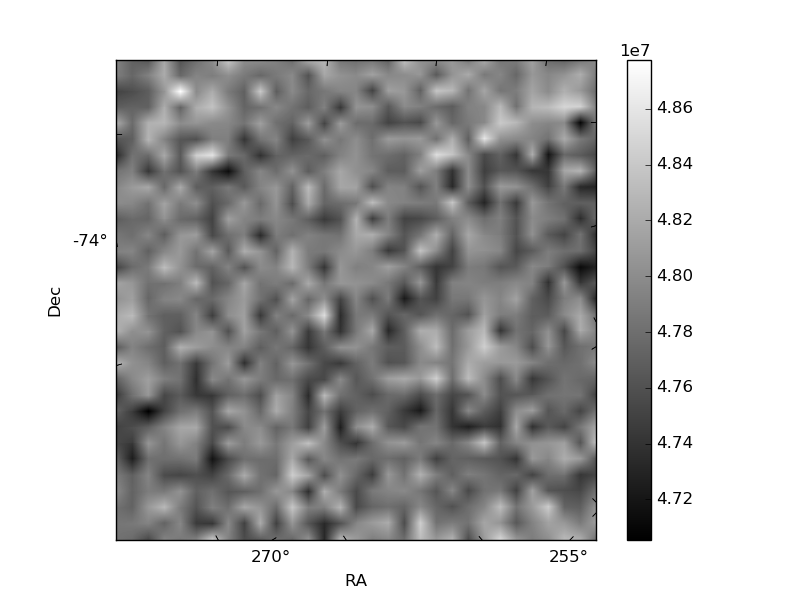
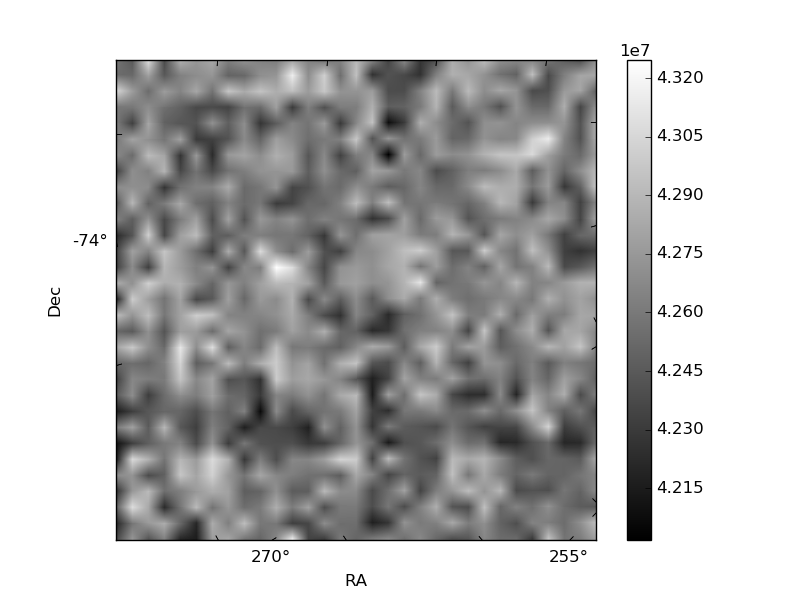
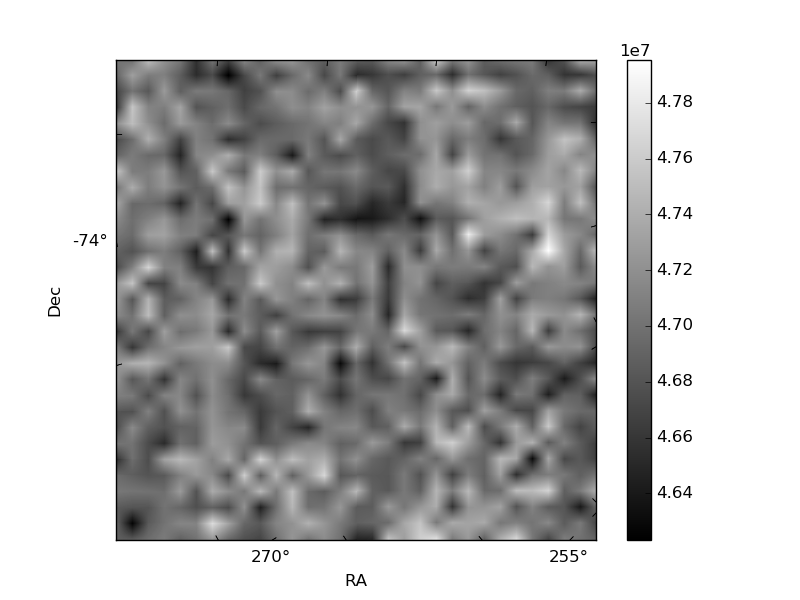
Histogram calculated using DETX and DETY for each event in the final _common_clean file
| Quadrant A | 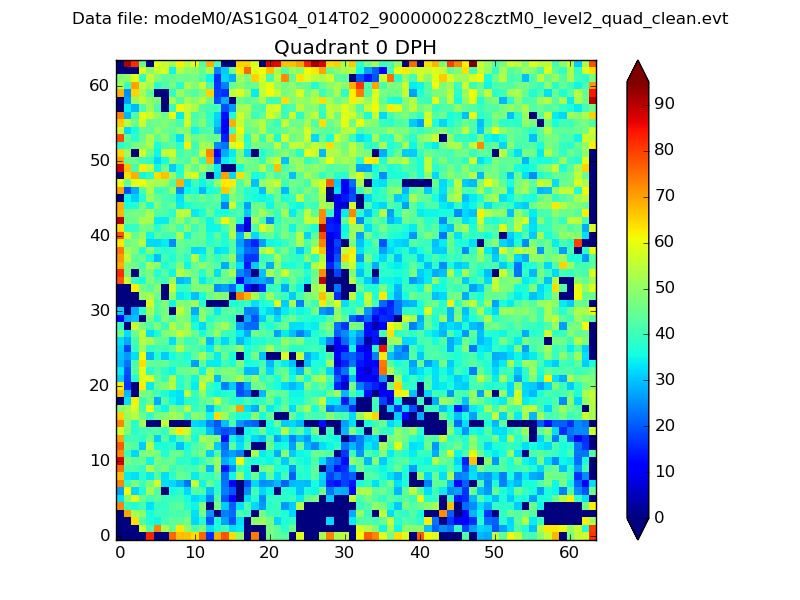 |
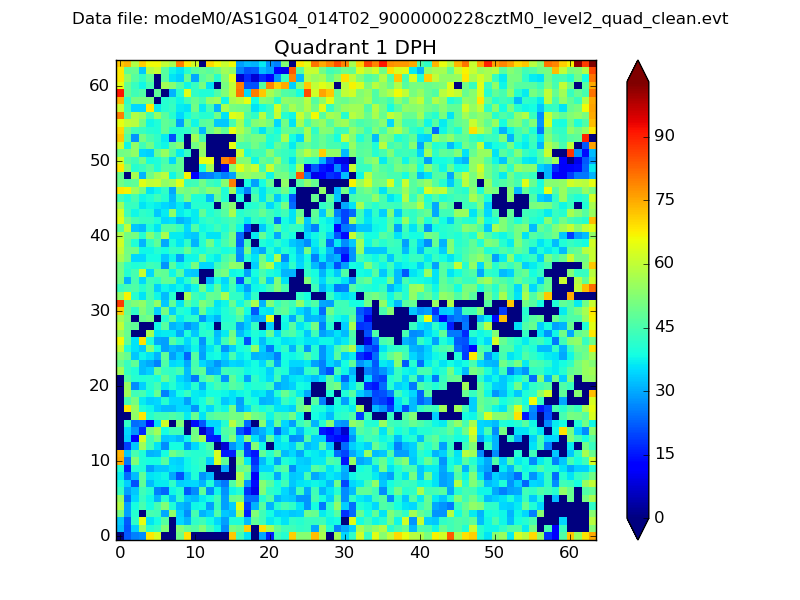 |
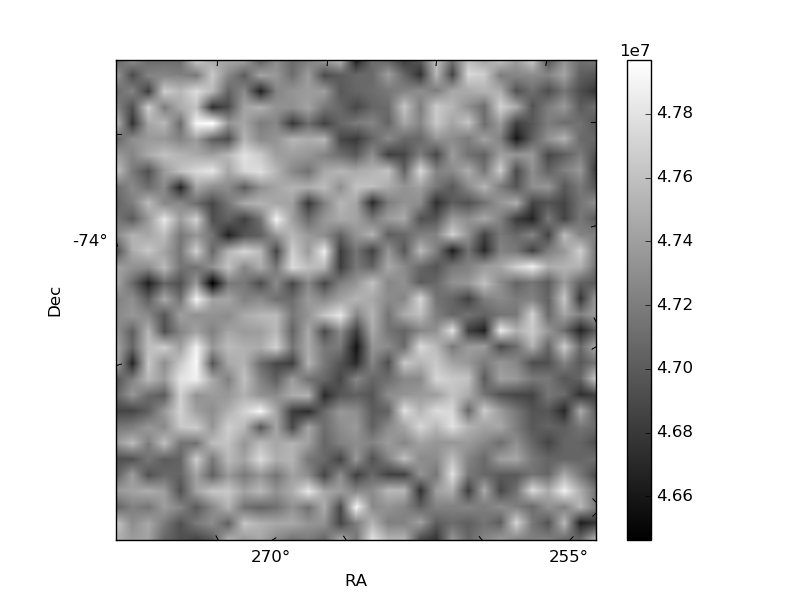
Quadrant B |
|---|---|---|---|
| Quadrant D | 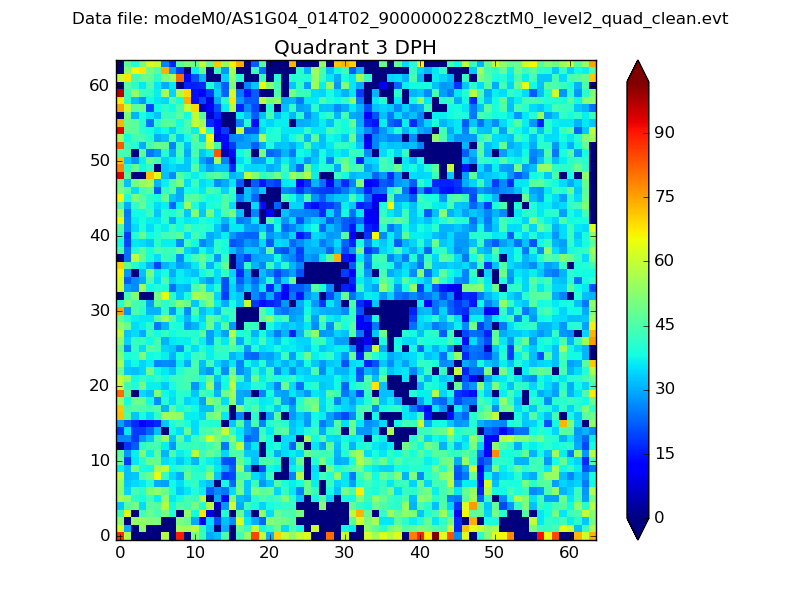 |
 |
Quadrant C |
| Plot type | Count rate plots | Images |
|---|---|---|
| Comparison with Poisson distribution Blue bars denote a histogram of data divided into 1 sec bins. Red curve is a Poisson curve with rate = median count rate of data. |
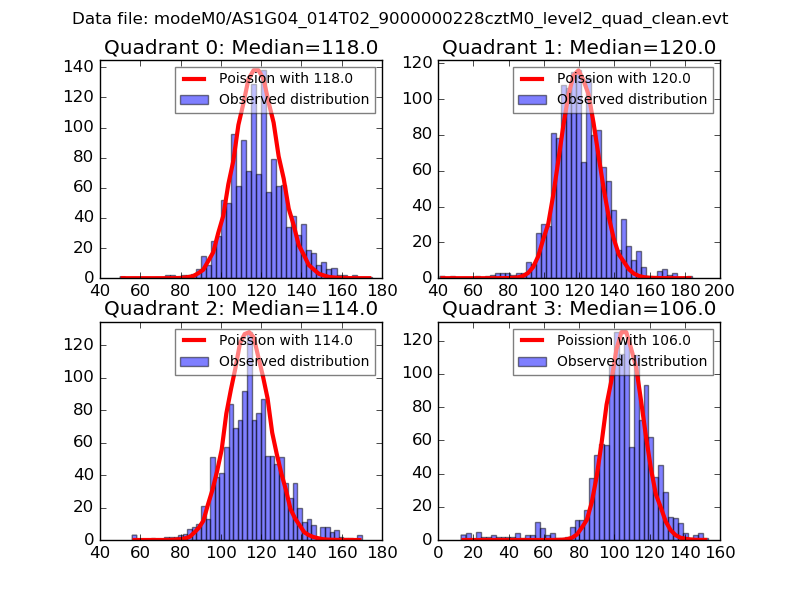 |
 |
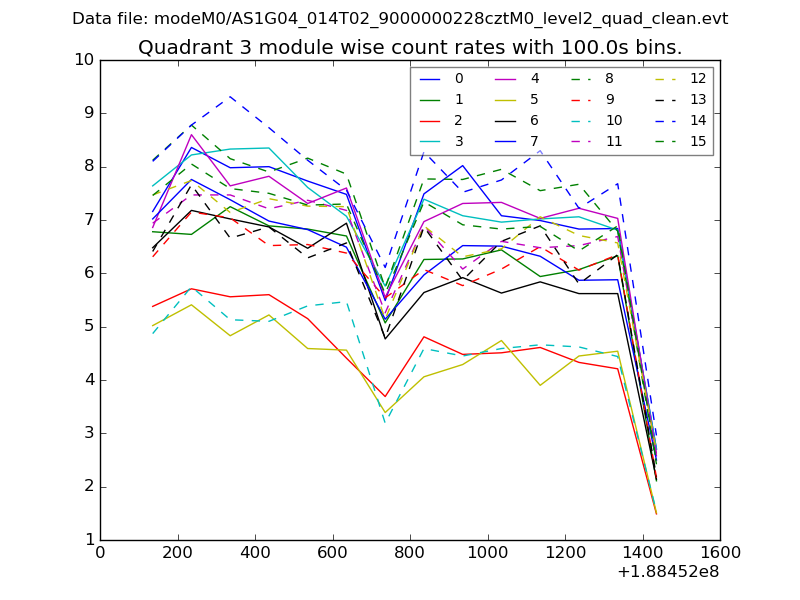
| Quadrant-wise count rates Data is divided into 100 sec bins |
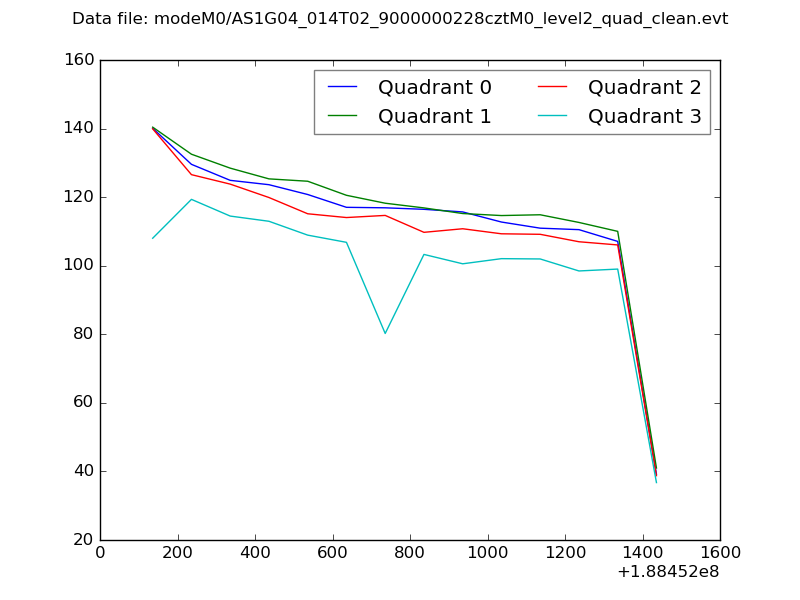 |
|
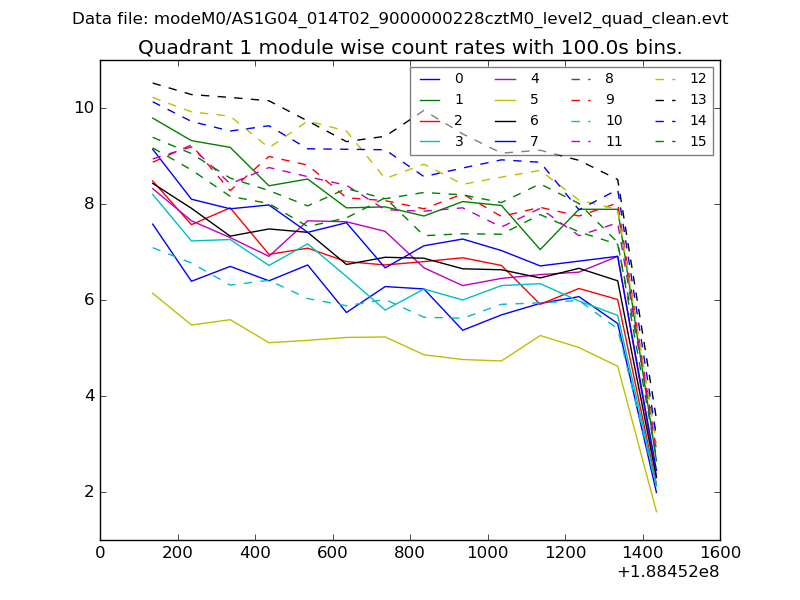
| Module-wise count rates for Quadrant A Data is divided into 100 sec bins |
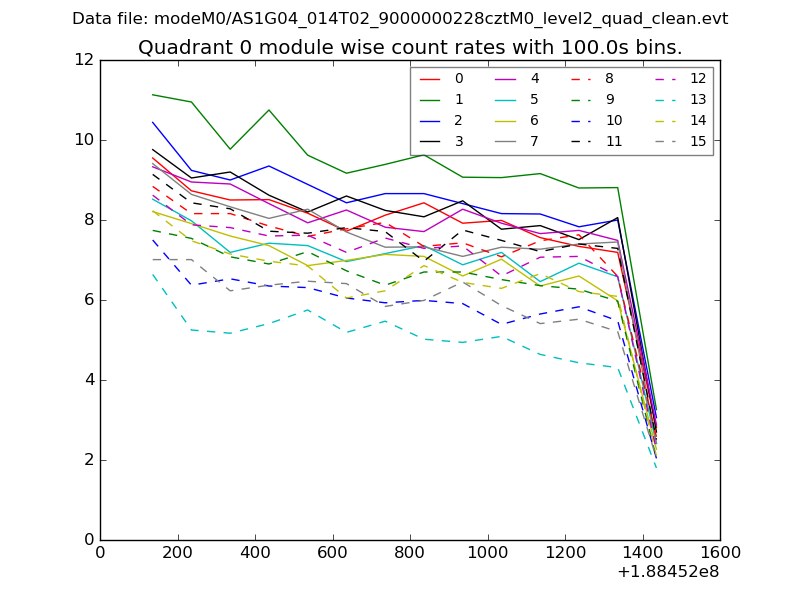 |
 |
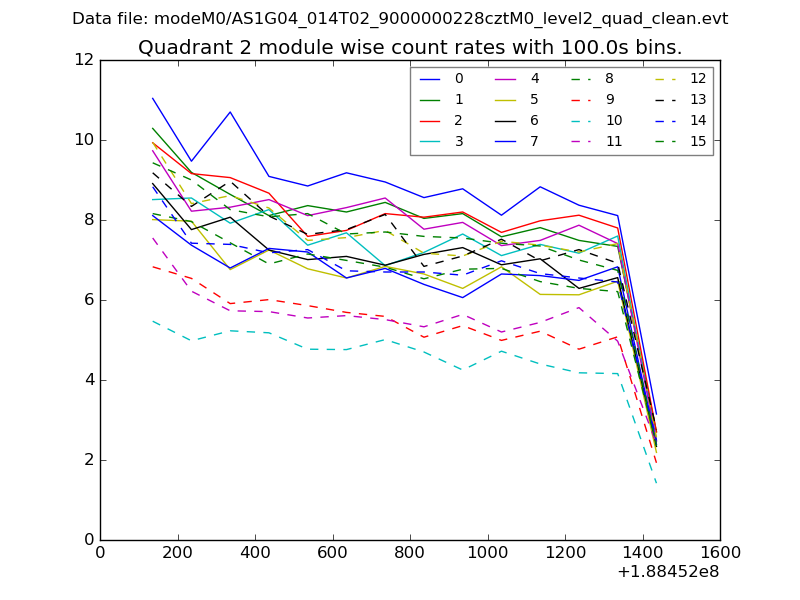
| Module-wise count rates for Quadrant B Data is divided into 100 sec bins |
 |
 |
| Module-wise count rates for Quadrant C Data is divided into 100 sec bins |
 |
 |
| Module-wise count rates for Quadrant D Data is divided into 100 sec bins |
 |
 |
| Parameter | Plot |
|---|---|
| CZT HV Monitor | 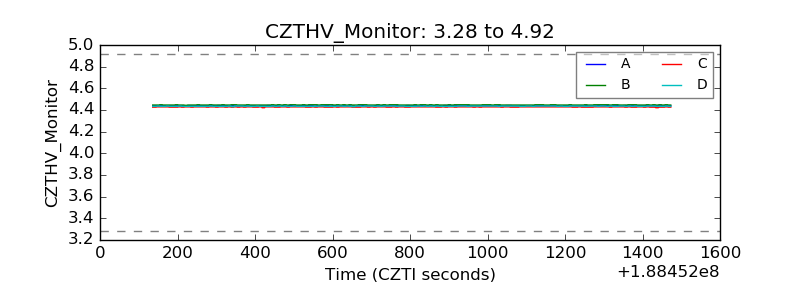 |
| D_VDD | 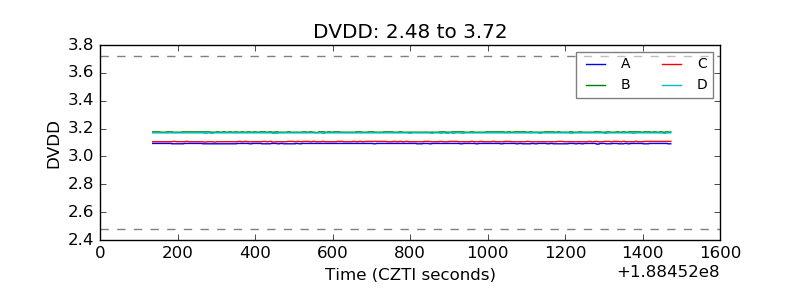 |
| Temperature 1 | 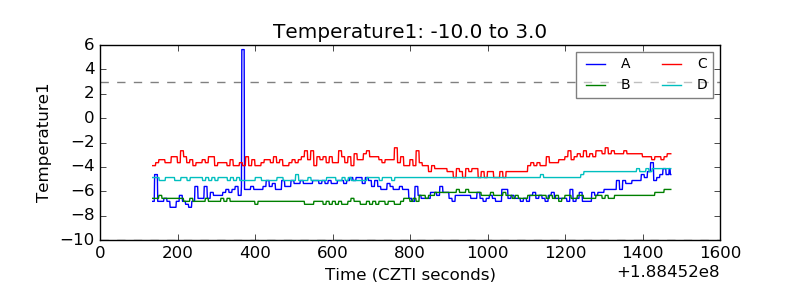 |
| Veto HV Monitor | 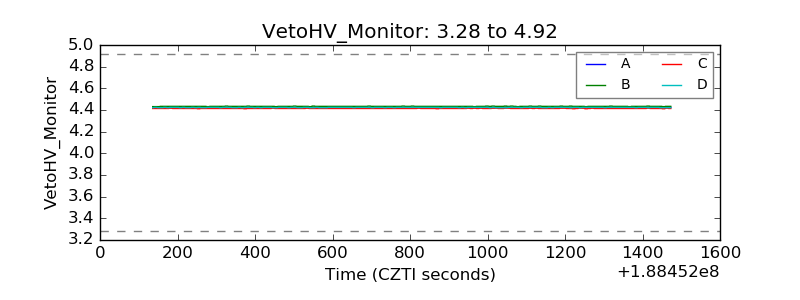 |
| Veto LLD | 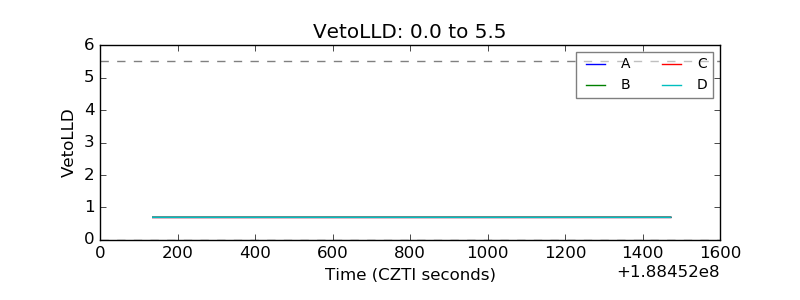 |
| Alpha Counter | 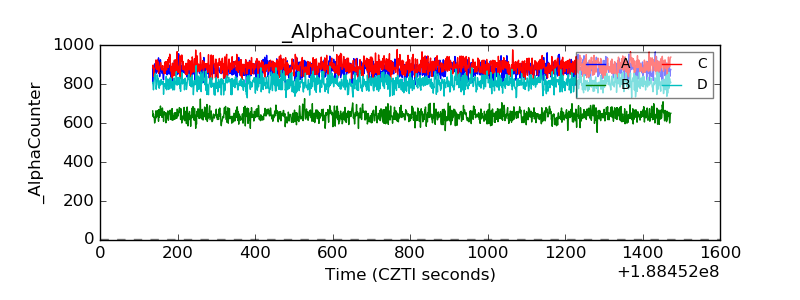 |
| _CPM_Rate | 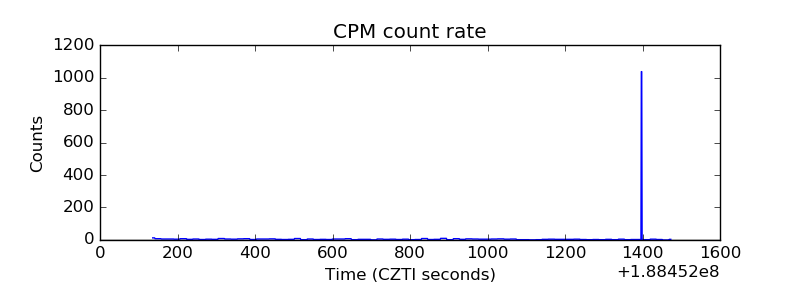 |
| CZT Counter | 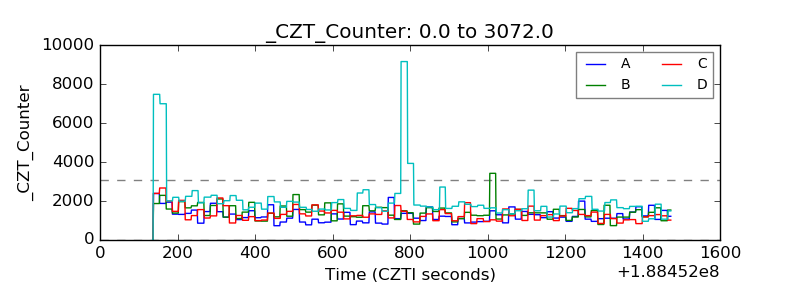 |
| +2.5 Volts monitor | 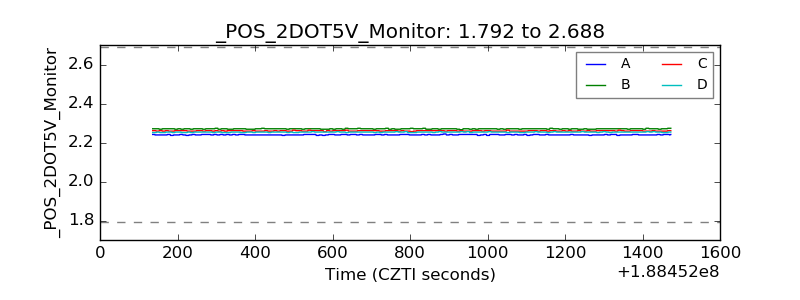 |
| +5 Volts monitor | 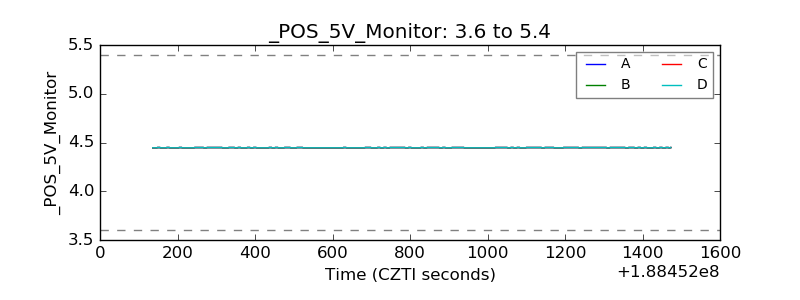 |
| _ROLL_ROT | 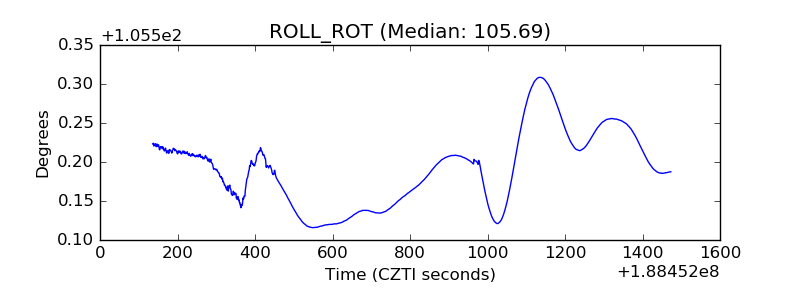 |
| _Roll_DEC | 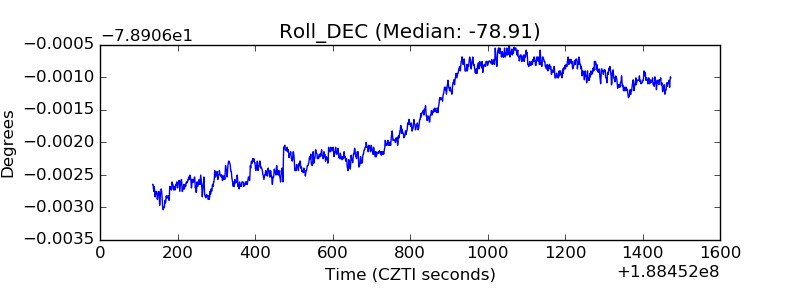 |
| _Roll_RA | 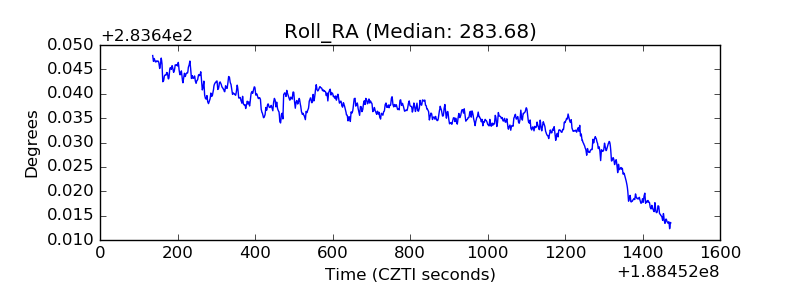 |
| Veto Counter | 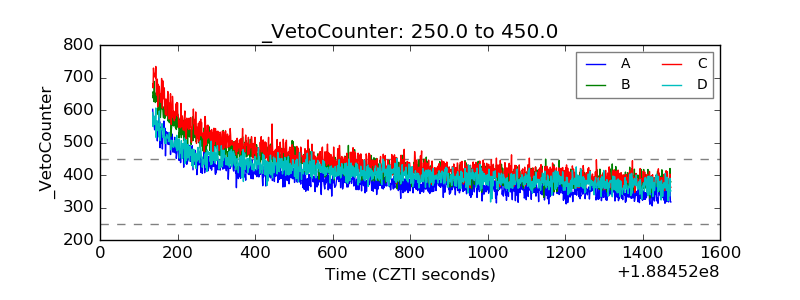 |