| Param | Original file | Final file |
|---|---|---|
| Filename | modeM0/AS1P01_162T08_9000000248cztM0_level2.evt | modeM0/AS1P01_162T08_9000000248cztM0_level2_quad_clean.evt |
| Size (bytes) | 3,299,518,080 | 204,451,200 |
| Size | 3.1 GB | 195.0 MB |
| Events in quadrant A | 24,272,265 | 1,224,871 |
| Events in quadrant B | 28,127,728 | 1,225,090 |
| Events in quadrant C | 23,738,178 | 1,201,761 |
| Events in quadrant D | 22,482,232 | 1,174,075 |
| Mode M9 | |||
|---|---|---|---|
| Quadrant | BADHDUFLAG | Total packets | Discarded packets |
| A | 0 | 17 | 0 |
| B | 0 | 17 | 0 |
| C | 0 | 17 | 0 |
| D | 0 | 17 | 0 |
| Mode SS | |||
|---|---|---|---|
| Quadrant | BADHDUFLAG | Total packets | Discarded packets |
| A | 0 | 404 | 0 |
| B | 0 | 404 | 0 |
| C | 0 | 404 | 0 |
| D | 0 | 404 | 0 |
| Mode M0 | |||
|---|---|---|---|
| Quadrant | BADHDUFLAG | Total packets | Discarded packets |
| A | 0 | 86067 | 0 |
| B | 0 | 97514 | 0 |
| C | 0 | 84626 | 0 |
| D | 0 | 80994 | 0 |
| Quadrant | Total seconds | Saturated seconds | Saturation percentage |
|---|---|---|---|
| A | 19828 | 67 | 0.337906% |
| B | 19828 | 375 | 1.891265% |
| C | 19828 | 57 | 0.287472% |
| D | 19828 | 211 | 1.064152% |
Noise dominated data is calculated using 1-second bins in cleaned event files. If a bin has >2000 counts, and if more than 50% of those come from <1% of pixels, then it is considered to be noise-dominated and hence unusable.
| Quadrant | # 1 sec bins | Bins with >0 counts | Bins with >2000 counts | High rate bins dominated by noise | Noise dominated (total time) | Noise dominated (detector-on time) | Marked lightcurve |
|---|---|---|---|---|---|---|---|
| A | 20718 | 19832 | 914 | 914 | 4.41% | 4.61% |  |
| B | 20718 | 19832 | 2384 | 2384 | 11.51% | 12.02% |  |
| C | 20718 | 19832 | 751 | 751 | 3.62% | 3.79% |  |
| D | 20718 | 19832 | 844 | 844 | 4.07% | 4.26% |  |
Top three noisy pixels from each quadrant. If the there are fewer than three noisy pixels in the level2.evt file, extra rows are filled as -1
| Pixel properties | Quadrant properties | ||||||
|---|---|---|---|---|---|---|---|
| Quadrant | DetID | PixID | Counts | Sigma | Mean | Median | Sigma |
| A | 15 | 127 | 278211 | 182.67 | 6157 | 6204 | 1489.0 |
| A | 13 | 17 | 147069 | 94.6 | 6157 | 6204 | 1489.0 |
| A | 4 | 32 | 86586 | 53.98 | 6157 | 6204 | 1489.0 |
| B | 8 | 4 | 1246482 | 828.17 | 6414 | 6450 | 1497.3 |
| B | 6 | 53 | 562210 | 371.17 | 6414 | 6450 | 1497.3 |
| B | 5 | 249 | 490773 | 323.46 | 6414 | 6450 | 1497.3 |
| C | 15 | 241 | 688062 | 420.48 | 5830 | 6032 | 1622.0 |
| C | 3 | 79 | 115192 | 67.3 | 5830 | 6032 | 1622.0 |
| C | 3 | 111 | 82922 | 47.4 | 5830 | 6032 | 1622.0 |
| D | 5 | 190 | 274350 | 153.45 | 5619 | 5839 | 1749.8 |
| D | 9 | 66 | 235818 | 131.43 | 5619 | 5839 | 1749.8 |
| D | 9 | 53 | 212120 | 117.89 | 5619 | 5839 | 1749.8 |
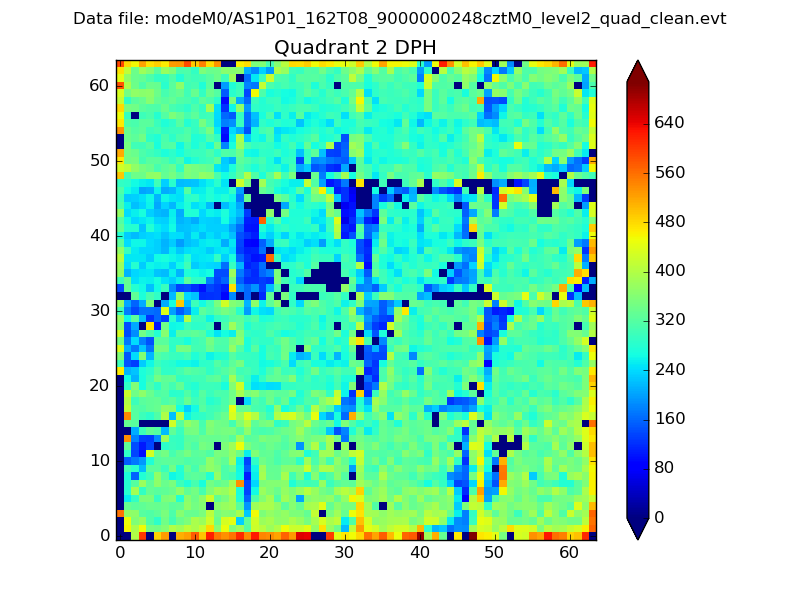
Histogram calculated using DETX and DETY for each event in the final _common_clean file
| Quadrant A | 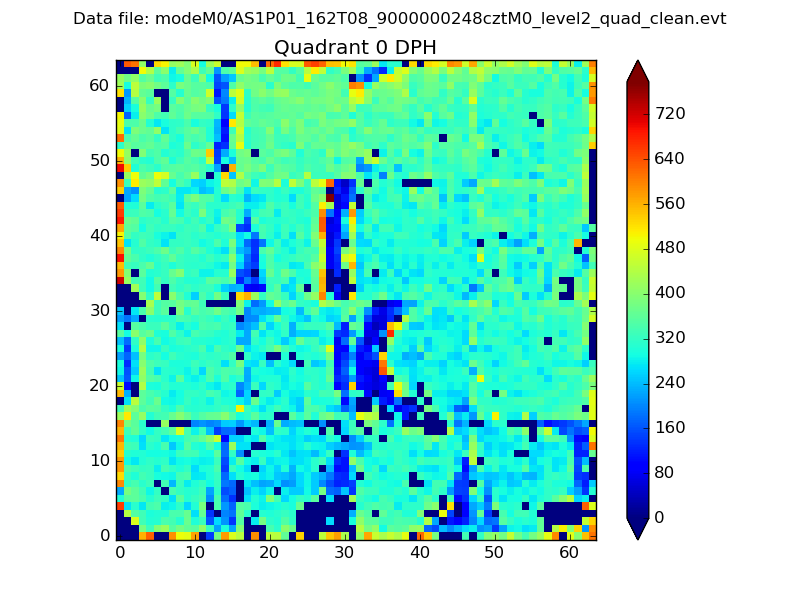 |
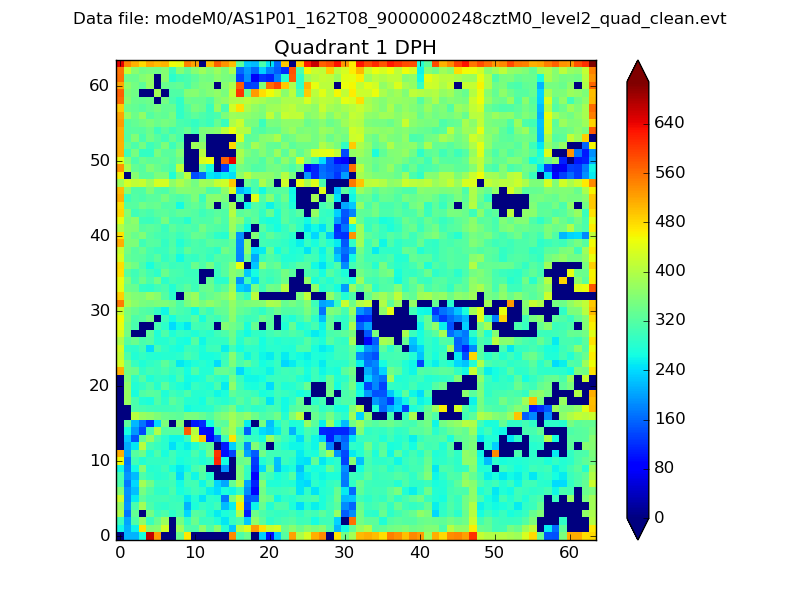 |
Quadrant B |
|---|---|---|---|
| Quadrant D | 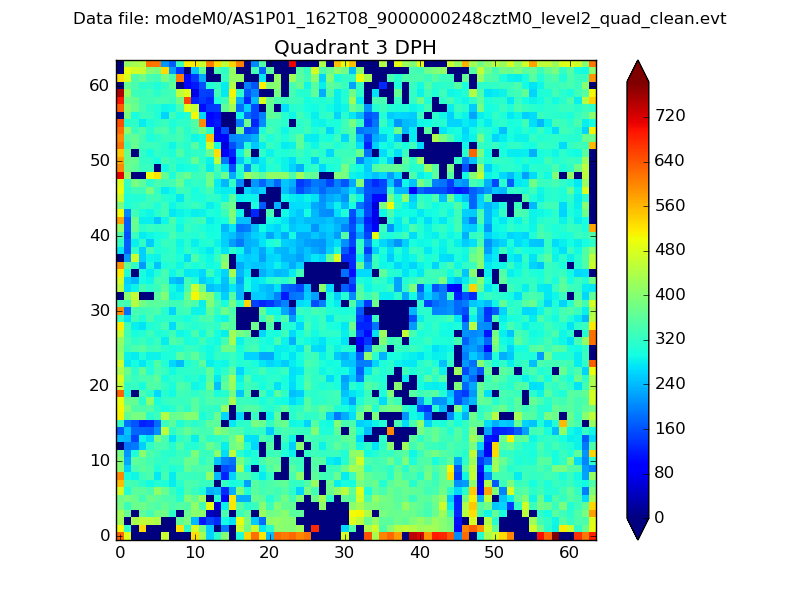 |
 |
Quadrant C |
| Plot type | Count rate plots | Images |
|---|---|---|
| Comparison with Poisson distribution Blue bars denote a histogram of data divided into 1 sec bins. Red curve is a Poisson curve with rate = median count rate of data. |
 |
 |
| Quadrant-wise count rates Data is divided into 100 sec bins |
 |
|
| Module-wise count rates for Quadrant A Data is divided into 100 sec bins |
 |
 |
| Module-wise count rates for Quadrant B Data is divided into 100 sec bins |
 |
 |
| Module-wise count rates for Quadrant C Data is divided into 100 sec bins |
 |
 |
| Module-wise count rates for Quadrant D Data is divided into 100 sec bins |
 |
 |
| Parameter | Plot |
|---|---|
| CZT HV Monitor |  |
| D_VDD |  |
| Temperature 1 |  |
| Veto HV Monitor |  |
| Veto LLD |  |
| Alpha Counter |  |
| _CPM_Rate |  |
| CZT Counter |  |
| +2.5 Volts monitor |  |
| +5 Volts monitor |  |
| _ROLL_ROT |  |
| _Roll_DEC |  |
| _Roll_RA |  |
| Veto Counter |  |