| Param | Original file | Final file |
|---|---|---|
| Filename | modeM0/AS1G05_211T01_9000000464cztM0_level2_bc.evt | modeM0/AS1G05_211T01_9000000464cztM0_level2_quad_clean.evt |
| Size (bytes) | 308,744,640 | 101,324,160 |
| Size | 294.4 MB | 96.6 MB |
| Events in quadrant A | 1,982,659 | 630,957 |
| Events in quadrant B | 1,996,711 | 636,658 |
| Events in quadrant C | 3,202,954 | 615,572 |
| Events in quadrant D | 1,599,308 | 612,862 |
| Mode M0 | |||
|---|---|---|---|
| Quadrant | BADHDUFLAG | Total packets | Discarded packets |
| A | 0 | 18721 | 0 |
| B | 0 | 17906 | 0 |
| C | 0 | 22159 | 0 |
| D | 0 | 17107 | 0 |
| Mode SS | |||
|---|---|---|---|
| Quadrant | BADHDUFLAG | Total packets | Discarded packets |
| A | 0 | 166 | 0 |
| B | 0 | 166 | 0 |
| C | 0 | 166 | 0 |
| D | 0 | 166 | 0 |
| Mode M9 | |||
|---|---|---|---|
| Quadrant | BADHDUFLAG | Total packets | Discarded packets |
| A | 0 | 10 | 0 |
| B | 0 | 10 | 0 |
| C | 0 | 10 | 0 |
| D | 0 | 11 | 0 |
| Quadrant | Total seconds | Saturated seconds | Saturation percentage |
|---|---|---|---|
| A | 8240 | 262 | 3.179612% |
| B | 8240 | 139 | 1.686893% |
| C | 8240 | 432 | 5.242718% |
| D | 8240 | 90 | 1.092233% |
Noise dominated data is calculated using 1-second bins in cleaned event files. If a bin has >2000 counts, and if more than 50% of those come from <1% of pixels, then it is considered to be noise-dominated and hence unusable.
| Quadrant | # 1 sec bins | Bins with >0 counts | Bins with >2000 counts | High rate bins dominated by noise | Noise dominated (total time) | Noise dominated (detector-on time) | Marked lightcurve |
|---|---|---|---|---|---|---|---|
| A | 9074 | 8238 | 3 | 3 | 0.03% | 0.04% | 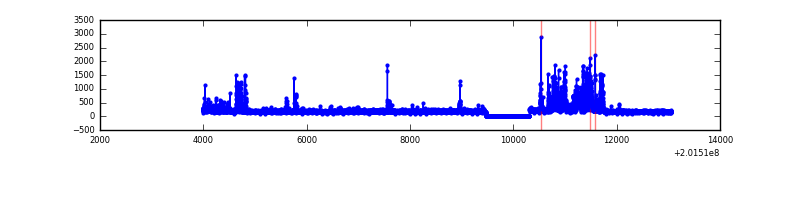 |
| B | 9074 | 8238 | 0 | 0 | 0.00% | 0.00% |  |
| C | 9074 | 8238 | 98 | 98 | 1.08% | 1.19% |  |
| D | 9074 | 8239 | 0 | 0 | 0.00% | 0.00% |  |
Top three noisy pixels from each quadrant. If the there are fewer than three noisy pixels in the level2.evt file, extra rows are filled as -1
| Pixel properties | Quadrant properties | ||||||
|---|---|---|---|---|---|---|---|
| Quadrant | DetID | PixID | Counts | Sigma | Mean | Median | Sigma |
| A | 0 | 50 | 465952 | 5405.5 | 375 | 365 | 86.1 |
| A | 0 | 118 | 33345 | 382.9 | 375 | 365 | 86.1 |
| A | 8 | 15 | 14389 | 162.82 | 375 | 365 | 86.1 |
| B | 15 | 204 | 330333 | 4348.51 | 381 | 368 | 75.9 |
| B | 4 | 81 | 76741 | 1006.5 | 381 | 368 | 75.9 |
| B | 15 | 85 | 33694 | 439.19 | 381 | 368 | 75.9 |
| C | 1 | 192 | 1498426 | 17911.2 | 363 | 356 | 83.6 |
| C | 7 | 220 | 192670 | 2299.34 | 363 | 356 | 83.6 |
| C | 14 | 223 | 43867 | 520.23 | 363 | 356 | 83.6 |
| D | 2 | 37 | 33033 | 360.33 | 373 | 356 | 90.7 |
| D | 10 | 231 | 26532 | 288.64 | 373 | 356 | 90.7 |
| D | 13 | 223 | 23290 | 252.89 | 373 | 356 | 90.7 |
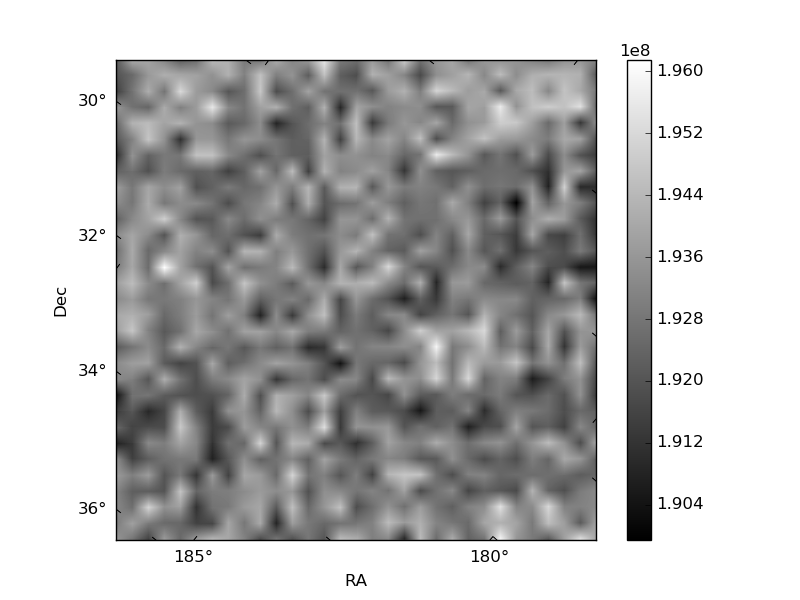
Histogram calculated using DETX and DETY for each event in the final _common_clean file
| Quadrant A | 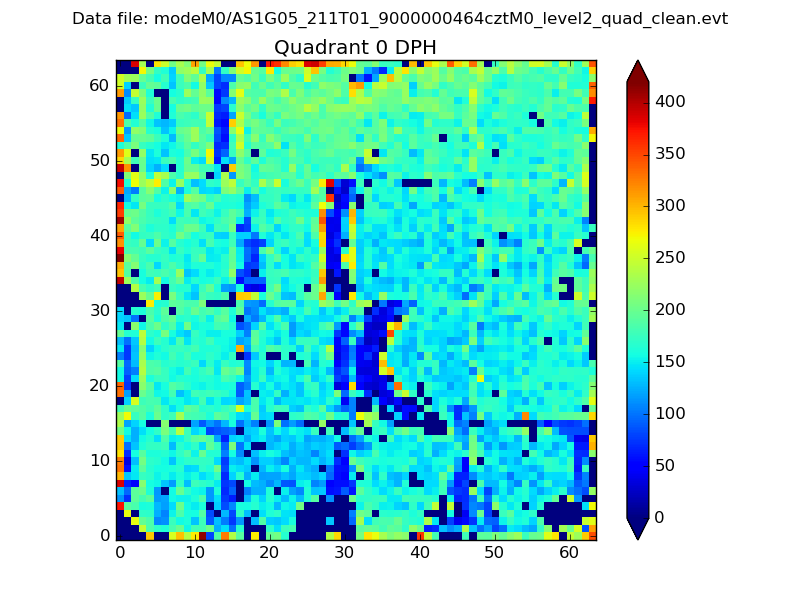 |
 |
Quadrant B |
|---|---|---|---|
| Quadrant D | 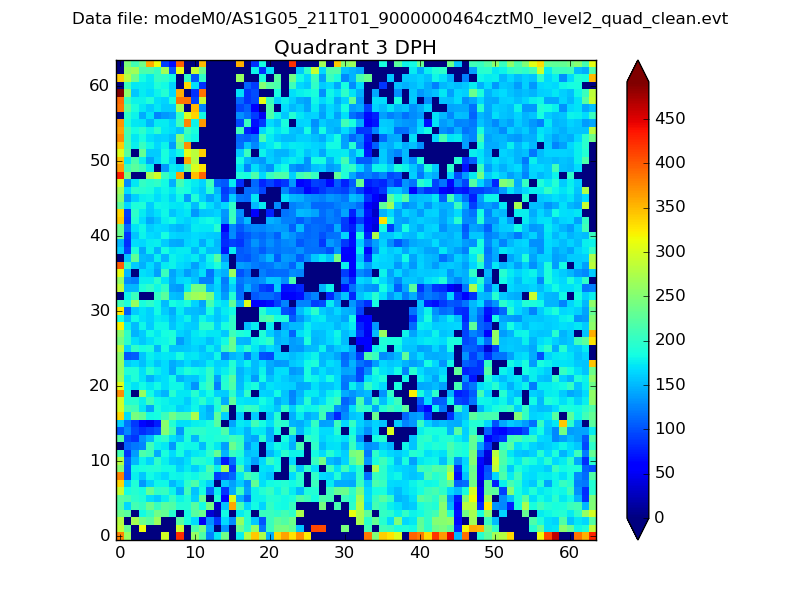 |
 |
Quadrant C |
| Plot type | Count rate plots | Images |
|---|---|---|
| Comparison with Poisson distribution Blue bars denote a histogram of data divided into 1 sec bins. Red curve is a Poisson curve with rate = median count rate of data. |
 |
 |
| Quadrant-wise count rates Data is divided into 100 sec bins |
 |
|
| Module-wise count rates for Quadrant A Data is divided into 100 sec bins |
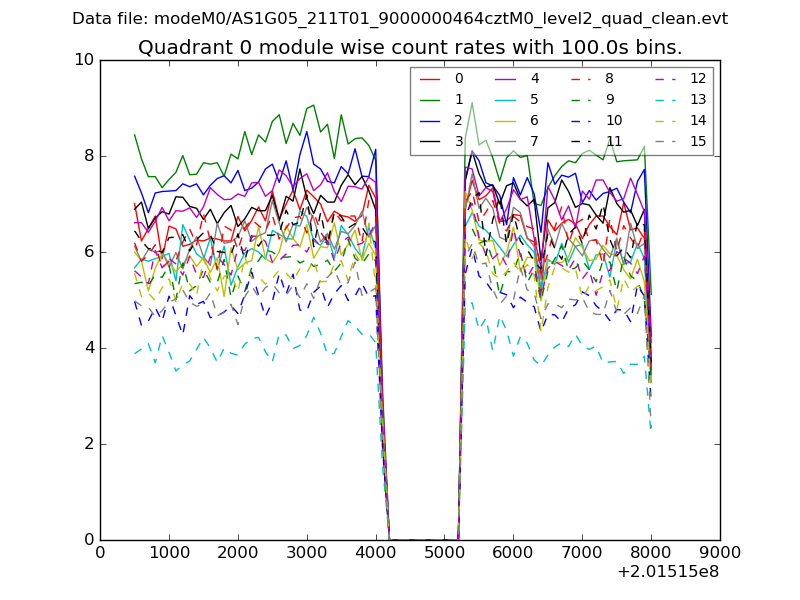 |
 |
| Module-wise count rates for Quadrant B Data is divided into 100 sec bins |
 |
 |
| Module-wise count rates for Quadrant C Data is divided into 100 sec bins |
 |
 |
| Module-wise count rates for Quadrant D Data is divided into 100 sec bins |
 |
 |
| Parameter | Plot |
|---|---|
| CZT HV Monitor |  |
| D_VDD |  |
| Temperature 1 |  |
| Veto HV Monitor |  |
| Veto LLD |  |
| Alpha Counter |  |
| _CPM_Rate | 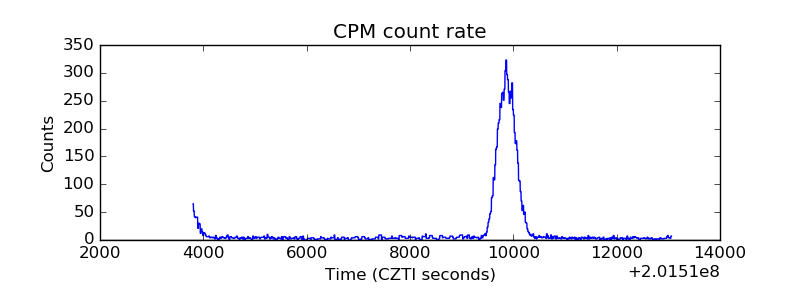 |
| CZT Counter |  |
| +2.5 Volts monitor |  |
| +5 Volts monitor |  |
| _ROLL_ROT |  |
| _Roll_DEC | 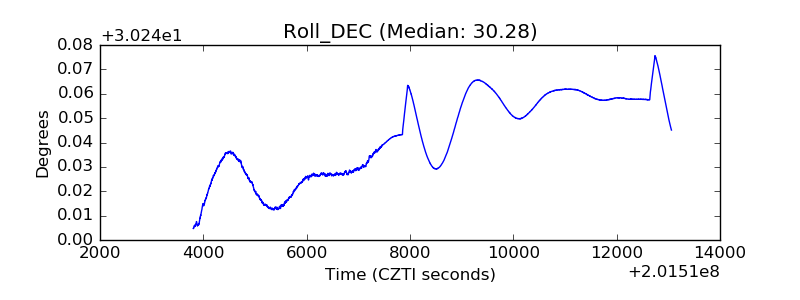 |
| _Roll_RA |  |
| Veto Counter |  |