| Param | Original file | Final file |
|---|---|---|
| Filename | modeM0/AS1G05_218T03_9000000582cztM0_level2_bc.evt | modeM0/AS1G05_218T03_9000000582cztM0_level2_quad_clean.evt |
| Size (bytes) | 3,143,701,440 | 1,173,283,200 |
| Size | 2.9 GB | 1.1 GB |
| Events in quadrant A | 19,383,383 | 7,471,758 |
| Events in quadrant B | 20,810,062 | 7,645,829 |
| Events in quadrant C | 17,352,048 | 7,369,104 |
| Events in quadrant D | 31,459,374 | 6,812,565 |
| Mode M9 | |||
|---|---|---|---|
| Quadrant | BADHDUFLAG | Total packets | Discarded packets |
| A | 0 | 151 | 0 |
| B | 0 | 151 | 0 |
| C | 0 | 151 | 0 |
| D | 0 | 152 | 0 |
| Mode SS | |||
|---|---|---|---|
| Quadrant | BADHDUFLAG | Total packets | Discarded packets |
| A | 0 | 1854 | 0 |
| B | 0 | 1856 | 0 |
| C | 0 | 1856 | 0 |
| D | 0 | 1856 | 0 |
| Mode M0 | |||
|---|---|---|---|
| Quadrant | BADHDUFLAG | Total packets | Discarded packets |
| A | 0 | 192537 | 0 |
| B | 0 | 195885 | 0 |
| C | 0 | 187168 | 0 |
| D | 0 | 238614 | 0 |
| Quadrant | Total seconds | Saturated seconds | Saturation percentage |
|---|---|---|---|
| A | 90980 | 1259 | 1.383821% |
| B | 90977 | 1507 | 1.656463% |
| C | 90986 | 877 | 0.963885% |
| D | 90976 | 4450 | 4.891400% |
Noise dominated data is calculated using 1-second bins in cleaned event files. If a bin has >2000 counts, and if more than 50% of those come from <1% of pixels, then it is considered to be noise-dominated and hence unusable.
| Quadrant | # 1 sec bins | Bins with >0 counts | Bins with >2000 counts | High rate bins dominated by noise | Noise dominated (total time) | Noise dominated (detector-on time) | Marked lightcurve |
|---|---|---|---|---|---|---|---|
| A | 106692 | 90993 | 36 | 36 | 0.03% | 0.04% | 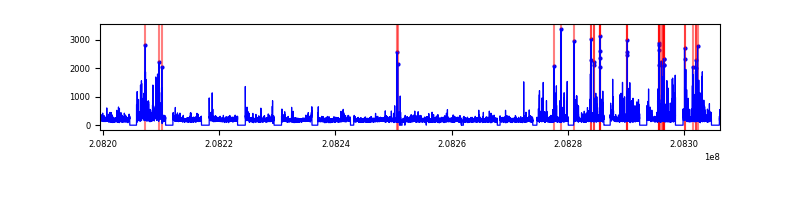 |
| B | 106692 | 90987 | 57 | 57 | 0.05% | 0.06% |  |
| C | 106692 | 91004 | 8 | 8 | 0.01% | 0.01% | 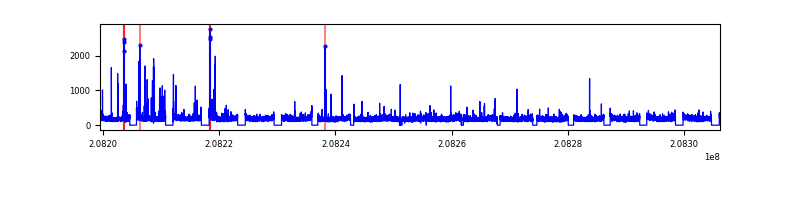 |
| D | 106692 | 90987 | 422 | 422 | 0.40% | 0.46% |  |
Top three noisy pixels from each quadrant. If the there are fewer than three noisy pixels in the level2.evt file, extra rows are filled as -1
| Pixel properties | Quadrant properties | ||||||
|---|---|---|---|---|---|---|---|
| Quadrant | DetID | PixID | Counts | Sigma | Mean | Median | Sigma |
| A | 7 | 16 | 1227586 | 1226.44 | 4417 | 4303 | 997.4 |
| A | 14 | 111 | 913865 | 911.91 | 4417 | 4303 | 997.4 |
| A | 8 | 15 | 119073 | 115.07 | 4417 | 4303 | 997.4 |
| B | 10 | 16 | 919623 | 1040.15 | 4502 | 4359 | 879.9 |
| B | 15 | 204 | 694029 | 783.77 | 4502 | 4359 | 879.9 |
| B | 14 | 167 | 617799 | 697.14 | 4502 | 4359 | 879.9 |
| C | 1 | 16 | 246378 | 251.98 | 4328 | 4252 | 960.9 |
| C | 8 | 128 | 40666 | 37.9 | 4328 | 4252 | 960.9 |
| C | 9 | 247 | 36782 | 33.85 | 4328 | 4252 | 960.9 |
| D | 13 | 235 | 5445933 | 5603.16 | 4208 | 4048 | 971.2 |
| D | 8 | 112 | 5341167 | 5495.29 | 4208 | 4048 | 971.2 |
| D | 2 | 63 | 919584 | 942.67 | 4208 | 4048 | 971.2 |
Histogram calculated using DETX and DETY for each event in the final _common_clean file
| Quadrant A |  |
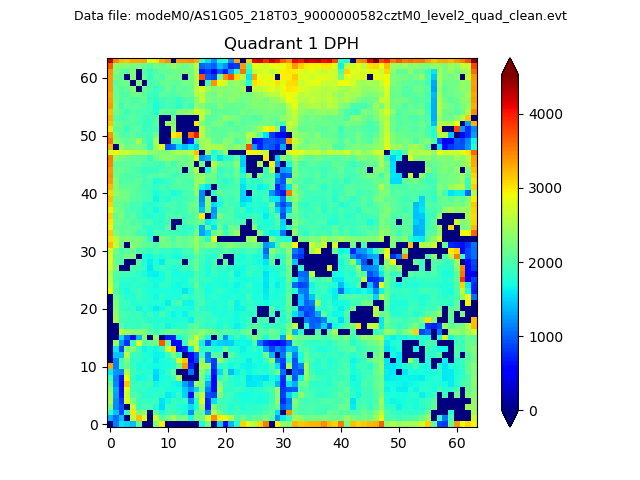 |
Quadrant B |
|---|---|---|---|
| Quadrant D | 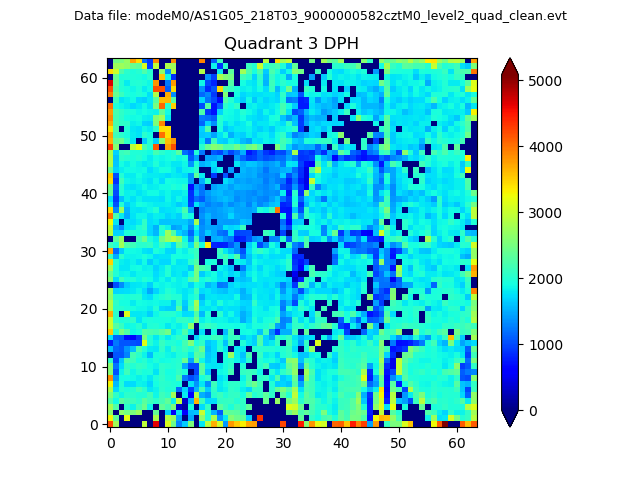 |
 |
Quadrant C |
| Plot type | Count rate plots | Images |
|---|---|---|
| Comparison with Poisson distribution Blue bars denote a histogram of data divided into 1 sec bins. Red curve is a Poisson curve with rate = median count rate of data. |
 |
 |
| Quadrant-wise count rates Data is divided into 100 sec bins |
 |
|
| Module-wise count rates for Quadrant A Data is divided into 100 sec bins |
 |
 |
| Module-wise count rates for Quadrant B Data is divided into 100 sec bins |
 |
 |
| Module-wise count rates for Quadrant C Data is divided into 100 sec bins |
 |
 |
| Module-wise count rates for Quadrant D Data is divided into 100 sec bins |
 |
 |
| Parameter | Plot |
|---|---|
| CZT HV Monitor |  |
| D_VDD | 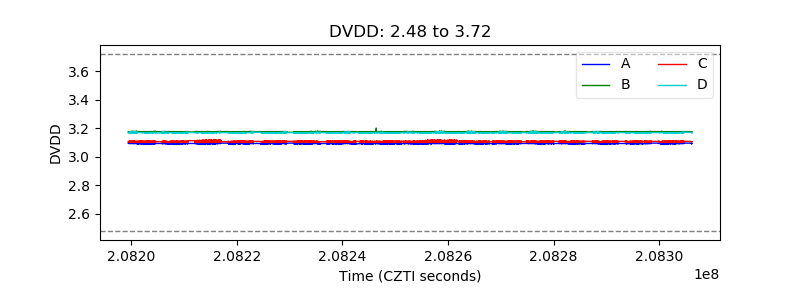 |
| Temperature 1 |  |
| Veto HV Monitor |  |
| Veto LLD | 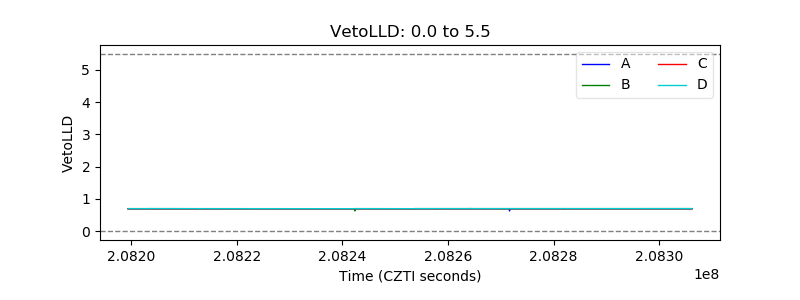 |
| Alpha Counter |  |
| _CPM_Rate |  |
| CZT Counter |  |
| +2.5 Volts monitor |  |
| +5 Volts monitor |  |
| _ROLL_ROT | 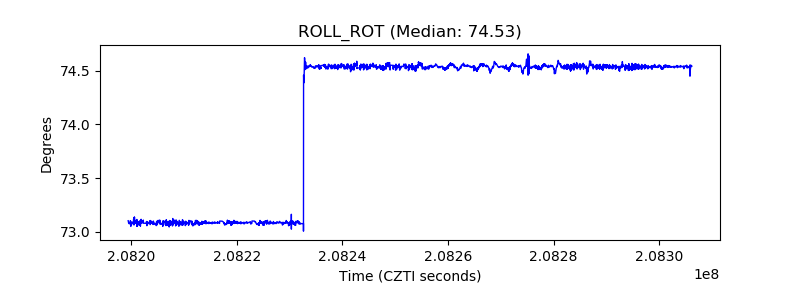 |
| _Roll_DEC | 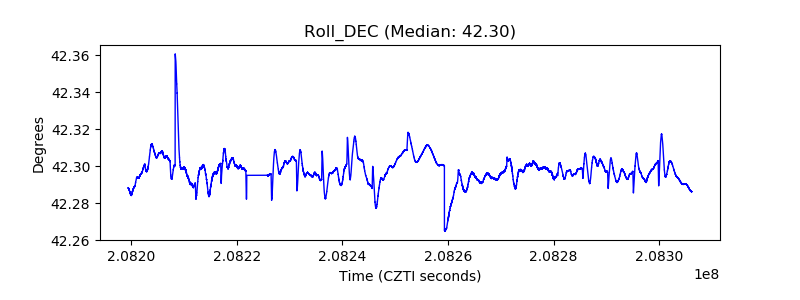 |
| _Roll_RA | 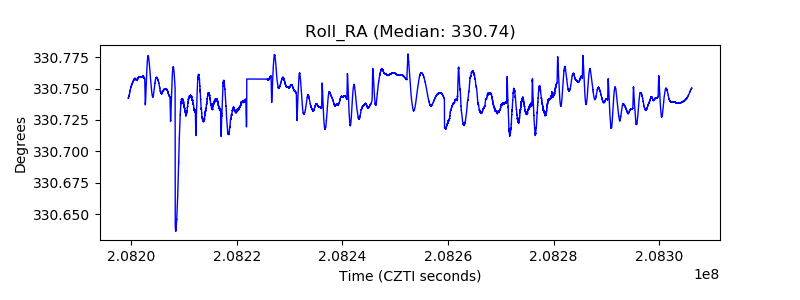 |
| Veto Counter |  |